Universidade do Minho
Escola de Economia e Gestão
Patrícia Araújo Pereira
abril de 2018
The impact of socially responsible investing
on the performance of European bond portfolios
Patrícia Ar
aújo P
er
eir
a
The impact of sociall
y responsible inves
ting on t
he per
formance of European bond por
tfolios
UMinho|20
Patrícia Araújo Pereira
The impact of socially responsible investing
on the performance of European bond portfolios
Trabalho efetuado sob a orientação da
Professora Doutora Maria do Céu Cortez
Dissertação de Mestrado
Mestrado em Finanças
Universidade do Minho
Escola de Economia e Gestão
DECLARAÇÃO
Nome: Patrícia Araújo Pereira
Endereço eletrónico: patriciaar.pereira@gmail.com Número do Cartão de Cidadão: 13429852
Título da dissertação: The impact of socially responsible investing on the performance of
European bond portfolios
Orientador: Professora Doutora Maria do Céu Cortez Ano de Conclusão: 2018
Designação do Mestrado: Finanças Escola: Escola de Economia e Gestão
É AUTORIZADA A REPRODUÇÃO INTEGRAL DESTA TESE APENAS PARA EFEITOS DE INVESTIGAÇÃO, MEDIANTE DECLARAÇÃO ESCRITA DO INTERESSADO, QUE A TAL SE COMPROMETE.
Universidade do Minho, 30 de Abril de 2018 Assinatura:
ACKNOWLEDGEMENTS
I am very proud for having this moment to acknowledge the people who contribute to the success of this dissertation.
I would especially like to thank Professor Maria do Céu Cortez, my supervisor, for sharing information and knowledge and being patient, but mainly for asking the right questions. These insightful questions allowed me to do a deep research and reach important and interesting conclusions. I am thankful for the guidance. In addition, I would also like to thank her for being available to help me share the results of this dissertation in conferences as well as to Professor Gilberto Loureiro for supporting it as the Director of Master in Finance. I would also like to acknowledge Professor Florinda Silva for her advices on the research seminars and EEG Research Day. Furthermore, I would like to thank the iBoxx team for sharing the information I needed.
Clearly, I am grateful to my parents and friends, especially to my sister Filipa for looking after our grandmother when I needed further time to finish this journey. Thank you Filipa for being by my side.
ABSTRACT
This dissertation investigates the performance of socially screened bond portfolios of 189 Eurozone companies between 2003 and 2016. Bond portfolios are formed on the basis of an aggregate measure of corporate social responsibility (CSR) as well as on specific dimensions of CSR: the environment, social and governance dimensions. The high- and low-rated portfolios consist of the best and worst socially low-rated companies with bonds in each period, respectively. Our results suggest that the performance of high-rated bonds is not statistically different from that of low-rated bonds. We further analyze the evolution of bond portfolio performance over time. The results indicate that in an earlier stage portfolios of high-rated bonds outperformed portfolios of low-rated bonds. Yet, over time this outperformance diminishes and loses statistical significance. These results suggest that the errors-in-expectations hypothesis and the shunned-stock hypothesis are not only useful to explain the performance of equity portfolios but they are also useful in explaining the performance of fixed-income securities over time. When analyzing the performance of SRI bond portfolios in different market states, the results show no performance differences in periods of recessions compared to expansions.
RESUMO
Esta dissertação investiga o desempenho de carteiras de obrigações socialmente responsáveis de 189 empresas da zona euro entre 2003 e 2016. As carteiras de obrigações são formadas com base numa medida agregada de responsabilidade social empresarial bem como em dimensões específicas de responsabilidade social empresarial: dimensão ambiental, social e de governação. As carteiras com classificações altas e baixas incluem as melhores e piores empresas (em termos de responsabilidade social) com obrigações em cada período, respetivamente. Os nossos resultados sugerem que o desempenho de obrigações com classificações altas não é estatisticamente diferente do das obrigações com classificações baixas. Analisamos, adicionamente, a evolução do desempenho das carteiras de obrigações ao longo do tempo. Os resultados indicam que numa primeira fase as carteiras com classificações altas superaram o desempenho das carteiras com avaliações baixas. No entanto, ao longo do tempo o seu desempenho diminuiu e perdeu significância estatística. Estes resultados sugerem que a errors-in-expectations hypothesis e shunned-stock hypothesis não são apenas úteis para explicar o desempenho de carteiras de ações mas são também úteis para explicar o desempenho de carteiras de obrigações ao longo do tempo. Ao analisar o desempenho de carteiras de obrigações socialmente responsáveis em diferentes estados do mercado, os resultados não mostram diferenças no desempenho em períodos de recessões em comparação com expansões.
INDEX
ACKNOWLEDGEMENTS ... III ABSTRACT ... V RESUMO ... VII LIST OF FIGURES ... XI LIST OF TABLES ... XII LIST OF APPENDICES ... XIV
1. INTRODUCTION...1
2. LITERATURE REVIEW ...5
The performance of socially responsible investments: an overview ...5
2.1.1 Socially responsible investing in equities ... 6
2.1.2 Socially responsible investing in bonds ... 13
The effect of specific CSR dimensions on portfolio performance ...15
Time effects on the performance of socially responsible investments ...19
2.3.1 Longevity of SRI outperformance ... 19
2.3.2 Resilience in SRI portfolio performance in times of crisis ... 21
3. METHODOLOGY ...23
Portfolio formation ...23
Unconditional models of performance evaluation ...25
Conditional models of performance evaluation ...27
The estimation process of the models ...33
4. DATA ...35
Data on social scores ...35
Sample ...36
Other data ...45
SRI bond portfolios formed by using a positive screening strategy ...48
5.1.1 Performance evaluation of SRI bond porfolios ... 48
5.1.2 Robustness tests ... 59
5.1.2.1 Performance of alternative cut-off portfolios ... 59
5.1.2.2 Correction for outliers ... 64
5.1.2.3 Performance of equally-weighted portfolios ... 66
5.1.3 Evolution of social and financial performance over time ... 69
5.1.3.1 Consistency of social ratings over time ... 69
5.1.3.2 SRI bond financial performance over time ... 72
5.1.3.3 Portfolio performance in times of crisis ... 84
SRI bond portfolios formed by using a best-in-class strategy ...88
5.2.1 Performance of SRI portfolios ... 88
5.2.2 Evolution of social and financial performance over time ... 91
5.2.2.1 SRI bond financial performance over time ... 91
5.2.2.2 Portfolio performance in times of crisis ... 94
Discussion of results ...97
6. CONCLUSION ... 100
REFERENCES ... 103
LIST OF FIGURES
LIST OF TABLES
Table 1. Descriptive statistics of ESG scores ... 39
Table 2. Descriptive statistics of ESG scores on portfolios (positive screening strategy) ... 40
Table 3. Descriptive statistics of credit ratings on portfolios (positive screening strategy) ... 42
Table 4. Descriptive statistics of portfolios (positive screening strategy) ... 44
Table 5. Descriptive statistics on the factors used in the performance evaluation models ... 46
Table 6. Descriptive statistics on the information variables used in the conditional models ... 47
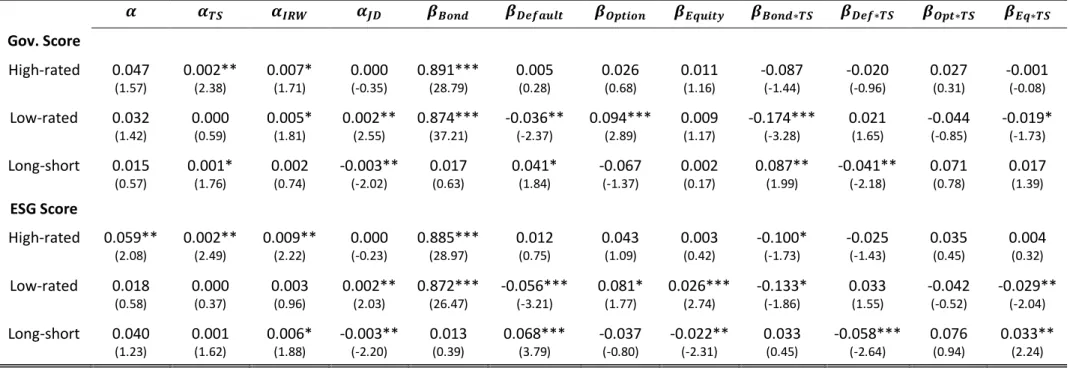
Table 7. The performance of portfolios formed on individual and combined ESG scores (positive screening strategy) - multifactor model ... 50
Table 8. The performance of portfolios formed on individual and combined ESG scores (positive screening strategy) - conditional multifactor model ... 54
Table 9. Comparison of alphas between the unconditional and conditional models (positive screening strategy) ... 58
Table 10. The performance of portfolios formed on individual and combined ESG scores (positive screening strategy) - alternative cut-offs ... 61
Table 11. Comparison of conditional alphas between alternative cut-offs (positive screening strategy) ... 64
Table 12. Comparison of conditional alphas between alternative cut-offs (positive screening strategy) - without outliers ... 66
Table 13. The performance of portfolios formed on individual and combined ESG scores (positive screening strategy) - equally-weighted portfolios ... 68
Table 14. The performance of long-short portfolios formed on individual and combined ESG scores with a 50% cut-off (positive screening strategy) - analysis for expanding windows ... 74
Table 15. The performance of portfolios formed on individual and combined ESG scores with a 50% cut-off (positive screening strategy) - sub-periods ... 78
Table 16. The performance of long-short portfolios formed on individual and combined ESG scores with alternative cut-offs (positive screening strategy) - analysis for expanding windows ... 81
Table 17. The performance of portfolio formed on the combined ESG score divided into quartiles (positive screening stragey) - analysis for expanding windows ... 83
Table 18. The performance of portfolios formed on individual and combined ESG scores (positive screening strategy) - dummy variable model ... 86
Table 19. The performance of portfolios formed on individual and combined ESG scores (best-in-class strategy) - conditional multifactor model ... 90
Table 20. The performance of long-short portfolios formed on individual and combined ESG scores (best-in-class strategy) - analysis for expanding windows ... 92 Table 21. The performance of portfolios formed on individual and combined ESG scores
LIST OF APPENDICES
Appendix A. Number of bonds and companies for each country and industry ... 115 Appendix B. Histogram of ESG Scores ... 116 Appendix C. Descriptive statistics of ESG scores on portfolios (positive screening strategy) -
alternative cut-offs ... 117 Appendix D. Credit rating classifications ... 119 Appendix E. Exposition of portfolios to investment and speculative grade bonds ... 120 Appendix F. Descriptive statistics of portfolios (positive screening strategy) – alternative cut-offs . 121 Appendix G. Correlations between factors and information variables ... 123 Appendix H. Regression results for the portfolios using the multi-factor model with a broader bond
market index (positive screening strategy) ... 124 Appendix I. The performance of portfolios formed on individual and combined ESG scores without
1. INTRODUCTION
The main goal of this dissertation is to investigate the impact of socially responsible investing on the performance of fixed-income portfolios. According to the European Sustainable Investment Forum (EUROSIF, 2016, p. 9), “Sustainable and Responsible Investment is a long-term oriented investment approach, which integrates ESG (Environmental, Social and Governance) factors in the research, analysis and selection process of securities within an investment portfolio. It combines fundamental analysis and engagement with an evaluation of ESG factors in order to better capture long-term returns for investors, and to benefit society by influencing the behaviour of companies.”
There is clearly a growing number of investors applying extra-financial criteria in their bond portfolio selection process. For instance, regarding socially responsible investment (SRI) asset allocation in Europe, there has been a significant increase in bond investing, which represented by December 2015 around 64% of the SRI market compared to 40% registered in December 2013. By 2015, the equity segment of the SRI market accounted for around 30% of SRI assets under management, indicating a significant decrease from the previous year’s 50% weight (EUROSIF, 2016).
The growth of SRI in financial markets has attracted the interest of academics, who discuss the financial impact of considering social criteria in the portfolio selection process. Does considering social criteria benefit or penalize portfolio performance? Most studies in the financial literature address this issue by comparing the financial performance of SRI and conventional mutual funds, as Bauer et al. (2005) and Renneboog et al. (2008) in relation to equity investments, and Derwall and Koedijk (2009) and Leite and Cortez (2018) in relation to fixed-income investments. However, analyzing the effects of socially responsible investments by evaluating SRI mutual fund performance has some limitations. First, it is difficult to disentangle the performance that is due to the skills of the fund manager with the performance that is associated to the socially responsible characteristics of the companies held by the funds (Kempf and Osthoff, 2007). Second, fund returns reflect management fees and not only the returns of the funds’ holdings (Auer, 2016). Third, there is evidence suggesting that the fact that a fund is classified as socially responsible does not ensure that it
is complying with ethical or social criteria (Auer, 2016). To avoid these problems, several studies propose evaluating the performance of socially responsible investments by analyzing the performance of synthetic portfolios formed on the basis of stocks’ social characteristics. This dissertation follows this approach to evaluating socially responsible investments.
Despite the growth of asset allocation to socially responsible bonds, the majority of the empirical evidence on socially responsible investments is concentrated on the equity segment of the market and the performance of SRI fixed-income investments is far less explored. Furthermore, the few studies on the SRI fixed income area focus on the performance of actively managed mutual funds. In addition, most studies on the relationship between social ratings, credit costs, and default risk focus on the US market (Schröder, 2014). To the best of our knowledge, Hoepner and Nilsson (2017) is the only study exploring how the ESG ratings of companies can affect the performance of fixed-income portfolios, but their study is limited to the US market. In relation to the European market, to the best of our knowledge, there is no investigation on the performance of SRI bond portfolios formed on the basis of social criteria.
In this context, the main objective of this dissertation is to contribute to the SRI portfolio literature by investigating the effects of considering social criteria in European fixed income portfolios. In particular, we form mutually exclusive bond portfolios with high and low social ratings and investigate the impact of several social screens on the performance of such bond portfolios. Besides an aggregate measure of corporate social responsibility (CSR), we also consider individual dimensions of CSR, because there might be important social characteristics of companies that might end up hidden when using a broad indicator of CSR, as argued by Hoepner et al. (2016). The sample consists of Eurozone companies covered by ASSET4 ESG between 2003 and 2016. This source of social data has been used in several recent studies on SRI portfolio performance. Some of the advantages of ASSET4 are the consistency in the reporting and a lower likelihood of occuring matching errors, since Thomson Reuters also provides financial information on the companies (Gonenc and Scholtens, 2017). We employ the positive/ESG integration and best-in-class strategies in the bond portfolio selection process, as in Kempf and Ostoff (2007). However, since socially responsible investments following the ESG integration approach represent a higher amount of assets under management (AuM) in 2015 than those using the best-in-class approach, this
study focuses mainly on portfolios formed on the basis of the ESG integration strategies.1
Portfolio performance is evaluated using unconditional and conditional multi-factor models with both time-varying alphas and betas. In addition, we also present empirical evidence on time-related issues, since several studies seem to suggest time-dependency of socially responsible portfolio performance. In terms of bond investing, to the best of our knowledge this is the first study providing evidence that supports the errors-in-expectations hypothesis and the shunned-stock hypothesis.
The results of this study are of major interest for academics and investors. The investment decision can be viewed as a top-down process: (i) Capital allocation between the risky portfolio and risk-free assets, (ii) asset allocation in the risky portfolio, and (iii) security selection (Bodie et al., 2014, p. 205). The investor’s degree of risk aversion is used to calculate the optimal proportion of the capital allocation between the risky portfolio and the risk-free asset. In addition, since risky portfolios of less than perfectly correlated asset classes offer diversification benefits, the incorporation of equity securities and bonds in a portfolio increases efficiency gains. As mentioned by Leite and Cortez (2018), fixed-income studies lead to better asset allocation decisions because they improve the understanding of socially responsible investments for a different asset class besides equity. Therefore, it is useful to investigate whether it is possible to do “well while doing good” with fixed-income portfolios. However, according to modern portfolio theory, the imposition of any social screens will restrict the investors’ investment universe, leading to lower portfolio performance. Therefore, the empirical results on the effects of social screening in portfolio performance has implications to controversial issues in Finance, such as market efficiency and asset pricing. Moreover, although several studies claim that bonds constitute a homogenous asset class and bond returns are a function of systematic risk factors (Derwall and Koedijk, 2009), other studies (e.g., Dynkin et al., 1999; Hottinga et al., 2001; and Dynkin et al., 2002), show that the firm-specific risk is also a share of the risk of corporate bonds. This suggests that SRI might also have an impact on bond investment performance.
The remainder of this paper is organized as follows. Chapter 2 reviews the literature on the performance of SRI funds and portfolios. Chapter 3 presents the methodology used to
1 According to EUROSIF (2016), all responsible investment strategies have grown in the last years in Europe. By 2015, investments following
assess portfolio performance and chapter 4 describes the data. Chapter 5 presents and analyzes the empirical results. Finally, chapter 6 presents the main conclusions, the limitations of this study, as well as suggestions for future research.
2. LITERATURE REVIEW
This chapter reviews the literature on the impact of non-economic indicators on portfolio performance. It starts with an overview of socially responsible investing and the performance of equity and fixed-income SRI portfolios. Although this dissertation follows the approach that evaluates the performance of socially responsible investments by forming synthetic SRI portfolios, the discussion will also cover studies on indices and actively managed mutual funds, considering the attention the literature has given to this area. It is also important to keep in mind that studies that evaluate the performance of synthetic SRI portfolios may form portfolios according to an aggregate indicator of CSR or, alternatively, using individual dimensions of CSR (e.g., environment, governance, labour relations, etc.). Several studies (e.g., Hoepner et al., 2016) find that the relation between financial performance and social performance is better assessed when using indicators that represent individual dimensions of CSR, such as environment, labour relations, and governance. Hence, this chapter distinguishes portfolio studies that use aggregate measures of CSR from those that use such individual dimensions of CSR as indicators of the companies’ social standards. Finally, this chapter discusses empirical evidence on time-related issues, since several studies seem to suggest time-dependency patterns of socially responsible portfolio performance.
THE PERFORMANCE OF SOCIALLY RESPONSIBLE INVESTMENTS: AN OVERVIEW
There are several hypotheses on the performance of socially screened portfolios. The hypothesis of underperformance of SRI portfolios derives directly from finance theory. According to Markowitz (1952), the portfolio mean-variance optimization framework implies diversification across companies with different economic and financial characteristics. Accordingly, the imposition of any social screens will restrict the investment opportunity set,
leading to lower portfolio performance. The additional information costs implied by the screening process are another argument in favour of a lower performance of SRI portfolios (Cortez et al., 2009). The underperformance hypothesis of SRI portfolios is further supported by several studies (e.g., Hong and Kacperzyck, 2009; Statman and Glushkov, 2009; Derwall et
al., 2011) that find that stocks in controversial activities such as tobacco, alcohol and
weapons, which are typically avoided by values-driven investors, yield abnormal returns. By excluding these stocks, socially responsible investors will not be able to benefit from these abnormal returns, whereas other investors might do so.
In contrast, consistent with stakeholder theory (Freeman, 1984), supporters of the outperformance of socially responsible investing argue that companies that consider the all stakeholders’ interests might benefit from long-term higher performance. The underlying argument is that companies that are more socially responsible are better managed - CSR can be viewed as a source of competitive advantage that could be reflected in higher financial performance and higher shareholder value (Nollet et al., 2016). This perspective is opposed to the traditional Milton Friedman (1962) viewpoint that the social responsibility of a business is solely to increase profits and any use of resources with a different purpose (such as CSR activities) will generate inefficiencies. A seminal paper on the benefits of socially responsible investing is Moskowitz (1972), who states that individuals and institutions may benefit from considering social screens in making investment decisions, and corporate actions on this matter have a positive influence on publicly traded shares.
2.1.1 SOCIALLY RESPONSIBLE INVESTING IN EQUITIES
More than four decades after Moskowitz’s (1972) seminal paper, many empirical studies have addressed the performance of socially responsible investing. Some studies investigate this topic by evaluating the performance of socially responsible indices. Most studies in this line of research, such as Statman (2006), Schröder (2007) and Collison et al. (2008) document that the performance of social indices is comparable to the performance of conventional market indices.
Another line of research focuses on the performance of SRI mutual funds. Most empirical evidence on equity mutual funds finds no evidence of significant differences between the performance of ethical and conventional funds. Hamilton et al. (1993), using a US sample of funds, show that the performance of SRI funds is similar to the performance of
conventional funds. However, it is important to mention that the authors only use the traditional Capital Asset Pricing Model (CAPM) - based single-index model to evaluate fund performance. Reyes and Grieb (1998) and Bello (2005) document similar results for the same market. Studies on other markets include Scholtens (2005) on Dutch funds, Gregory and Whittaker (2007) on UK funds, Bauer et al. (2007) and Ayadi et al. (2016) on the Canadian market and Leite et al. (2018) on the Swedish market. The results of these studies are consensual in the sense that they find that the performance of SRI funds is not statistically different from that of conventional funs.
Papers that evaluate the performance of SRI funds in multiple markets also show that the performance of SRI funds is comparable to the performance of conventional funds (e.g., Schröder, 2004; Kreander et al., 2005). Bauer et al. (2005), using a sample of German, UK and US SRI mutual funds for the period between 1990 and 2001, find no evidence of significant differences in performance between SRI and conventional funds, even after considering management fees. The authors use the Carhart (1997) 4-factor model and show that SRI funds are less exposed to the market portfolio and are either more growth-oriented or less value-oriented in comparison to conventional funds. The authors also find that conventional indices are more useful than ethical indices in explaining SRI fund returns. Cortez et al. (2009) investigate SRI equity and balanced mutual funds from seven European countries investing globally or in the European market and find that their performance is neutral relative to the market. As Bauer et al. (2006, 2007), the authors use the conditional approach to performance evaluation and show evidence of time-varying betas in SRI funds, suggesting that the conditional models are more reliable to evaluate performance than unconditional ones.
In contrast to the previous literature, a few studies find statistically significant differences between socially screened and unscreened mutual funds. Renneboog et al. (2008) analyze SRI funds from 17 countries between 1991 and 2003 also using conditional models. While the SRI funds' alphas are in almost all countries lower than those of conventional funds, their risk-adjusted returns are only statistically different in France, Ireland, Sweden, and Japan. On the contrary, Gil-Bazo et al. (2010) find that US SRI funds perform better than conventional funds.
As mentioned previously, studies on SRI mutual funds suffer from several limitations. First, SRI mutual fund performance can be a results of both the skills of the fund manager and the socially responsible characteristics of the companies held by funds (Kempf and Osthoff, 2007). Second, fund returns can reflect management fees, as also pointed out by Kempf and Ostoff (2007). Third, there is evidence suggesting that the fact that a fund is classified as socially responsible does not ensure that it is following the ethical or social criteria disclosed in their prospectus (Auer and Schuhmacher, 2016). For instance, Wimmer (2013) finds that funds classified as socially responsible considerably change their social standards over time (they tend to decrease after two years). Also, Utz and Wimmer (2014) document that, on average, SRI funds do not hold more socially responsible companies than conventional funds do. To avoid these problems, several studies construct synthetic portfolios on the basis of an aggregate or a specific dimension of CSR and evaluate the financial performance of these portfolios. In this section, we will review studies that consider an aggregate indicator of CSR in forming SRI portfolios. Aggregate indicators of CSR reflect the multidimensional nature of this concept, and as Waddock and Graves (1997, p.304) mention, encompass a wide range of aspects: inputs (e.g., investment in environmental equipment), internal processes (e.g., treatment of women and minorities, nature of products, relationship with customers) and outputs (e.g. community relations). Waddock et al. (2000) further claim that aggregate measures of CSR represent a significant advance over prior unidimensional measures.
According to Kempf and Osthoff (2007), one of the most cited studies in the field, investors can earn high abnormal returns from a strategy involving a long position in the high-rated social portfolio and a short position in the low-high-rated social portfolio. This study considers a sample of US companies over the period from 1991 to 2004 using ESG ratings provided by KLD. This conclusion is even more clear considering industry-balanced investment portfolios, i.e., using the best-in-class screening strategy, since this approach typically leads to the highest alphas (up to about 8.7% per year), specially with extreme social ratings. The results show that the alphas remain significant even after taking into account reasonable transaction costs. Furthermore, the results obtained from value- and equally-weighted portfolios are similar.
Filbeck et al. (2009) also find a positive effect of considering SRI screens on portfolio performance. The authors evaluate the performance of a portfolio consisting of the 100 Best
Corporate Citizens published by Business Ethics compared to the performance of the S&P 500
and that of a matched sample of companies (matched by market capitalization and BE/ME ratio). The authors find that an investor can form a portfolio of the new companies on the list and outperform both benchmarks in the long term. For this purpose, investors can rebalance their portfolio holdings every year, by adding the newly listed companies and dropping the consecutive winners. The authors use several approaches to evaluate portfolio performance, such as the Fama and French (1993) three-factor and the Carhart (1997) four-factor models.
Borgers et al. (2013) develop an aggregate stakeholder-relations index on a yearly basis based on social indicators provided by KLD. The authors state that a portfolio composed of the top-ranked social stocks earn a higher average annualized risk-adjusted return than its bottom-ranked counterpart, which is consistent with the two previous studies. In turn, Mollet
et al. (2013) analyze a sample of small European growth SRI firms selected according to the
social scores provided by the sustainability research of the Zurich Cantonal Bank and find that the portfolio yields statistically significant positive abnormal returns.
Auer (2016) argues that the type of ethical screening strategy has implications on portfolio performance. Negative screens with low cut-off rates that exclude unrated stocks provide a significantly higher performance than a passive benchmark strategy. In contrast, positive screens can cause portfolios to underperform the benchmark because of a loss of diversification. Therefore, investors should eliminate the worst socially rated firms.
Several studies find a zero effect of social screens in portfolio performance. Statman and Glushkov (2009), using a US sample over the period from 1992 to 2007 from KLD database, find evidence that stocks of socially responsible companies yield higher returns than those of conventional companies. However, this advantage is offset from the exclusion of shunned companies. Hence, they support the “no effect” hypothesis. Similar to Kempf and Osthoff (2007), the authors also state that investors should consider best-in-class portfolios since this strategy leads to the best performance. Unlike Kempf and Osthoff (2007), the authors find differences in the statistical significance of the excess returns between value- and equally-weighted portfolios. They attribute this variation to the higher standard deviation of the returns of value-weighted portfolios. In consequence, these portfolios are less diversified.
According to Halbritter and Dorfleitner (2015), there are no significant return differences between portfolios of companies with high and low ESG rating levels. This finding is robust for a variation of portfolio cut-offs, weighting schemes and also when considering industry-balanced investment portfolios. The authors state that investors should no longer expect abnormal returns on this matter. The sample includes ESG data of ASSET4, Bloomberg and KLD for the US market from 1991 to 2012.
Outside the US, Van de Velde et al. (2005) show that portfolios of high-rated European companies perform better than low-rated ones but not to a significant extent. Brammer et al. (2006) suggest a negative effect of SRI screens in the UK since they find that companies with low social ratings present higher abnormal returns than companies with high social ratings. However, the differences between the two portfolios are not statistically significant. Brzeszczyñski and McIntosh (2014) suggest a positive effect of SRI screens in the UK market, but the results are not statistically significant.
Mollet and Ziegler (2014) address the US and European market and document that socially responsible stocks are correctly priced by market participants since there are no statistically significant abnormal returns resulting from SRI portfolios. The authors suggest that the learning process of market participants in the years before 1998 eliminated possible errors-in-expectations of investors and, therefore, the market has recognized the positive impact of CSR.
Auer and Schuhmacher (2016) document that investors in the US and Asia-Pacific market tend to have no significant financial advantages or disadvantages from investing in an (un)ethical portfolio choice with high- or low-rated stocks. However, in certain industries and depending on the ESG criterion, investors in Europe pay a price for being socially responsible in their stock selection process.
Galema et al. (2008) explain the discrepancy between the theoretical literature that suggests a positive relationship between SRI and stock returns and most of the empirical literature that finds a zero effect of SRI on performance. On the one hand, the impact of aggregated ESG scores can generate misleading inferences (Callan and Thomas, 2009) and eliminate any relationship if individual dimensions of social responsibility have opposite
effects on performance. However, the authors find little evidence in support of this hypothesis. Derwall et al. (2011) also put forward an explanation for the neutral performance of SRI portfolios. Derwall et al. (2011) develop two hypotheses with contrasting effects on performance, which ultimately will cancel out each other and result in neutral portfolio performance. The shunned-stock hypothesis claims that values-driven investors shun socially controversial stocks and, hence, these stocks present higher returns. Alternatively, according to the errors-in-expectations hypothesis, socially responsible stocks might have abnormal returns if the market does not immediately incorporate CSR practices on the companies’ intrinsic value. However, the authors expect that any abnormal returns associated to errors-in-expectations to be temporary, since in the long run it is expected that investors recognize the importance of CSR information.
According to Galema et al. (2008), it is also relevant to mention that most researchers control for risk using the high minus low (HML) book-to-market ratio from the Fama and French (1992) asset pricing model. Nevertheless, for firms with equal risk levels, socially responsible stocks present lower book-to-market ratios because of their excess demand. As a result, the alphas do not capture CSR effects. In addition, Schröder (2014) documents that funds and indices do not generate outperformance in most cases because they include the few companies with very good social ratings and companies with not so good ratings. Indeed, Kempf and Osthoff (2007) only find a significant outperformance for portfolios formed with extreme social ratings (the 10% companies with the best rating). Using the top 50% of social ratings, the results cease to be statistically significant (Kempf and Osthoff, 2007).
A set of studies provide evidence of the effects of SRI on performance by analyzing how sin stocks perform. Sin stocks are appealing to analyze due to their addiction and undesirable consequences (Hong and Kacperczyk, 2009). Hong and Kacperczyk (2009) define sin stocks as publicly traded companies involved in the production of alcohol, tobacco, and gaming. Considering the market segmentation that stems from Merton’s (1987) incomplete information model, the authors present two reasons for sin stocks being cheaper than conventional stocks. The model posits that neglected stocks tend to trade at a discount because they have a smaller investor base. Under this reasoning, Hong and Kacperczyk (2009) argue that the avoidance of sin stocks by investors leads to lower prices relative to their fundamental values because of limited risk sharing. Also, Merton (1987) shows that the CAPM
does not holds and unsystematic risk matters under limited risk sharing. Hence, the increased litigation risk should increase the expected returns of sin stocks. Hong and Kacperczyk (2009) focus on sample of US companies from 1926 to 2004 and show that sin stocks outperform comparable stocks even after considering robustness tests and the extension of the analysis to international markets as an out-of-sample test.
The outperformance of sin stock portfolios is also documented in other studies. Liston and Soydemir (2010) find statistically significant positive and negative abnormal returns for a sin portfolio and for a faith-based portfolio (using religious screens), respectively. The authors point out the norm-neglect hypothesis of Hong and Kacperczyk (2009) as a possible explanation for the sin stock portfolio outperformance. Trinks and Scholtens (2017) also find that investing in controversial stocks can result in additional risk-adjusted returns. The authors investigate the performance of an international sample of companies on fourteen potentially controversial issues over the period between 1991 and 2012.
Kempf and Osthoff (2007) and Statman and Glushkov (2009) also present somewhat similar conclusions, but the differences between sin and accepted stocks are not statistically significant.2 This can be due to the wider definition of controversial business areas from the
KLD database (Derwall et al., 2011) since it also includes firms with firearms, military, and nuclear operations. Fabozzi et al. (2008), using a sample of 21 markets between 1970 and 2007, find a superior performance of the sin portfolio, which is robust across different time periods, industries, and national markets. The authors consider a wider range of controversial industries, which also includes biotech and adult services.
Lobe and Walkshäusl (2016) define sin stocks as companies involved in the adult entertainment, alcohol, gambling, nuclear power, tobacco, and weapons industries, according to the Industry Classification Benchmark (ICB). The authors do not find evidence that sin stocks or socially responsible stocks outperform the market in different regions over the period 1995 to 2007. Considering that Hong and Kacperczyk (2009) show evidence of positive abnormal returns, Lobe and Walkshäusl (2016) also use an approach that is similar to the one used by Hong and Kacperczyk (2009) for the US sample. However, their first
2 Statman and Glushkov (2009) find a positive alpha when using the CAPM and the three-factor model but this result is not observed when
conclusions still hold. An as explanation, the authors state that the long sample period of Hong and Kacperczyk (2009) can drive their results as it appears that the 1960s and 1970s mainly drive the US financial outperformance of sin stocks.
The studies reviewed in this chapter present different conclusions regarding the relationship between social and financial performance. In order to shed light on the effects of including social criteria in the portfolio selection process, Revelli and Viviani (2015) perform a meta-analysis of extant studies on SRI performance. Focusing on empirical studies using data on mutual funds, portfolios and indices between 1972 and 2012, the authors conclude that the incorporation of CSR in the stock market does not add financial costs nor benefits compared with conventional investments. However, the review study of Schröder (2014), calls attention to the possibility that long-short portfolios outperform only when using extreme social ratings, as mentioned previously. In addition, the author points out the outperformance portfolios of stocks in sin sectors.
2.1.2 SOCIALLY RESPONSIBLE INVESTING IN BONDS
As previously mentioned, there are fewer studies on socially responsible investing in bonds compared to equities. Regarding the empirical evidence on fixed income mutual funds, Goldreyer and Diltz (1999) find negative and statistically significant alphas for US SRI bond funds. Derwall and Koedijk (2009) evaluate the performance of SRI fixed-income mutual funds in the US from 1987 to 2003. Using multi-index performance evaluation models, the authors show that SRI bond funds perform similar to conventional funds, while SRI balanced funds outperform conventional funds.
More recently, Henke (2016) shows that over the period 2001 to 2014 SRI bond funds in the US and the Eurozone outperform not only the market (however only at the 10% level in the Eurozone market) but also conventional funds. Furthermore, Henke (2016) shows that the outperformance of SRI bond funds is more evident during crisis periods. By analyzing the holdings of the funds, the author concludes that fund managers appear to implement a
worst-in-class exclusion rather than a best-worst-in-class inclusion screening typically more used by SRI equity funds.
Leite and Cortez (2018) investigate the performance of SRI bond and balanced funds domiciled in the leading Euro-area markets (France and Germany) from 2002 to 2014. The authors find no differences in the performance between SRI balanced and conventional funds. However, SRI bond funds significantly outperform their conventional peers, in line with Henke (2016). The authors claim that this outperformance seems more related to the government and not the corporate bonds they hold. Also, both SRI and conventional balanced funds as well as conventional bond funds underperform the market. These results are in constrast with those of Derwall and Koedijk (2009), who find that the performance of SRI balanced funds is neutral. Leite and Cortez (2018) also find that SRI bond funds exhibit neutral performance, while Henke (2016) observes outperformance of their US peers.
Regarding the direct construction of synthetic fixed-income portfolios, Hoepner and Nilsson (2017), using a US sample over the period from 2001 to 2014, explore the effect of responsible investing on bond performance. To the best of our knowledge, Hoepner and Nilsson (2017) is the only study that explores if a trading strategy in bonds, based on their ESG ratings, leads to abnormal returns. The results of Hoepner and Nilsson (2017) do not show evidence that bonds of companies with high ESG ratings outperform those of low ESG ratings companies, in contrast with Kempf and Osthoff (2007) in the context of ESG equity portfolios. In fact, the authors suggest “no news is good news” in ESG bonds since bonds issued by companies with no strengths, concerns or controversies outperform by 1.12% per year in comparison to bonds issued by companies with strengths and concerns. This result is robust when controlling for industry differences, differences in remaining maturity, and when analyzing value- and equally-weighted portfolios.
There is also empirical evidence on the effect of CSR on credit spreads, cost of debt, and credit risk. Oikonomou et al. (2014), using a US sample between 1991 and 2008 and social rating provided by KLD find that engaging in CSR and avoidance of controversies reduces the corporate bond yield spread and thus decreases the cost of corporate debt. The authors also find that higher levels of CSR lead to better credit quality and lower perceived credit risk. Ge and Liu (2015) and Bauer and Hann (2010) find similar results, with the latter concentrating
on environmental information. Additionally, according to Oikonomou et al. (2014), CSR seems to be important in the cases of highly rated bonds (A+ to A−) or very low-rated bonds (CCC+ or lower). Since low credit rated bonds present high yields, issuers of speculative grade bonds can benefit the most in absolute terms from the reductions in the cost of debt from CSR practices (Oikonomou et al., 2014). However, Menz (2010) shows, for a sample of European companies, that socially responsible firms do not have lower cost of public debt. In addition, the authors argue that a possible explanation might be that CSR information might not yet been incorporated into bond valuations.
Drut (2010) investigates socially responsible performance by analyzing sovereign bonds of 20 developed countries. The author finds that investors can create sovereign bond portfolios with high social ratings without significantly losing diversification and, hence, without a significant loss of mean–variance efficiency.
Schröder (2014) reviews several empirical studies on the performance of socially responsible investments and concludes that engaging in CSR practices reduces the default risk and the cost of debt. However, the author points out that most of the empirical evidence is limited to US companies.
THE EFFECT OF SPECIFIC CSR DIMENSIONS ON PORTFOLIO PERFORMANCE
Besides studies that construct portfolios based on an aggregate dimension of CSR, there are others that investigate the relationship between specific dimensions of CSR and financial performance. The argument to use indicators that represent individual dimensions of CSR is that there might be important social characteristics of companies (e.g., environment, labour relations, and governance) that might end up hidden when using a broad indicator of CSR. The underlying idea is that firms that target the concerns of specific stakeholders might benefit from more sizeable effects of this behavior (Hoepner et al., 2016).
This section discusses the literature that evaluates SRI performance by constructing synthetic portfolios on the basis of a specific dimension of CSR.3
Regarding the environmental criterion, Derwall et al. (2005) define eco-efficiency as an economic value that corresponds to the difference between what a company creates and the waste it makes (Derwall et al., 2005, p. 52). Using a US sample of companies over the 1995-2003 period and based on Innovest Strategic Value Advisors' corporate eco-efficiency scores, the authors conclude that the high-rated eco-efficient portfolio not only shows statistically significant abnormal returns but also outperforms the low-rated eco-efficient portfolio. The results are also statistically significant after taking into account transaction costs, when considering industry-adjusted portfolio returns using sensitive sectors only, and when using a portfolio based on the best-in-class approach. However, the conclusions do not hold when using equally-weighted portfolios. Between the latent risk factors and the mispriced hypothesis, the authors point out the market's inability to price eco-efficiency in the short run as an explanation for the results. In fact, this conclusion might also explain the reduction of the eco-efficiency premium in environmentally sensitive sectors where the benefits of eco-efficiency are more obvious.
Kempf and Ostoff (2007), using environmental scores from KLD, report that the high-rated portfolio yields a significant positive alpha, but this result is not observed neither for the long-short strategy nor the best-in-class approach. Galema et al. (2008), including all stocks covered by KLD database, document that constructing portfolios on the basis of an environmental screening does not lead to a significant outperformance. Brammer et al. (2006) find that the difference between high- and low-rated portfolios is not statistically significant in the UK. In turn, Van de Veld et al. (2005), Statman and Glushkov (2009) and Auer (2016) find no statistically significant results for the environmental screen. Auer and Schumacher (2016) find that high-rated environmental portfolios significantly underperform their benchmarks in the consumption and miscellaneous sectors in Europe. However, the results are not statistically significant in the United States and in the Asia-Pacific region.
3 For the sake of brevity, this section does not include studies that evaluate the performance of SRI funds that focus on a specific dimensions
of CSR. Examples of such studies include Climent and Soriano (2011), Muñoz, Vargas and Marco (2014) and Silva and Cortez (2016) on funds that screen on environmental criteria (so-called green funds).
Considering fixed-income securities, Hoepner and Nilsson (2017) show that any environmental news of a company has a negative effect on performance since both the high- and low-rated portfolios underperform the market benchmark between 2001 and 2014.
Regarding the social criterion (strictly speaking)4, Edmans (2011), using the list of “100
Best Companies to Work for in America”, finds that over the period 1984 to 2009 firms with high levels of employee satisfaction generate abnormal returns, which is consistent with human relations theories. A value-weighted portfolio of these companies presents an alpha of 3.50% and the results do not change after considering firm characteristics, different weighting methodologies, industry-adjusted portfolios and the removal of outliers. The authors explain the existence of abnormal returns with the possibility that the market fails to immediately incorporate the value of CSR practices.
Carvalho and Areal (2016), using the same list of companies as Edmans (2011), find that a portfolio of companies listed as the best places to work has a monthly abnormal return of 0.44% over the period 1998 to 2010. However, when risk is allowed to vary over time, by applying conditional models with a dummy to distinguish different market states (bull and bear markets), the alpha is no longer statistically significant for the aggregated portfolio. The authors also show that abnormal returns are concentrated in the top scoring companies.
Kempf and Ostoff (2007) find that the community screen yields a significant positive alpha when using the long-short strategy and the best-in-class approach for equally- and valued-weighted portfolios. The employee relations screen yields a significant positive alpha when using the long-short strategy and the best-in-class approach for valued-weighted portfolios. However, when considering the equally-weighted portfolios, only the long-short strategy presents significant results. The authors also suggest a positive abnormal return on the diversity and human rights screens, but the results are not statistically significant.
Statman and Glushkov (2009), using the same database as Kempf and Ostoff (2007) and simulating a long-short strategy based on the best-in-class approach, find positive and statistically significant results for portfolios formed on the basis of the employee relations screen. However, the community screen yields a significant result only when considering
equally-weighted portfolios. Galema et al. (2008) do not find statistically significant alphas for the employee and community screens using the Carhart (1997) 4-factor model. None of the three previous studies present a significant result for the human rights and products screen. Van de Veld et al. (2005) suggest that companies with the best customer and supplier ratings outperforms. However, once again, the results are not statistically significant. Brammer et al. (2006) suggest that high scores on the community and employment indicators lead to lower and higher returns, respectively. However, the differences between high- and low-scoring portfolios in both criteria are not statistically significant. According to Auer (2016), the social criterion does not generate any significant additional value. Considering this criterion, Auer and Schumacher (2016) find that high-rated portfolios significantly underperform their benchmarks in the consumption and financial sectors in Europe. However, the results are not statistically significant in the United States and in the Asia-Pacific region.5
In the fixed-income area, Hoepner and Nilsson (2017) suggest that bonds issued by companies with no ratings or neutral ESG scores outperform for community, diversity, and product safety screens. After controlling for industry effects, the portfolios classified as “no ratings” for employee relations, human rights and product safety screens present significant positive alphas.
Regarding the governance criterion, Gompers et al. (2003) construct a Governance Index “as a proxy for the balance of power between managers and shareholders” (Gompers
et al., 2003, p. 109). The authors show that during the 1990s, an investment strategy going
long in firms with strong shareholder rights and short in firms with weak shareholder rights earns abnormal returns of 8.5 percent per year. Focusing on the governance dimension, Auer (2016) states that a strategy of using negative screens with small cut-off rates provides a significantly higher performance than a passive benchmark strategy. However, Van de Veld
et al. (2005), Galema et. al (2008) and Statman and Glushkov (2009) find no statistically
significant results when using this criterion. Core et al. (2006) consider that the period studied in Gompers et al. (2003) may drive their results (Statman and Glushkov, 2009).
5 Although this section is focused on synthetic portfolio studies, it is worth to mention that Renneboog et al. (2008) find that actively
TIME EFFECTS ON THE PERFORMANCE OF SOCIALLY RESPONSIBLE INVESTMENTS 2.3.1 LONGEVITY OF SRI OUTPERFORMANCE
According to Derwall et al. (2011), the SRI movement can be divided into a values-driven approach, in which social and personal values are the sources to integrate CSR criteria, and into a profit-seeking approach which seek traditional financial performancee. The authors distinguish two hypotheses. The shunned-stock hypothesis, following Merton’s (1987) incomplete information model, claims that values-driven investors shun socially controversial stocks and hence these stocks will generate higher returns. Alternatively, according to the errors-in-expectations hypothesis, socially responsible stocks might have abnormal returns if the market does not immediately incorporate the value of CSR on expected cash flows. The authors expect enduring positive abnormal returns of shunned-stock over time due to the universal nature of social values. In contrast, the authors expect any abnormal returns associated to errors-in-expectations to be temporary, since in the long run investors should incorporate CSR information into security valuations. By constructing two portfolios and evaluating its performance over the period from 1992 to 2008, the authors confirm these claims. The annualized abnormal return on the shunned-stock portfolio ranges from 2.58% to 2.86% and is always statistically significant, while the annualized abnormal return of a high-rated portfolio formed on the basis of the employee relations criterion decreases from 5.62% to 2.81% over time.
Borgers et al. (2013) further provide evidence that stakeholder information is mispriced due to the market's inability to recognize CSR practices in the short term. Consistent with the errors-in-expectations hypothesis, the risk-adjusted returns decline as investors' attention for stakeholder information increases over time. For a range of US firms over the period 1992 to 2009, the authors split the sample in two subperiods. During the first subperiod the authors find that average risk-adjusted return differences between high- and low-rated portfolios are positive and statistically significant. In contrast, during the second subperiod risk-adjusted returns are not significantly different from zero in most cases.
Edmans (2011) points out that the abnormal returns of companies with high levels of employee satisfaction decrease over time for two reasons associated to mispricing rather
than risk. On the one hand, employee satisfaction is not an enduring characteristic, since each year one-third of companies fall off the list of best companies to work for. Hence, these companies should generate smaller outperformance. On the other hand, even for others that remain on the list for several years, the mispricing may be corrected over time as the market learns about the value of CSR practices. Edmans (2011) confirms both hypotheses by calculating the cumulative abnormal returns (CAR) and buy-and-hold returns (BHAR) of the portfolios of the best companies to work for compared to other companies.The returns from BHAR decrease over time and become close to zero after five years. In order to test the second hypothesis, the author focuses on companies which continue on the list for at least the next five years. Since the returns decrease in the fifth year, the results are consistent with the mispricing narrative. In order to test the first hypothesis, the author considers portfolio I that is rebalanced and reweighted each year, portfolio II that is not rebalanced nor reweighted each year, and portfolio III that includes only companies that dropped from the list. Since the results show that portfolio II underperforms portfolio I, and portfolio III underperforms both portfolios, the author argues that returns decrease over time because satisfaction is not an enduring characteristic.
Mollet et al. (2013) present two hypotheses that can explain the positive abnormal returns of SRI portfolios. First, there are errors-in-expectations in the market, as hypothesized by Derwall et al. (2011). In fact, regarding the corporate governance dimension, Bebchuk et
al. (2013) find evidence of abnormal returns from 1990 to 1999. However, the abnormal
returns disappeared between 2000 and 2008 as a result of increased attention by the market to corporate governance (Mollet et al., 2013). This situation is consistent with the learning hypothesis. Second, Mollet et al. (2013) state that an outperformance can stem from better than expected fundamentals of companies or from rising stock demand while the companies’ fundamental value hold on. This is consistent with the growth in SRI assets under management having led to increased stock prices.
Halbritter and Dorfleitner (2015) suggest that investors should no longer expect abnormal returns by trading a SRI portfolio. Splitting the sample into three subperiods between 1991 and 2012, the authors find that the effect of CSR in performance declines over time. While in earlier years high-rated companies significantly outperformed their lower-rated counterparts, as of 2012 this outperformance disappears.
2.3.2 RESILIENCE IN SRI PORTFOLIO PERFORMANCE IN TIMES OF CRISIS
The issue of whether SRI portfolios perform better than conventional portfolios in periods of crisis is a relevant topic in the literature. There are theoretical arguments in favour a higher performance of SRI firms in times of turmoil. As Hoepner et al. (2016) argue, companies that are highly committed to CSR practices generate reputational wealth and relational capital that can prevent decline in value during market crises. This argument is supported by Lins et al. (2017), who find that during the 2008-2009 financial crisis, firms with high levels of CSR outperform firms with low levels of CSR. According to Lins et al. (2017), CSR can be viewed as an insurance policy that protects firms in periods where there is a general crisis of confidence in the economy.
The issue of whether SRI portfolios perform differently has been addressed at the mutual fund level. For instance, in relation to actively managed SRI equity funds, Nofsinger and Varma (2014), Becchetti et al. (2015) and Leite and Cortez (2015) find that SRI funds provide additional protection during periods of market crisis.
In terms of equity portfolio studies, Carvalho and Areal (2016) find that the performance of portfolios of the best companies to work for is not different in times of crisis compared to periods of non-crisis. In particular, the top companies of the list outperform the market in expansion periods and this performance does not change in times of crisis. The authors thus conclude that a portfolio of the best companies to work for is, thereby, resilient in times of crisis.
Turning to the fixed-income area, considering that companies with high levels of CSR will be less exposed to risk and that investors pay greater attention to risk in turbulent times, one would expect that any positive effect of social screening on bond portfolio performance would occur during crisis periods (Henke, 2016). Henke (2016) analyzes the performance of SRI bond funds considering recessions and expansion periods according to the National Bureau of Economic Research (NBER) business cycles. Alternatively, the author identifies bull and bear markets as proxies for periods of non-crisis and crisis, respectively. The results show that US and Eurozone SRI bond funds present a significant outperformance compared to conventional funds during recessions and bear markets. Therefore, Henke (2016) concludes
that the outperformance of SRI bond funds is especially driven by the performance incrisis periods. During non-recession periods, only the alphas of US SRI bond funds show a significant outperformance compared to their conventional counterparts. In bull market periods, there are no statistically significant results.
Leite and Cortez (2016) evaluate bond mutual fund performance over the 2002-2014 period. The model used includes two dummy variables in the 4-factor model, which allows to separate the recession and expansion coefficients with respect to alphas and the coefficients of the risk factors. The authors find that the performance of SRI and conventional bond funds from France and Germany is negative and statistically significant in expansion periods and neutral during recessions. UK bond funds underperform both in periods of expansions and recessions. During expansions both French and German SRI bond funds significantly outperform conventional funds, while UK bond funds perform similar to their conventional peers. During recessions, only German SRI bond funds continue to outperform their peers, thus suggesting they provide some additional protection during market turmoil.
With respect to portfolio studies, Hoepner and Nillson (2017) split the fixed-income sample into January 2001 to December 2007 and January 2008 to December 2014 to distinguish between pre- and post-crisis periods. Although the results are not reported in the paper, the authors mention that the general conclusion of “no news is good news” results stems entirely from the second half of the sample period, i.e., in times of market crisis.
3. METHODOLOGY
This chapter presents the methodology used in this investigation. It starts by explaining portfolios’ construction using the calendar-time portfolio approach. It also presents the performance evaluation models that will be used, as well as the estimation process of the models.
PORTFOLIO FORMATION
This investigation uses the calendar-time portfolio method, as in Edmans (2011) and Carvalho and Areal (2016). This approach to evaluating long-term performance presents a solution to the cross-correlation problem which is associated to methods such as cumulative abnormal returns (CAR) or buy and hold abnormal returns (BHAR) (Fama, 1998). This issue is particularly important with events that occur simultaneously because there is correlation between the events (Carvalho and Areal, 2016). In this case the returns of bonds in each portfolio are measured at the same time.
Following Kempf and Ostoff (2007), we employ the positive/ESG integration and best-in-class approaches. Positive ESG Integration refers to asset managers considering ESG factors into traditional financial analysis (Eurosif, 2016). Following Hoepner and Nilsson (2017) and Kempf and Ostoff (2007), at the beginning of period t two value-weighted portfolios are formed based on the stocks’ social scores at the end of period t – 1. In order to timely reflect the changes of ESG scores that may occur throughout the year in Aseet4 ESG scores, we consider the score at the end of month t – 1. Portfolios are formed with respect to individual dimensions of CSR (environment, social and governance dimensions) as well as to an aggregate (combined) measure of CSR. For each individual dimension as well as for the aggregate measure, the high- and low-rated portfolio consist of the top (above the median score) and bottom (below the median score) of all firms with bonds in each period, respectively. The long-short portfolio corresponds to the differences in returns between a high- and low-rated portfolio, thereby representing the performance of a strategy of going
long in a high-rated portfolio and short in a low-rated portfolio. As a robustness test, we intend to test different cut-off portfolios. These portfolios are rebalanced monthly to account for any new securities issues or redemptions. The best-in-class strategy is used to avoid industry biases (Kempf and Osthoff, 2007). By following this approach, investors choose companies based on the best ESG scores in each industry (Eurosif, 2016). We first divide the companies into ten industries based on the Industry Classification Benchmark (ICB).6 The
portfolios for each industry are formed as described above for the positive screening strategy. To combine the different industry portfolios into one portfolio, we weight them according to the bond market index industry weights.
In order to compute returns, we start by calculating the discrete rate of return of each bond using the following equation:
!",$ = &",$
&",$'(− 1 (1)
where !",$ is the discrete rate of return of bond + in month ,, &",$ is the price including
interest payments7 of bond + in month ,, and &
",$'( is the price including interest payments
of bond + in month , − 1. To construct value-weighted portfolios, the following equation is used: !-,$./ = 0 12",$'( ∑4 12",$'( "5( 4 "5( !",$ (2)
6 The best-in-class approach considering the ICB industries was also implemented by Hoepner and Nilsson (2017), for example. 7Total return data is preferred to using only bond prices because it takes into account capital gains and interest payments.
where !-,$./ is the rate of return of portfolio p in month ,, 12",$'( is the market value
of bond + at the beginning of month ,, and 7",$ is the discrete rate of return of bond + in month
,. Fama and French (2008) state that some anomalies are not robust to different weighting schemes (Edmans, 2011), because small and big companies have a different influence in the value- and equal-weighted portfolio return. One of the advantages of capitalization weighting is that it considers the relative value of portfolio securities. In addition, a capitalization weighting method requires less rebalancing than other types and, therefore, investors take less transaction costs (Christopherson et al., 2009). However, some managers prefer do not assume a significant position in one company (Christopherson et al., 2009). Therefore, equal-weighted portfolios are also constructed as a robustness test:
!-,$8/ = 1
9 0 !",$
4
"5(
(3)
where !-,$8/ is the rate of return of an equally-weighted portfolio in month ,, &",$ is the
price including interest payments of bond + in month ,, &",$'( is the price including interest
payments of bond + in month , − 1, and 9 is the number of bonds in portfolio :.
UNCONDITIONAL MODELS OF PERFORMANCE EVALUATION
Jensen´s (1968) alpha measures the difference between the actual portfolio return and the expected risk-adjusted return. This measure is based on the CAPM and uses a market benchmark as the unique risk factor. Although the single factor performance was initially applied to stocks, it has also been applied to bond securities (Silva et al., 2003). The single-factor alpha is computed as:
7-,$ = ;-+ =(-7>,$+ ?-,$ (4)
where 7-,$ is the excess return of portfolio : in month ,, =(- is the systematic risk of
the portfolio, 7>,$ represents the market’s excess return in the same month and ?-,$ is the
error term, which has an expected value of zero.
As a single-factor model, only one source of systematic risk is priced in the CAPM. Considering extensive evidence that there are other risk factors that are priced, investment strategies based on those factors can easily show significant abnormal return estimates without meaning that fund managers are skillful. Given this limitation, and motivated by the development of the Arbitrage Pricing Theory (APT) by Ross (1976), that proposes a linear relationship between expected return and multiple sources of systematic risk, the mutual fund literature turned to multi-factor models of performance evaluation. Several studies, such as Fama and French (1992) and Carhart (1997) in the case of equity portfolios and Elton
et al. (1995) in the case of fixed-income portfolios, show that multi-factor models can provide
better descriptions of security returns. In the spirit of Elton et al. (1995) and Derwall and Koedijk (2009), the following multi-factor model is used:
7-,$ = ;-+ =(-@ABC$+ =D-EFGHIJ,$+ =K-L:,+AB$+ =M-NOI+,P$+ ?-,$ (5)
where 7-,$ represents the excess returns of portfolio : in month ,; @ABC$ represents
the excess returns of the bond market index, thus capturing the exposure to investment-grade bonds; EFGHIJ,$ is the return spread between a high-yield bond index and a
government bond index and it is included to capture default risk compensation; L:,+AB$ is
the return difference between a mortgage-backed securities index and a government bond index; NOI+,P$ represent the excess returns of the equity market index, and ?-,$ is the error