Universidade de Lisboa
Faculdade de Motricidade Humana
Kinematic and Electromyographic Analysis of the Overhead Squat in
Individuals Showing Excessive Medial Knee Displacement
Dissertação apresentada com vista à obtenção do grau de Mestre na especialidade de Treino de Alto Rendimento
Orientador: Professor Doutor Pedro Luís Camecelha de Pezarat Correia Júri
Presidente:
Professora Doutora Maria João de Oliveira Valamatos Vogais:
Professor Doutor Pedro Luís Camecelha de Pezarat Correia Professor Doutor Nuno do Carmo Antunes Cordeiro
Ricardo Alexandre de Sousa Dinis
III
“You’ve got to find what you love. And that is as true for your work as it is for your lovers. Your work is going to fill a large part of your life, and the only way to be truly satisfied is to do what you believe is great work. And the only way to do great work is to love what you do. If you haven’t found it yet, keep looking. Don’t settle.”
V Agradecimentos
Em primeiro lugar, quero direcionar o meu agradecimento especial à minha família que sempre me apoiou em todo o meu percurso académico, e em especial, durante o desenvolvimento da minha tese de mestrado. Graças ao vosso suporte, conciliar as exigências deste trabalho académico com a minha atividade profissional tornou-se uma tarefa mais fácil. À minha Mãe, por toda a força e ajuda que sempre me deu e por estar sempre presente. Ao meu Pai, por todo o apoio, conselhos e reflexões que me proporcionou. E à minha irmã (e grande amiga), com quem posso desabafar e que está sempre disponível para me ouvir.
Ao Professor Doutor Pedro Pezarat Correia, o meu mais sincero agradecimento por me ter orientado de forma exemplar e pela disponibilidade demonstrada ao longo deste processo de desenvolvimento da tese. É sem dúvida uma referência para mim, tanto a nível pedagógico como a nível pessoal. Queria deixar ainda uma palavra de gratidão por me ter recebido de braços abertos no Laboratório de Comportamento Motor, numa altura em que começava a dar os primeiros passos na investigação científica.
Quero deixar também o meu agradecimento ao Professor Doutor Pedro Mil-Homens pela excelente coordenação deste mestrado e pela disponibilidade demonstrada ao longo destes dois anos. A sua constante partilha de conhecimento científico e da sua aplicação prática ao nível do treino de alto rendimento contribuíram para o aperfeiçoamento das minhas competências de intervenção profissional.
Não poderia deixar de direcionar as minhas palavras de profunda gratidão aos meus colegas de laboratório e colaboradores neste estudo. Ao grande João Rocha Vaz, com quem aprendi bastante nas minhas primeiras colaborações em investigação científica. A partilha da sua experiência e toda a colaboração durante a realização deste estudo foi fundamental para tornar possível a conclusão da presente tese. E ao Luís Silva, um agradecimento especial por toda a disponibilidade demonstrada, excelente colaboração e pelo rigor que tentou sempre incutir em todos os passos da realização deste estudo. Se hoje dou por concluída esta etapa, foi também graças à sua ajuda.
Ao Professor Sandro Freitas, por ter despertado em mim o interesse pela investigação ao longo da minha licenciatura e por me ter proporcionado a minha primeira colaboração em
VI investigação científica no seu estudo sobre Flexibilidade, deixo o meu sincero agradecimento.
Agradeço também ao João Marmeleira pela sua amizade e camaradagem e pelas discussões e reflexões que tivemos, que em muito contribuíram para o meu desenvolvimento académico. Ao meu grande amigo André Malhó, pela sua amizade e por estar sempre disponível para o que for preciso. E ao meu colega Filipe Videira, por me incentivar à reflexão e à pesquisa constante.
Direciono ainda os meus agradecimentos a todas as pessoas que direta ou indiretamente contribuíram para o meu percurso até aqui, mesmo que o seu nome aqui não esteja presente.
Por fim, mas não menos importante, gostaria de deixar o meu agradecimento especial às participantes no estudo deste mestrado, que para além da disponibilidade demonstrada trouxeram a sua boa disposição. Sem a vossa colaboração a realização deste estudo não seria possível.
VII List of Acronyms
ACL – anterior cruciate ligament ADD – adductor magnus
BF – biceps femoris BMI – body mass index CNS – central nervous system CON – control
DLS – double-leg squat EMG – electromyography GM – gastrocnemius medialis GMax – gluteus maximus GMed – gluteus medius
MKD – medial knee displacement MVC – maximal voluntary contractions PFPS – Patellofemoral Pain Syndrome PL – peroneus longus Q1 – 1st quartile Q2 – 2nd quartile Q3 – 3rd quartile Q4 – 4th quartile RF – rectus femoris SOL – soleus TA – tibialis anterior TFL – tensor fasciae latae VL – vastus lateralis VM – vastus medialis
IX Abstract
Dynamic knee valgus is a multi-planar motion that has been associated with anterior cruciate ligament injuries and patellofemoral pain syndrome. Clinical assessment of dynamic knee valgus can be made by looking for the visual appearance of excessive medial knee displacement (MKD) in the double-leg squat (DLS). The purpose of this dissertation was to identify the movement patterns and neuromuscular strategies associated with MKD during the DLS. Twenty-four control subjects and eight individuals showing MKD during the DLS participated in the study. Significant differences were verified between subjects that demonstrated MKD and a control (CON) group for the eletromyographic amplitude of adductor magnus, biceps femoris, vastus lateralis and vastus medialis muscles (p < 0.05), during the descending phase of the DLS. During the ascending phase were found group differences for adductor magnus and rectus femoris muscles (p < 0.05). Results from kinematic analysis revealed higher minimum and maximum values of ankle abduction and knee internal rotation angles (p < 0.05) for the MKD group. Also, individuals showing excessive MKD had higher hip adduction/abduction excursion. Our results suggested that higher tibial internal rotation and knee internal rotation angles in the initial position of the DLS are associated with MKD. The neuromuscular strategies that contributed to MKD were higher adductor magnus activation, whereas biceps femoris, vastus lateralis and vastus medialis activated more to stabilize the knee in response to the internal rotation moment.
Keywords: dynamic knee valgus; overhead squat; medial knee displacement; kinematic analysis; electromyography; faulty movement.
XI Resumo
O movimento valgo dinâmico é um movimento multiplanar que tem vindo a ser associado com lesões dos membros inferiores, tais como lesões do ligamento cruzado anterior e síndrome da dor femoropatelar. A avaliação clínica do movimento valgo dinâmico é efetuada através da observação visual de deslocamento interno do joelho (MKD) durante os movimentos desportivos, como é o caso do agachamento a duas pernas (DLS). O objetivo da presente dissertação foi identificar os padrões de movimento e as estratégias neuromusculares associados com o MKD durante o DLS. Participaram neste estudo vinte e quatro sujeitos de controlo e oito sujeitos que demonstravam MKD durante o DLS. Verificaram-se diferenças significativas entre os participantes que demonstraram MKD e o grupo de controlo (CON) para a amplitude eletromiográfica dos músculos adductor magnus, biceps femoris, vastus lateralis e vastus medialis (p < 0.05) durante a fase descendente do DLS. Durante a fase ascendente observaram-se diferenças entre grupos para os músculos adductor magnus e rectus femoris (p < 0.05). Os resultados da análise cinemática revelaram valores angulares mínimos e máximos de abdução do tornozelo e de rotação interna do joelho superiores no grupo com MKD (p < 0.05). Além disso, os indivíduos que demonstram MKD excessivo tiveram valores mais elevados de excursão de adução/abdução da anca. Os nossos resultados sugerem que uma maior rotação interna da tíbia e uma maior rotação interna do joelho na posição inicial do DLS estão associados ao MKD. As estratégias neuromusculares que contribuíram para o MKD foram (1) uma maior ativação do adductor magnus e, (2) maior ativação do bíceps femoris, vastus lateralis e do vastus medialis durante a segunda metade da fase descendente, sugerindo que estes músculos nos sujeitos do grupo com MKD ativaram mais para estabilizar o joelho em resposta ao momento de rotação interna.
Palavras-chave: movimento valgo dinâmico; overhead squat; deslocamento interno do joelho; análise cinemática; eletromiografia; movimento disfuncional.
XIII Table of Contents
Introduction ... 1
Review of the Literature ... 3
Methods ... 9 Participants ... 9 Instrumentation ... 10 Procedures ... 11 Results ... 15 Muscle Activity ... 15
Vastus Medialis to Vastus Lateralis activation ratios ... 28
Kinematic Analysis ... 29
Discussion ... 31
Study Limitations ... 37
Conclusion ... 39
XIV Figures
Figure 1 - (A) Subject performing the overhead squat test, with the knees over his toes (CON group). (B) Subject displaying MKD during the overhead squat (MKD group). ... 10 Figure 2 – EMG amplitude (digitally filtered, full wave rectified, smoothed through a low-pass filter and normalized for the MVC) of the twelve muscles analyzed during one DLS repetition of one subject from each group (CON and MKD) ... 15 Figure 3 – Mean EMG activity of Gluteus Maximus during the overhead squat, descending (left) and ascending (right) phases. Quartiles are represented from 1 to 4 in each phase. ... 16 Figure 4 - Mean EMG activity of Gluteus Medius during the overhead squat, descending (left) and ascending (right) phases. Quartiles are represented from 1 to 4 in each phase. ... 17 Figure 5 - Mean EMG activity of Tensor Fasciae Latae during the overhead squat, descending (left) and ascending (right) phases. Quartiles are represented from 1 to 4 in each phase. ... 18 Figure 6 - Mean EMG activity of Adductor Magnus during the overhead squat, descending (left) and ascending (right) phases. Quartiles are represented from 1 to 4 in each phase. ... 19 Figure 7 - Mean EMG activity of Biceps Femoris during the overhead squat, descending (left) and ascending (right) phases. Quartiles are represented from 1 to 4 in each phase. ... 20 Figure 8 - Mean EMG activity of Rectus Femoris during the overhead squat, descending (left) and ascending (right) phases. Quartiles are represented from 1 to 4 in each phase. ... 21 Figure 9 - Mean EMG activity of Vastus Lateralis during the overhead squat, descending (left) and ascending (right) phases. Quartiles are represented from 1 to 4 in each phase. ... 22 Figure 10 - Mean EMG activity of Vastus Medialis during the overhead squat, descending (left) and ascending (right) phases. Quartiles are represented from 1 to 4 in each phase. ... 23 Figure 11 - Mean EMG activity of Peroneus Longus during the overhead squat, descending (left) and ascending (right) phases. Quartiles are represented from 1 to 4 in each phase. ... 24 Figure 12 - Mean EMG activity of Tibialis Anterior during the overhead squat, descending (left) and ascending (right) phases. Quartiles are represented from 1 to 4 in each phase. ... 25 Figure 13 - Mean EMG activity of Gastrocnemius Medialis during the overhead squat, descending (left) and ascending (right) phases. Quartiles are represented from 1 to 4 in each phase. ... 26 Figure 14 - Mean EMG activity of Soleus during the overhead squat, descending (left) and ascending (right) phases. Quartiles are represented from 1 to 4 in each phase. ... 27
Tables
Table 1 – VM to VL activation ratios ... 28 Table 2 - Minimum and maximum values of joint angles (degrees) for hip, knee and ankle joints ... 29 Table 3 - Joint excursion angles (degrees) for hip, knee and ankle joints ... 30
1 Introduction
Anterior Cruciate Ligament (ACL) injuries and Patellofemoral Pain Syndrome (PFPS) are very common in Sports (Alentorn-Geli et al., 2009; Collado & Fredericson, 2010). Noncontact mechanisms, such as decelerating, cutting, and landing from a jump account for 70% of all ACL injuries (Alentorn-Geli et al., 2009). The deficit in dynamic active neuromuscular control manifests as excessive joint loads and leads to detrimental ACL stress and ultimate failure (Kiapour & Murray, 2014). PFPS constitutes nearly 25% of the injuries to the knee (Collado & Fredericson, 2010). Investigators have suggested that dynamic neuromuscular asymmetry, such as excessive frontal plane knee mechanics accurately predict ACL injury risk and PFPS (Kiapour & Murray, 2014; Nakagawa, Moriya, Maciel, & Serrão, 2012).
During sports manoeuvres, dynamic knee valgus (which results in excessive medial knee displacement) and associated knee abduction have been found to be strong predictors of ACL injury and PFPS, especially in female athletes (Herrington, 2014; Hewett et al., 2005; Myer et al., 2010, 2015; Nakagawa et al., 2012).
Clinical assessment of dynamic knee valgus movement patterns is operationally defined as the visual appearance of excessive medial knee displacement (MKD), and can be assessed during functional tasks such as the double-leg squat (DLS) (Bell, Padua, & Clark, 2008).
Given that the double-leg squat is one of the most popular exercises performed by athletes in their strength and conditioning trainings and consists of a movement that has biomechanical and neuromuscular similarities with a lot of athletic movements and everyday tasks (Schoenfeld, 2010), investigators developed a reliable assessment tool – the Overhead Squat Test – that consists of a DLS with the arms raised overhead, and has the aim to assess for dysfunctional movement patterns (for example MKD) at the joints (Hirth, 2007).
The purpose of this dissertation was to identify the movement patterns and neuromuscular strategies associated with MKD during the DLS with the arms raised overhead. We hypothesized that individuals showing excessive MKD would demonstrate different muscle activation pattern comparing to the control group and that also would demonstrate
2 higher excursion values of hip internal rotation, hip adduction, knee internal rotation and knee abduction.
3 Review of the Literature
Dynamic knee valgus, referred as the combination of femoral adduction and internal rotation with tibial abduction and internal rotation (Padua, Bell, & Clark, 2012), results in medial knee displacement (frontal plane movement) and is one of the most prevalent mechanisms for ACL injury (Alentorn-Geli et al., 2009; Quatman et al., 2014). Some studies have revealed that during an high-risk landing scenario, the mechanism of injury of the ACL usually accounts for multi-planar knee kinematics, such as multi-planar knee valgus collapse (Kiapour et al., 2014; Quatman et al., 2014). Kiapour et al. (2014) have shown that the mechanism of injury that contributed to ACL strain was a combination of knee abduction, anterior tibial translation and ultimately a small contribution of tibial internal rotation, in the latter phases of the movement. Additionally, Quatman et al. (2014) also identified that ACL strain was significantly higher when suffered a combined multi-planar loading, compared with anterior tibial shear force, knee abduction and internal tibial rotation moments alone.
Hamstrings activation during dynamic activities acts synergistically with the ACL to prevent anterior displacement of the tibia and consequent excessive load on ACL, while Quadriceps group acts contrarily as it increases anterior tibial shear forces and ACL loading (Alentorn-Geli et al., 2009; Begalle, Distefano, Blackburn, & Padua, 2012; Li et al., 1999). Based on these findings, some authors have been investigating the Quadriceps and Hamstrings coactivation during dynamic functional tasks in order to predict individuals ACL injury risk (Alentorn-Geli et al., 2009; Begalle et al., 2012). It was demonstrated that higher Hamstrings activation relative to Quadriceps activation significantly reduces ACL loading and shear forces, reducing ACL injury risk (Li et al., 1999).
Patellofemoral Pain Syndrome (PFPS) is a term that refers to anterior knee pain (retropatellar and peripatellar pain) that can result from a variety of pathologies or anatomical abnormalities, as malalignment and muscular dysfunction, and is also a very common condition in Sports (Waryasz & McDermott, 2008). It has been reported that the incidence of PFPS in females is 2.2 times greater than in males (Boling et al., 2010). One factor that has been suggested to contribute to PFPS is Vastus Medialis weakness relative to Vastus Lateralis (Pattyn et al., 2011; Waryasz & McDermott, 2008), resulting in an inability to Vastus Medialis adequately support medial patellar stability, leading to lateral
4 displacement of the patella and causing the articulating pressure to be on the lateral facet of the patella with the lateral trochlea (Waryasz & McDermott, 2008).
It has been reported that females demonstrate higher incidence of ACL injuries (Ireland, 1999; Prodromos et al., 2007) and that would be explained by anatomical, hormonal and neuromuscular factors (Hewett, 2000). Concerning the neuromuscular factors, some authors verified that females displayed higher peak hip adduction angles, greater peak knee abduction angles and higher hip adduction and knee abduction torques, compared with their male counterparts, during sports manoeuvres such as landing, cutting, and squatting (Carson & Ford, 2011; Mendiguchia et al., 2011; Zeller, et al., 2003). Zeller et al. (2003) also verified a significant greater ankle pronation compared with males, during the single-legged squat. Additionally, some investigators have been shown that females with PFPS demonstrate greater degrees of knee valgus and knee abduction during sports tasks, such as single leg squat and single leg landing (Herrington, 2014; Myer et al., 2010; Nakagawa et al., 2012).
Throughout athletes’ strength and conditioning programs, one of the most popular exercises performed is the DLS. It has biomechanical and neuromuscular similarities to a wide range of athletic movements, and has close specificity to many everyday tasks, such as lifting supermarket packages or picking up children (Schoenfeld, 2010). The double-leg squat is an exercise performed with the aim of enhance hip, thigh, and back strength, and consists of squatting down from an upright position by flexing at the hip, knee and ankle joints. When the desired depth is achieved, the athlete ascends back to the upright position, by extending at the hip, knee and ankle joints (Escamilla, Fleisig, Lowry, Barrentine, & Andrews, 2001; Kritz, Cronin, & Hume, 2009; Schoenfeld, 2010).
Dionisio, Almeida, Duarte, & Hirata (2008) made a kinetic, kinematic and muscle activation pattern analysis of the squat’s eccentric phase and showed that the central nervous system (CNS) applied different strategies during the descending phase of the squat task. The authors described 5 phases: upright position, pre-squatting phase,
acceleration phase, deceleration phase and target position. During the initial upright
position they verified that the ankle joint torque was towards plantar flexion, due to a small muscle activation of the gastrocnemius lateralis, avoiding initial disruption of the postural equilibrium. In respect to the knee joint, was seen a small and similar EMG activities of the posterior and anterior muscles of the thigh showing a pattern of
co-5 activation, enough to keep the knee joint torque stable. Regarding the pre-squatting phase, they showed that the CNS triggers a response in order to disrupt the equilibrium and initiate the squat movement. This response was shown to be an activation of the tibialis anterior, without any other participation of the muscles acting on the knee. In the acceleration phase was verified very little activation of the quadriceps muscle group resulting in an accelerating movement of the body due to the gravitational force. At the ankle subjects showed a co-contraction pattern between tibialis anterior and gastrocnemius muscle groups, although the tibialis anterior activity was predominant. After the acceleration phase initiates a deceleration phase in which they observed a strong activation of the quadriceps muscle that, acting eccentrically, decelerates the body. The vastus medialis oblique (VMO) activity was 30% larger than the vastus lateralis (VL) activity, which in turn was 40% larger than rectus femoris. Dionisio et al. (2008) also showed a significant activation of the semitendinosus and biceps femoris muscles, probably aiming to stabilize the pelvis, avoiding excessive hip flexion, and stabilize the knee. Finally, in the last phase of the descending squat, was demonstrated a co-activation pattern in the ankle joint and a small activation of the quadriceps muscle group, and a small knee joint torque as well. Their data demonstrates that the downward squat requires a higher VMO activation relative to VL activation, although it is not known if individuals showing MKD have the same neuromuscular strategies.
The VMO to VL activation ratio has been studied in subjects with PFPS in order to identify if this syndrome are associated with a dysfunctional neuromuscular activation pattern (Boling et al., 2006; Miller et al., 1997; Sheehy et al., 1998; Tang et al., 2001), since it has been associated with Vastus Medialis weakness (Pattyn et al., 2011; Waryasz & McDermott, 2008). Tang et al. (2001) observed that participants with PFPS displayed lower VMO:VL activation ratios during isokinetic open kinetic chain eccentric and concentric contractions, using a isokinetic dynamometer. However, when executing a stand-to-squat and a squat-to-stand tasks, they did not found significant differences between PFPS and control subjects for VMO:VL activation ratios. Other authors have investigated VMO:VL ratios during closed kinetic chain activities in individuals with PFPS. Sheehy et al. (1998) also found no significant differences between PFPS subjects and a control group when ascending and descending steps. On the other hand, Miller et al. (1997) verified significant differences between groups, for the same task. In terms of EMG timing parameters, Boling et al. (2006) observed that during a stepping task, VL
6 and VMO onset timing difference were significantly lower for PFPS subjects, as VL activated earlier than VMO, which is stated by the literature as a risk factor for PFPS. On the contrary, the same authors verified that control subjects activated the VMO before the VL muscle. Nakagawa et al. (2012) also observed that subjects with PFPS displayed more MKD (displaying more hip adduction and knee abduction) during the single leg squat, compared with subjects without PFPS. Based on these findings, it would be interesting to see if subjects that demonstrate MKD during the DLS (a closed kinetic chain task) have lower VMO:VL activation ratios and onset timing differences when executing the task. The double-leg squat can be performed without external load (bodyweight squat), but also with external loads as we see in training and rehabilitation. The most common methods employed with external loading are the barbell squat and the machine squat (Escamilla, 2001). The barbell squat is performed with the barbell across the back (back squat) slightly above (high bar squat) or below (low bar squat) the level of the acromion or even with the barbell held in front of the chest approximately at the level of the clavicles (front squat). The back squat is most used and usually performed by athletes in sport, although the front squat is commonly performed by bodybuilders and Olympic weightlifters (Escamilla, 2001). As it is a strength training exercise performed worldwide, most of the times with external loads associated, it is important to screen the double-leg squat movement pattern, in order to achieve optimal movement without pain or discomfort and with proper joint alignment. Otherwise, we will increase joint loading and eventually lead to injury (Kritz et al., 2009).
The Overhead Squat Test is a reliable tool (kappa coefficient between .75 and 1.0) that can be used to qualitatively assess an individual’s overall movement pattern, and involves a DLS with the arms raised overhead, while the clinician looks for dysfunctional movement pattern at the joints (Hirth, 2007). The observation is made from three views: anterior, lateral and posterior. The subject is instructed to squat down as if sitting in a chair, and has to perform 5 squats for the anterior view, 5 squats for the lateral view and 5 squats for the posterior view. When assessing the MKD, clinicians should verify if the patient show inward movement of the patella over the first metatarsophalangeal joint (in the frontal plane), during the anterior view. In this view, clinicians should also verify if the subject’s feet turn outwardly. During the lateral view, clinicians should focus on lumbo-pelvic hip complex and upper body positions. Common compensations are excessive forward trunk leaning and arms falling forward. Regarding the posterior view
7 we should observe the positions of the feet and the lumbo-pelvic hip complex as the calcaneus should stay parallel with the lower leg and the hip should not have an asymmetric shift. Common compensation in the ankle joint is pronation of the feet and eversion of the calcaneus.
Investigation regarding MKD during the double-leg squat has been growing in the last few years. Some studies suggested that individuals showing MKD during the double-leg squat and that correct it when they perform the task with the heels elevated by a 5.1-cm heel lift, may have lower leg muscle imbalances, while there is no evidence on the individuals that cannot correct the movement pattern when performing the squat with the heels elevated (Bell et al., 2008; Bell, Vesci, & DiStefano, 2012; Padua et al., 2012). Bell et al. (2012) found that individuals showing MKD had less ankle dorsiflexion range of motion (ROM) with the knee straight, indicating gastrocnemius tightness, and evidenced increased hip adductor activation levels compared with subjects that did not display MKD. The authors theorized that increased frontal plane motion might be a compensatory mechanism for reduced sagittal plane motion, due to gastrocnemius tightness which may pull the calcaneus into eversion and feet in pronation, which in turn would encourage tibial internal rotation and consequently increase MKD. In the same study no differences were found for hip strength (external rotation, internal rotation, extension and abduction) between subjects displaying MKD and those who did not show that movement pattern, indicating that hip strength may not be an issue, but rather neuromuscular control may be an important factor in controlling knee position during the squat.
Padua et al. (2012) developed a theoretical model based on electromyographic muscle activity data. They theorize that increased tibialis anterior and gastrocnemius activation increase ankle joint stiffness that would limit ankle dorsiflexion and result in compensatory foot pronation and tibial internal rotation, facilitating MKD. Additionally, increased hip adductor activity was not offset by concomitant increases in gluteus medius and maximus activity, which may allow a net internal hip-adduction moment to pull the hip into a more adducted position, contributing to MKD during the squatting task. Dill et al. (2014) observed that subjects with limited dorsiflexion, evaluated by a weight-bearing-lunge test, showed decreased knee flexion, decreased ankle dorsiflexion and greater knee-valgus displacement during the DLS, compared with subjects who did not demonstrate limited dorsiflexion. However, as Padua et al. (2012), they did not evaluate
8 frontal plane foot kinematics and ankle joint kinetics, in order to support the hypothesis that limited ankle dorsiflexion in addition with increased ankle joint stiffness would result in a compensatory movement pattern of foot pronation and tibial internal rotation, facilitating MKD.
Bell et al. (2013) conducted an exercise intervention in young adults demonstrating dynamic valgus during the double-leg squat. The authors developed an intervention program with a comprehensive approach that focused on joints proximal and distal to the knee, with 5 exercises for hip musculature and 5 directed to ankle musculature. They used a specific sequence via corrective exercise strategy that included (1) inhibiting overactive muscles, (2) lengthening tight muscles, (3) strengthening weak muscles, and (4) performing an integrative exercise with proper form and technique, including keep the knees over the toes during these tasks. The results of their systematic corrective exercise program was that individuals successfully reduced MKD and 3D knee valgus during the double-leg squat and increased their ankle-dorsiflexion ROM with the knee extended. These findings suggest that clinicians and athletic trainers should assess clients’ and athletes’ movement pattern during the DLS and identify those who demonstrate MKD, in order to tailor the training program, aiming to decrease MKD and knee valgus during the squat movement, since it has been suggested that those patterns are associated with ACL injury (Alentorn-Geli et al., 2009; Quatman et al., 2014) and PFPS (Herrington, 2014; Myer et al., 2010; Nakagawa et al., 2012).
9 Methods
Participants
A total of thirty-two female participants who were recreationally active, which was defined as 60 minutes of physical activity at least 3 days per week, participated in this study. All subjects had to be healthy and free from lower extremity injuries within 6 months prior the time of testing and without history of ACL injury. Participants were aged between 18 and 28 years old (20.75 ± 2.16 years). We chose this range of age in order to reduce variability from age differences and to investigate a group age that characterizes the majority of the athletes. Regarding body composition, subjects had a body mass of 57.84 ± 6.34 kg; height of 1.62 ± 0.07 m; and had a body mass index (BMI)
of 21.9 ± 1.8 kg/m2.
We decided to only evaluate females due to the higher incidence of ACL injuries and PFPS demonstrated by female athletes (M. Boling et al., 2010; Ireland, 1999; Prodromos et al., 2007) and due to biomechanical differences between genders, as females display movement patterns and neuromuscular strategies that facilitates MKD during sports manoeuvres such as landing, cutting, and squatting (Carson & Ford, 2011; Herrington, 2014; Mendiguchia et al., 2011; Nakagawa et al., 2012; Zeller et al., 2003), which may contribute to higher incidence of ACL injuries and PFPS.
The recruitment of participants for the study took place in the Faculdade de Motricidade Humana. We addressed the students and explained the purpose of the study, all the risks associated and procedures necessary for their participation. After that they read the informed consent so that they could be aware of every detail that involved their participation. Then, if they decided to participate in the study, we asked them to execute five repetitions of the overhead squat test (with and without heels elevated by a 5.1-cm heel lift) to see if the subjects met criteria for experimental group or control group (criteria is explained further in this document). Afterwards if the subjects were eligible to participate in the study we contacted them via email to schedule their participation. Subjects were assigned to either the MKD or control (CON) group based on their performance in the overhead squat test, which was evaluated by analyzing frontal plane video, after data collection. Participants whose knees stay over their toes (Figure 1A) were placed in the CON group (n = 24; age = 21.13 ± 2.25 years; weight = 57.42 ± 5.44
10
kg; height = 1.63 ± 0.07 m; BMI = 21.69 ± 1.81 kg/m2) ,while participants who display
MKD (ie, inward movement of the patella over the first metatarsophalangeal joint) during the overhead squat test were placed in the MKD group (n = 8; age = 19.63 ± 1,41 years;
body mass = 59.11 ± 8.84 kg; height = 1.61 ± 0.08 m; BMI = 22.61 ± 1.84 kg/m2) (see
Figures 1A and 1B).
All procedures were approved by the Ethics Committee of the Faculdade de Motricidade Humana, Universidade de Lisboa.
Instrumentation
The EMG signals were collected using active surface electrodes (Al/AgCl, disk shape 10 mm of diameter), AMBU® BlueSensor N (shape 30 x 22 AMBU, Ballerup, Denmark) and bioPLUX® research 2010 (PLUX, Lisbon, Portugal) telemetric equipment. Kinematic data were collected with a six high-speed video cameras (SIMI Motion, Munich, Germany) operating at 100 Hz.
EMG activity from Gluteus Maximus (GMax), Gluteus Medius (GMed), Tensor Fasciae Latae (TFL), Adductor Magnus (ADD), Vastus Medialis (VM), Vastus Lateralis (VL), Biceps Femoris (BF), Rectus Femoris (RF), Peroneus Longus (PL), Gastrocnemius Medialis (GM), Soleus (SOL) and Tibialis Anterior (TA) were recorded in the dominant
Figure 1 - (A) Subject performing the overhead squat test, with the knees over his toes (CON group). (B) Subject displaying MKD during the overhead squat (MKD group).
11 leg (which was defined as the leg that steps forward when someone is suddenly pushed from the back). Electrodes were placed aligned with muscle fibers orientation with a center-to-center distance of 20 mm, over the more prominent surface of each muscle bellies based on the references described in SENIAM Project (Hermens et al., 1999). Also, muscle contraction was requested to the subjects in order to facilitate the identification of muscle bellies. The ground electrode was placed over the lateral malleolus. In order to decrease the impedance of the interface between skin and electrode, hair removal, skin abrasion and alcohol cleaning were necessary. For kinematic analysis, reflective markers were placed bilaterally in anterior superior iliac spine, great trochanter, lateral aspect of the thigh, medial and lateral femoral condyles, shank, medial malleolus,
lateral malleolus, heel, proximal head of the 2nd metatarsal, big toe and in the mid-point
between left and right posterior superior iliac spines. Procedures
Participants arrived at the research laboratory for a single testing session wearing athletic shorts and shirt. Prior to testing, individuals had to complete an informed consent. Subsequently, researchers had to place the EMG sensors before the participants performed three separate 5-second maximal voluntary contractions (MVC) of the twelve muscles, in order to normalize muscle activation data recorded during the DLS. Then the reflective markers were placed on the anatomical references mentioned early.
MVCs were conducted using manual muscle testing based on the references presented by Kendall (2005). For GMax and BF subjects were asked to lie on a gurney in dorsal decubitus, for GMed and TFL were asked to lie in lateral decubitus, for Quadriceps (VM, VL, RF), ADD, TA, PL and SOL were asked to sit on the gurney, and for GM subjects were asked to be upstanding. The manual muscle testing was done by asking the participants to try to produce a movement with their maximal strength, while the researcher was resisting it, producing a contrary force. For GMax, subjects had to produce a hip extension while one researcher stabilized their hip. The BF test was conducted by asking the participants to produce a knee flexion, while the resistance was offered at 90º of knee flexion. For the GMed they was asked to abduct their hip and for TFL a combination of hip abduction and hip flexion were asked. The other movements asked were knee extension for Quadriceps muscle group, hip adduction (with knee flexed at 90º and feet touching the ground) for ADD, a combination of ankle dorsiflexion and inversion
12 for TA, a combination of ankle plantarflexion and eversion for PL and ankle plantarflexion for both SOL and GM.
The data were collected as participants performed 10 overhead squat repetitions, while positioned with their feet shoulder-width apart, toes pointing straight ahead, and arms extended over the head. All testing were performed in bare feet. Subjects were instructed to squat as if they were sitting in a chair. In order to ensure data reliability, squat speed was controlled using a metronome set as 80 beats per minute (2 beats to descend, 2 beats to ascend and 1 beat of pause between squats) and squat depth by placing a tripod that provided tactile feedback when the individual was reaching 80º of knee flexion. Before testing, participants had to perform at least 5 consecutive practice trials of squatting at the appropriate depth and cadence, until they got it right.
All EMG data were sampled at 1000 Hz, digitally filtered (10-500 Hz), full wave rectified, smoothed through a low-pass filter (12 Hz, fourth-order Butterworth digital filter), and amplitude normalized by using the maximum value of the three MVCs trials. This maximum EMG value was obtained considering the mean value of a 100 ms window each side of the maximum value. The average value of EMG signal was calculated during each phase (descending and ascending) for each repetition and subject. Phases were divided by the instant of maximum knee flexion. Subsequently, mean values of the last 8 repetitions were obtained for each phase. We removed from analysis the first two repetitions because individuals could have been adapting to appropriate depth and cadence during these repetitions. Additionally, we divided each phase into quartiles (Q1, Q2, Q3 and Q4) and calculated the average EMG of each quartile, in order to have more information on the distribution of the activation during the descending and ascending phases, and if they differ between groups. EMG processing was performed using a routine by MATLAB® software (The Mathworks Inc., Natick Massachusetts, USA). For calculating kinematic variables the SIMI software was used (SIMI Motion, Munich, Germany).
The kinematic variables we extracted for analysis were minimum and maximum values of the following joint angles: hip flexion/extension, hip adduction/abduction, hip internal/external rotation, knee flexion/extension, knee abduction/adduction, knee internal/external rotation, ankle dorsiflexion/plantarflexion, ankle pronation/supination and ankle abduction/adduction, and joint excursion of the movements described before.
13 Joint excursion was calculated by subtracting the joint angle of the final of descending phase by the joint angle value of the initial of the descending phase. Regarding minimum and maximum joint angles values, for the hip joint, flexion, adduction and internal rotation are positive, whereas extension, abduction and external rotation are negative. For the knee joint, flexion, abduction and internal rotation are positive. Finally, for the ankle, dorsiflexion, pronation and abduction are positive.
A mixed-model ANOVA was performed to analyze if there were differences between phases (repeated measures), differences between groups (fixed factor), and to verify if there were any interaction between groups and phases of muscle activation. When equality of variances or normality was not assumed, we performed a square root transformation. Differences between each pair of phases (quartiles) were assessed using the Bonferroni pairwise comparisons.
Independent samples t-Test were performed in order to identify differences in kinematic data (dependent variables) between groups (independent variables) during ascending and descending phases. When equality of variances was not assumed, Welch-Satterthwaite
T-Test was used. Inference statistical analysis was performed using IBM SPSS Statistics
version 22 (IBM Corporation, NY, USA).
For the VM:VL activation ratio data, the following formula were used: average VM activation / average VL activation. Besides the calculation of the VM:VL ratios for the total of the descending and the ascending phases, VM:VL ratios for each quartile were also obtained. Comparisons between groups for the VM:VL activation ratios were performed using Independent samples t-Test.
15 Results
Muscle Activity
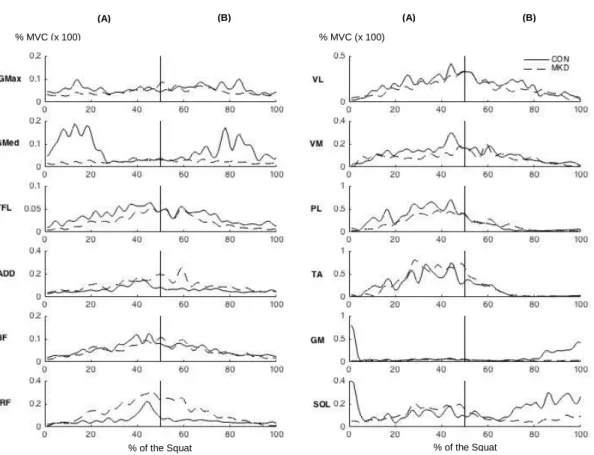
EMG data was collected as described in the methods and sampled at 1000 Hz, digitally filtered (10-500 Hz), full wave rectified and smoothed through a low-pass filter (12 Hz, fourth-order Butterworth digital filter), before normalizing the amplitude to the MVC. Each phase of the DLS was divided into quartiles (Q1, Q2, Q3 and Q4). In Figure 2 we can see an example of one repetition from one CON group subject and one individual showing MKD, where is represented the muscle activity of the twelve muscles analyzed. Subsequently the average EMG of each quartile was calculated.
Figure 2 – EMG amplitude (digitally filtered, full wave rectified, smoothed through a low-pass filter and normalized for the MVC) of the twelve muscles analyzed during one DLS repetition of one subject from each group (CON and MKD). Graphs are divided into descending (A) and ascending (B) phases of the DLS.
% MVC (x 100) % MVC (x 100)
% of the Squat % of the Squat
16 Statistical analysis of GMax activity (Figure 3) during the descending and ascending
phases revealed no main effects involving group (F1,30 = 0.201, p = 0.657, 𝜂𝑝2 = 0.007, π
= 0.072, and F1,30 = 0.149, p = 0.703, 𝜂𝑝2 = 0.005, π = 0.066, respectively), showing that
no differences were observed in GMax activity between groups (CON and MKD). Additionally, no interactions were found involving phase and group for GMax activity for both descending and ascending phases (p = 0.074, and p = 0.259).
Analyzing the differences between quartiles, we can observe that, during the descending phase, there were significant differences between Q1 and Q4 (p = 0.005), and between Q2 and Q4 (p = 0.042) for CON group, as no differences were found for MKD group. During the ascending phase, significant differences were observed between Q3 and Q4 (CON: p = 0.001; MKD: p = 0.027) for both groups, while for CON group were also found significant differences between Q1 and Q4 (p = 0.003) and between Q2 and Q4 (p = 0.001).
Figure 3 – Mean EMG activity of Gluteus Maximus during the overhead squat, descending (left) and ascending (right) phases. Quartiles are represented from 1 to 4 in each phase.
0 1 2 3 4 5 6 7 0 1 2 3 4 5 6 7 1 2 3 4 1 2 3 4 EMG a ctiv ity (% M VC ) EMG a ctiv ity (% MVC ) Phases (Descending/Ascending)
Gluteus Maximus
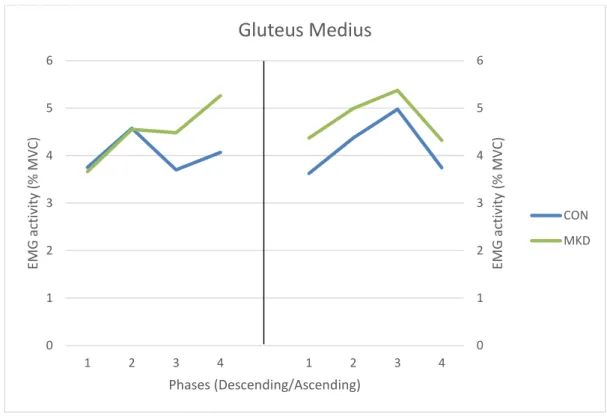
CON MKD17 No main effects involving group were found for GMed (Figure 4) during the descending
phase (F1,30 = 0.300, p = 0.588, 𝜂𝑝2 = 0.010, π = 0.083) and the ascending phase (F1,30 =
0.498, p = 0.486, 𝜂𝑝2 = 0.016, π = 0.105). Additionally, no significant phase x group
interactions were observed for GMed activity during both phases (p = 0.281 for descending phase and p = 0.880 for ascending).
Statistically significant differences between quartiles were found, during the descending phase, for CON group between Q2 and Q3 (p = 0.022). No significant differences were found between all quartiles for MKD, during this phase. In respect to the ascending phase, differences were found only for CON group, between Q1 and Q3 (p = 0.024), and between Q3 and Q4 (p = 0.001).
Figure 4 - Mean EMG activity of Gluteus Medius during the overhead squat, descending (left) and ascending (right) phases. Quartiles are represented from 1 to 4 in each phase.
0 1 2 3 4 5 6 0 1 2 3 4 5 6 1 2 3 4 1 2 3 4 EMG a ctiv ity (% M VC ) EMG a ctiv ity (% MVC ) Phases (Descending/Ascending)
Gluteus Medius
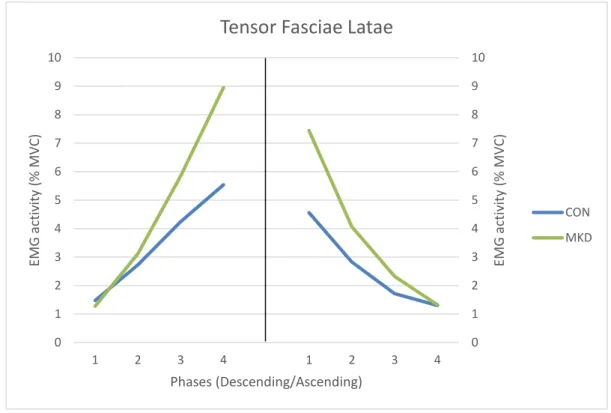
CON MKD18 TFL muscle group (Figure 5), during the descending phase, did not show significant
differences between groups (F1,30 = 0.960, p = 0.335, 𝜂𝑝2 = 0.031, π = 0.158), however
significant phase x group interactions were found (p = 0.038). During the ascending
phase, the TFL activity did not demonstrate a significant effect involving group (F1,30 =
1.574, p = 0.219, 𝜂𝑝2 = 0.050, π = 0.229) and no phase x group interactions were found (p
= 0.072).
In the descending phase, the TFL muscle activity were different between all quartiles for both groups, except between Q3 and Q4 (p = 0.060) for MKD group. During the ascending phase the EMG activity of the four quartiles were different between each other for both CON and MKD groups (p < 0.05).
Figure 5 - Mean EMG activity of Tensor Fasciae Latae during the overhead squat, descending (left) and ascending (right) phases. Quartiles are represented from 1 to 4 in each phase.
0 1 2 3 4 5 6 7 8 9 10 0 1 2 3 4 5 6 7 8 9 10 1 2 3 4 1 2 3 4 EMG a ctiv ity (% M VC ) EMG a ctiv ity (% MVC ) Phases (Descending/Ascending)
Tensor Fasciae Latae
CON MKD
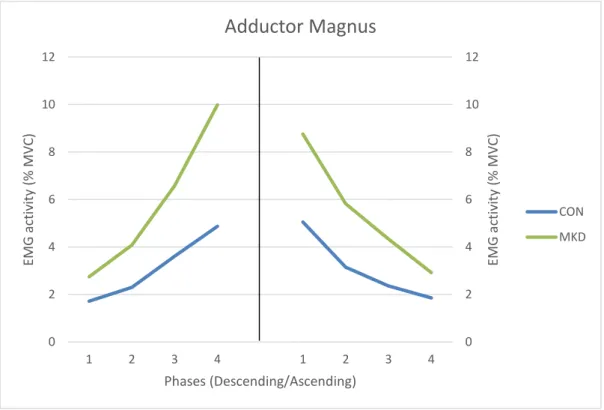
19 Regarding the ADD muscle group (Figure 6), the results showed a main effect for group
differences (F1,30 = 7.686, p = 0.009, 𝜂𝑝2 = 0.204, π = 0.765), as well as a significant
interaction involving phase and group for muscle activity (p = 0.006), during the descending phase. Those differences are more noticeable in the last two quartiles, in which the subjects from the MKD group evidenced greater increase rate of ADD activity relative to CON group, which also increased ADD activity, though with a lower rate.
During the ascending phase, was also verified a main effect involving group (F1,30 =
5.189, p = 0.030, 𝜂𝑝2 = 0.147, π = 0.597), but no phase x group interactions were found (p
= 0.173).
For the descending phase, results from pairwise comparisons revealed significant ADD muscle activity differences between all quartiles for both CON and MKD groups (p < 0.05). During the ascending phase, the ADD muscle activity was different between all quartiles for both groups, except between Q3 and Q4 (p = 0.110) for MKD group.
Figure 6 - Mean EMG activity of Adductor Magnus during the overhead squat, descending (left) and ascending (right) phases. Quartiles are represented from 1 to 4 in each phase.
0 2 4 6 8 10 12 0 2 4 6 8 10 12 1 2 3 4 1 2 3 4 EMG a ctiv ity (% M VC ) EMG a ctiv ity (% MVC ) Phases (Descending/Ascending)
Adductor Magnus
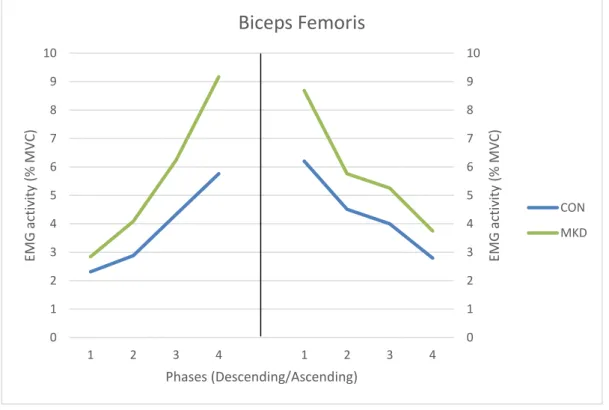
CON MKD20 For BF activity (Figure 7) was shown a main effect involving group, for descending phase
(F1,30 = 6.922, p = 0.013, 𝜂𝑝2 = 0.193, π = 0.720), while no group differences were found
for the ascending phase (F1,30 = 2.725, p = 0.110, 𝜂𝑝2 = 0.089, π = 0.357). The MKD group
had higher EMG amplitudes than CON group, in the descending phase, which were more pronounced in the last two quartiles. During the descending phase, interactions involving phase and group were evidenced for BF activation (p = 0.048), whereas no interactions were found for the ascending phase (p = 0.598).
Regarding the differences between quartiles, during the descending phase we observed significant differences between all quartiles for both groups (p < 0.05). During the ascending phase, CON group EMG activity demonstrated significant differences between all quartiles, except between Q2 and Q3 (p = 0.221), whereas EMG activity of MKD group demonstrated significant differences between Q1 and Q2 (p = 0.007), between Q1 and Q4 (p = 0.045) and between Q3 and Q4 (p = 0.017).
Figure 7 - Mean EMG activity of Biceps Femoris during the overhead squat, descending (left) and ascending (right) phases. Quartiles are represented from 1 to 4 in each phase.
0 1 2 3 4 5 6 7 8 9 10 0 1 2 3 4 5 6 7 8 9 10 1 2 3 4 1 2 3 4 EMG a ctiv ity (% M VC ) EMG a ctiv ity (% MVC ) Phases (Descending/Ascending)
Biceps Femoris
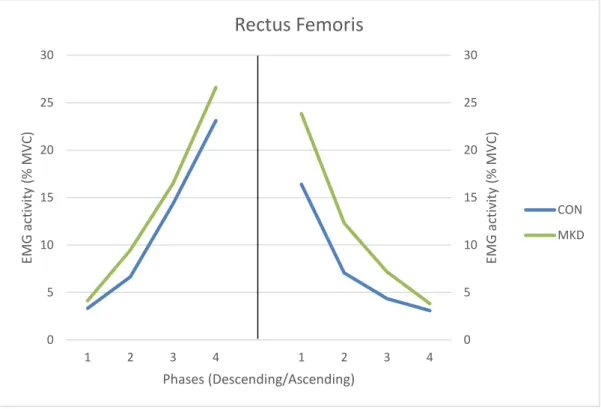
CON MKD21 In respect to RF muscle (Figure 8), during the descending phase no significant group
differences were found for muscle activation (F1,30 = 1.005, p = 0.324, 𝜂𝑝2 = 0.032, π =
0.163), as no significant interactions were found involving phase and group variables during this phase (p = 0.741). During the ascending phase, it was found a main effect
involving group (F1,30 = 4.918, p = 0.034, 𝜂𝑝2 = 0.141, π = 0.574), while no significant
phase x group interaction were found (p = 0.176) for RF activation. When observing the graph from Figure 8 we are able to identify that group differences manifests mainly in the first two quartiles, where MKD group demonstrated higher EMG amplitudes.
Regarding the differences between quartiles, we found significant differences for both groups between all quartiles, during the descending phase (p < 0.05). In the ascending phase, the four quartiles were significantly different between each other in terms of muscle activation, except between Q3 and Q4 (p = 0.074), for MKD group.
Figure 8 - Mean EMG activity of Rectus Femoris during the overhead squat, descending (left) and ascending (right) phases. Quartiles are represented from 1 to 4 in each phase.
0 5 10 15 20 25 30 0 5 10 15 20 25 30 1 2 3 4 1 2 3 4 EMG a ctiv ity (% M VC ) EMG a ctiv ity (% MVC ) Phases (Descending/Ascending)
Rectus Femoris
CON MKD22 The EMG activity of VL (Figure 9) demonstrated a significant interaction involving phase and group in the descending phase (p = 0.030), while no interaction was verified for the ascending phase (p = 0.311). However, during the descending phase were found
significant group differences for VL activation (F1,30 = 5.553, p = 0.025, 𝜂𝑝2 = 0.161, π =
0.625), as MKD group displayed higher EMG amplitudes, which were more consistent in the last two quartiles (Q3 and Q4). During the ascending phase, no main effect
involving group were found (F1,30 = 4.105, p = 0.052, 𝜂𝑝2 = 0.124, π = 0.500).
In regard to the differences between quartiles, during the descending phase and the ascending phase, we observed significant differences between all quartiles (p < 0.05), for both groups.
Figure 9 - Mean EMG activity of Vastus Lateralis during the overhead squat, descending (left) and ascending (right) phases. Quartiles are represented from 1 to 4 in each phase.
0 5 10 15 20 25 30 35 40 45 50 0 5 10 15 20 25 30 35 40 45 50 1 2 3 4 1 2 3 4 EMG a ctiv ity (% M VC ) EMG a ctiv ity (% MVC ) Phases (Descending/Ascending)
Vastus Lateralis
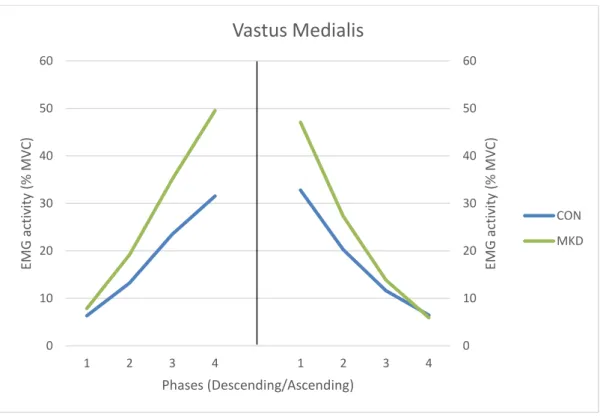
CON MKD23 Regarding the VM muscle (Figure 10), during the descending phase, a main effect
involving group was found for EMG activity (F1,30 = 6.093, p = 0.019, 𝜂𝑝2 = 0.169, π =
0.666), as it appears to be more consistent for the last two quartiles (Q3 and Q4), showing a higher EMG activity for the MKD group, comparing to CON group. During this phase (descending phase) a significant phase x group interaction were demonstrated (p = 0.037) for VM muscle activation. In the ascending phase, no significant group differences were
evidenced for muscle activation (F1,30 = 1.903, p = 0.178, 𝜂𝑝2 = 0.060, π = 0.267) and no
main interactions were found involving phase and group for VM activation (p = 0.072). Additionally, we found that for both phases (descending and ascending phases), VM activation in all the four quartiles were significantly different between each other (p < 0.05).
Figure 10 - Mean EMG activity of Vastus Medialis during the overhead squat, descending (left) and ascending (right) phases. Quartiles are represented from 1 to 4 in each phase.
0 10 20 30 40 50 60 0 10 20 30 40 50 60 1 2 3 4 1 2 3 4 EMG a ctiv ity (% M VC ) EMG a ctiv ity (% MVC ) Phases (Descending/Ascending)
Vastus Medialis
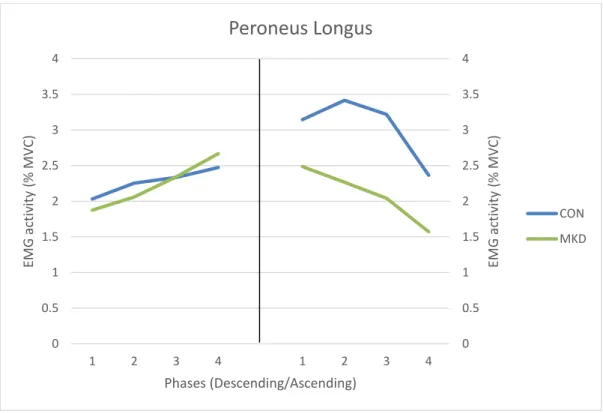
CON MKD24 For PL muscle group (Figure 11), no main effect involving group was found for both
descending (F1,30 = 0.006, p = 0.937, 𝜂𝑝2 = 0.001, π = 0.051) and ascending (F1,30 = 2.848,
p = 0.103, 𝜂𝑝2 = 0.092, π = 0.371) phases. Thus, statistical analysis revealed no significant differences for PL activation between groups. In respect to phase x group interactions, no main effects were found for EMG amplitudes of PL in both phases (descending phase: p = 0.452; ascending phase: p = 0.409).
Regarding the differences between quartiles, during the descending phase, we found a main effect for muscle activation between Q1 and Q4 for CON group (p = 0.031), whereas for MKD no differences between quartiles were observed. In respect to the ascending phase, were only found differences in the CON group, between Q1 and Q4 (p = 0.033), between Q2 and Q4 (p = 0.001) and between Q3 and Q4 (p = 0.001).
Figure 11 - Mean EMG activity of Peroneus Longus during the overhead squat, descending (left) and ascending (right) phases. Quartiles are represented from 1 to 4 in each phase.
0 0.5 1 1.5 2 2.5 3 3.5 4 0 0.5 1 1.5 2 2.5 3 3.5 4 1 2 3 4 1 2 3 4 EMG a ctiv ity (% M VC ) EMG a ctiv ity (% MVC ) Phases (Descending/Ascending)
Peroneus Longus
CON MKD25 The analysis of TA (Figure 12) revealed no main differences involving group (descending
phase: F1,30 = 0.532, p = 0.471, 𝜂𝑝2 = 0.017, π = 0.109; ascending phase: F1,30 = 0.379, p
= 0.543, 𝜂𝑝2 = 0.012, π = 0.092) as well as no significant phase x group interactions for
both descending (p = 0.456) and ascending (p = 0.888) phases.
During the descending phase, were only found differences for TA activation between Q2 and Q3 (p = 0.031) for the CON group. On the other hand, during the ascending phase were found significant differences of TA activation between Q1 and Q3 (p = 0.039) and between Q3 and Q4 (p = 0.001) for CON group, as no differences between quartiles were found for MKD group.
Figure 12 - Mean EMG activity of Tibialis Anterior during the overhead squat, descending (left) and ascending (right) phases. Quartiles are represented from 1 to 4 in each phase.
0 0.5 1 1.5 2 2.5 3 0 0.5 1 1.5 2 2.5 3 1 2 3 4 1 2 3 4 EMG a ctiv ity (% M VC ) EMG a ctiv ity (% MVC ) Phases (Descending/Ascending)
Tibialis Anterior
CON MKD26 No significant differences between groups were found for GM (Figure 13) (descending
phase: F1,30 = 1.189, p = 0.284, 𝜂𝑝2 = 0.038, π = 0.184; ascending phase: F1,30 = 2.471, p
= 0.126, 𝜂𝑝2 = 0.076, π = 0.331). However, it was observed a significant phase x group
interaction for both phases (p = 0.028 and p = 0.047; descending and ascending phases respectively).
During the descending phase, differences between quartiles were found between all quartiles for both CON and MKD groups (p < 0.05). In respect to the ascending phase, also were found differences between all quartiles for both groups (p < 0.05).
Figure 13 - Mean EMG activity of Gastrocnemius Medialis during the overhead squat, descending (left) and ascending (right) phases. Quartiles are represented from 1 to 4 in each phase.
0 2 4 6 8 10 12 14 16 0 2 4 6 8 10 12 14 16 1 2 3 4 1 2 3 4 EMG a ctiv ity (% M VC ) EMG a ctiv ity (% MVC ) Phases (Descending/Ascending)
Gastrocnemius Medialis
CON MKD27 Regarding the SOL muscle (Figure 14), no significant differences were found involving
group for EMG amplitude during the descending phase (F1,30 = 1.443, p = 0.239, 𝜂𝑝2 =
0.046, π = 0.214). No phase x group interactions were found for both descending (p = 0.114) and ascending (p = 0.566) phases. The results also evidenced no main effect
involving group for SOL activation during the ascending phase (F1,30 = 0.773, p = 0.386,
𝜂𝑝2 = 0.025, π = 0.136).
In regard to the differences of EMG amplitude between quartiles for SOL muscle, during the descending phase, we found that both groups demonstrated significant differences between all quartiles. During the ascending phase, it was verified significant differences between the four quartiles for CON group, while in the MKD group, the same behavior was found, except for quartiles Q3 and Q4 which did not display significant differences between each other (p = 0.106).
Figure 14 - Mean EMG activity of Soleus during the overhead squat, descending (left) and ascending (right) phases. Quartiles are represented from 1 to 4 in each phase.
0 2 4 6 8 10 12 14 0 2 4 6 8 10 12 14 1 2 3 4 1 2 3 4 EMG a ctiv ity (% M VC ) EMG a ctiv ity (% MVC ) Phases (Descending/Ascending)
Soleus
CON MKD28 Vastus Medialis to Vastus Lateralis activation ratios
Regarding the VM:VL activation ratios, no significant differences were obtained between MKD group and CON group for both descending and ascending phases (p > 0.05), and no significant differences were found between groups for each quartile (Q1, Q2, Q3 and Q4) (p > 0.05).
In general, the VM:VL activation ratios are very close to 1.00, showing that VM and VL activations were similar for both groups during both phases and during all quartiles.
VM:VL
Activation ratios MKD CON
t-Test p-value Total Descending 1.144 ± 0.384 1.069 ± 0.379 0.633 Descending Q1 1.039 ± 0.673 0.976 ± 0.462 0.769 Descending Q2 1.214 ± 0.430 1.080 ± 0.426 0.447 Descending Q3 1.150 ± 0.342 1.077 ± 0.404 0.650 Descending Q4 1.136 ± 0.398 1.094 ± 0.411 0802 Total Ascending 1.038 ± 0.412 1.042 ± 0.356 0.981 Ascending Q1 1.143 ± 0.473 1.089 ± 0.429 0.767 Ascending Q2 1.076 ± 0.473 1.062 ± 0.351 0.927 Ascending Q3 0.867 ± 0.283 1.008 ± 0.386 0.353 Ascending Q4 0.673 ± 0.233 0.919 ± 0.359 0.081
29 Kinematic Analysis
The average values of the kinematic parameters are displayed in Tables 2 and 3. The t-Test performed to investigate the kinematic differences between groups (MKD and CON) revealed significant differences for the following variables: maximum hip
flexion/extension (t(30) = -3.016, p = 0.005), minimum and maximum knee
internal/external rotation (t(30) = -2.377, p = 0.024 and t(30) = -2.193, p = 0.036,
respectively), minimum and maximum ankle abduction/adduction (t(30) = 2.727, p = 0.011
and t(30) = 3.032 p = 0.005, respectively), hip flexion/extension excursion (t(30) = 2.532, p
= 0.017) and hip adduction/abduction excursion (t(30) = 2.090, p = 0.046).
Joint angles (degrees) MKD CON t-Test p-value Hip Flexion/extension Min 4.48 ± 3.56 6.46 ± 3.12 0.143 Max 78.25 ± 5.92 87.48 ± 7.91 *0.005 Adduction/abduction Min -8.42 ± 9.93 -6.79 ± 5.81 0.575 Max 2.29 ± 3.73 1.06 ± 2.47 0.291 Internal/external rotation Min -5.59 ± 5.70 -6.31 ± 4.22 0.705 Max 1.95 ± 4.32 1.50 ± 4.11 0.791 Knee Flexion/extension Min 2.39 ± 4.14 1.97 ± 3.85 0.797 Max 83.43 ± 8.39 87.45 ± 6.42 0.165 Abduction/adduction Min -0.68 ± 0.89 -0.93 ± 1.03 0.547 Max 19.82 ± 8.83 14.49 ± 5.34 0.143 Internal/external rotation Min 4.53 ± 4.75 0.71 ± 3.65 *0.024
Max 18.79 ± 7.60 13.25 ± 5.69 *0.036 Ankle Dorsiflexion/plantarflexion Min -0.56 ± 3.05 -0.27 ± 1.99 0.753 Max 24.90 ± 5.12 22.73 ± 4.84 0.288 Pronation/supination Min -0.92 ± 3.03 -2.27 ± 3.12 0.295 Max 2.67 ± 3.19 1.75 ± 2.25 0.373 Abduction/adduction Min 3.00 ± 4.50 -0.54 ± 2.65 *0.011 Max 11.05 ± 4.50 6.32 ± 3.59 *0.005
30
Joint excursion angles (degrees) MKD CON t-Test p-value Hip Flexion/extension 72.91 ± 6.72 80.44 ± 7.44 *0.017 Adduction/abduction 9.40 ± 7.61 4.71 ± 4.57 *0.046 Internal/external rotation 3.25 ± 1.98 4.50 ± 3.19 0.309 Knee Flexion/extension 81.04 ± 8.41 85.48 ± 7.78 0.180 Abduction/adduction 19.53 ± 9.24 14.48 ± 6.13 0.183 Internal/external rotation 9.17 ± 7.68 7.80 ± 4.98 0.562 Ankle Dorsiflexion/plantarflexion 25.30 ± 5.64 22.83 ± 5.28 0.269 Pronation/supination 1.85 ± 1.20 2.87 ± 2.02 0.186 Abduction/adduction 7.39 ± 2.17 6.32 ± 2.60 0.303
31 Discussion
In the present study a kinematic and electromyographic analysis of the overhead squat was made in subjects that display excessive MKD. To our knowledge, this is the first study to evaluate the muscle activation in quartiles during each phase (descending and ascending phases) of the squat. Based on the results obtained, we can argue that analyzing the total mean EMG amplitude of each phase is reductive, as it misses a lot of valuable information on the sequence of muscle activation, particularly when evaluating a faulty movement pattern as MKD. Additionally, we do not have knowledge of another study that had analyzed EMG patterns of TFL, BF, VL, VM and PL in individuals that demonstrated MKD during the overhead squat. In our point of view, these muscles would give us important information on the activation pattern showed by the MKD group, as some would help in stabilizing the hip (TFL and BF) and the knee (BF, VL and VM) joints (Kapandji, 2000). PL would also be important, since it contributes to the plantarflexion moment, which is suggested to be higher in the MKD group (Padua et al., 2012).
Our results revealed that subjects showing excessive MKD in the DLS had a different muscle activation pattern comparing with a control group, which are in accordance with the initial hypothesis. In regard of the joint excursion angles, we found significant differences between groups for hip adduction excursion as presented in our hypothesis, although no significant differences were found for hip internal rotation, knee abduction and knee internal rotation, contradicting one of our hypothesis.
An interesting finding of this study was the different activation pattern of the quadriceps muscle group displayed by the MKD group, as they demonstrated higher VL and VM activation in the last two quartiles of the descending phase, comparing to the CON group. Quadriceps plays an important role in maintaining the alignment of the patella in the patellofemoral joint, particularly VM and VL have a major contribution for this matter, as they have an oblique direction of force (Kapandji, 2000). Therefore, if VM and VL produce a balanced contraction, the resulting force will be aligned with the thigh axis. However, if the VL predominates over VM, the patella would tend to dislocate laterally and consequently it may cause patellofemoral pain, or eventually causing lateral patellar subluxation (Kapandji, 2000; Waryasz & McDermott, 2008). In the present study, we expected that subjects from the MKD group would demonstrate higher values of VL
32 activation relative to VM activation compared with CON group, since it has been referred that MKD are associated with PFPS (Nakagawa et al., 2012). However, we did not find significant differences between groups for VM:VL activation ratios. Tang et al. (2001) did not find significant differences also for VM:VL activation ratios during the squatting task, between subjects that have PFPS and a control group. Though, the same authors verified that VM:VL activation ratios during maximal eccentric and concentric isokinetic contractions were lower for subjects with PFPS. In future research, it would be interesting to explore if individuals displaying MKD during the DLS also have lower VM:VL activation ratios compared with a control group when executing isokinetic contractions, since MKD have been associated with PFPS.
Our kinematic results did not show significant differences between groups for maximum hip adduction angle and maximum knee abduction angle, although individuals demonstrating excessive MKD had higher frontal plane hip excursion and revealed higher maximum and minimum knee internal rotation angles. Based on these findings we can speculate that higher eccentric VL and BF contractions in the MKD group might be due to the need to decelerate the higher knee internal rotation.
In our study, the MKD group revealed higher EMG amplitudes of the ADD muscle, mainly during the last two quartiles of the descending phase, which may pull the hip in a more adducted position, facilitating MKD. Padua et al. (2012) had similar findings, as they found that subjects demonstrating MKD showed higher values of ADD activation during the descending phase, although they did not divide this phase in quartiles. Additionally, we found that BF muscle demonstrated higher EMG amplitudes in the MKD group, also during the last two quartiles of the descending phase. Given that some authors refer that the hamstring muscle group participates simultaneously on hip extension and hip adduction (Kapandji, 2000), in particular the BF due to its fiber orientation, we might suggest that BF also contributes to a more adducted thigh in the last degrees of knee flexion, facilitating MKD. We can also suggest, from another point of view, that BF activates more in the last two quartiles of the descending phase in order to eccentrically contract and decelerate knee internal rotation (Kapandji, 2000).
It has been suggested by the literature that dynamic knee valgus is characterized by a tibial internal rotation in conjunction with tibial abduction, femoral adduction and femoral internal rotation (Bell et al., 2013; Padua et al., 2012). In our study the position of the feet
33 during the squat were controlled, as individuals had to maintain the feet pointing ahead. Thus, we can assume that higher maximum ankle abduction found in MKD group occurred mainly as a result of a tibial internal rotation relative to the foot. We could not found significant differences for maximum knee abduction, maximum hip adduction nor maximum hip internal rotation. However, since dynamic knee valgus is referred as a combination of femoral and tibial motions in more than one plane (Bell et al., 2013), becomes more difficult to find significant differences when comparing isolated movements from one plane.
In terms of hip stability, our results did not show differences between groups for GMax, GMed and TFL activation, during the descending phase. Those findings suggest that differences verified in neuromuscular control of the hip between groups were not due to lower muscle activation from the abductors in the MKD group, but rather to higher ADD and BF activation levels, mainly in the last degrees of knee flexion. Those results are in accordance with the results obtained by Bell et al. (2012) and Padua et al. (2012), as they found significant differences in the ADD activation between groups (higher EMG amplitude for MKD group) and no significant differences for gluteal muscles, during the overhead squat. However, we verified that the MKD group showed a tendency to activate more the TFL in the last two quartiles of the descending phase and a group x phase interaction was shown (Figure 5). This means that regarding TFL activation, the mode how subjects evolve among the descending phase are influenced by MKD. Based on this findings, we can argue that TFL may have a tendency to activate more in subjects displaying MKD in order to stabilize the hip against the adductor moment.
It had been hypothesized in the literature that MKD during the overhead squat would be associated with lack of hip strength, particularly in external rotation and abduction of the hip. However, the results did not support this hypothesis (Bell et al., 2008; Bell et al., 2012). Bell et al. (2008) surprisingly found that subjects from the MKD group demonstrated greater hip external rotation and hip extension strength, while no differences were found for hip adduction or hip abduction strength between CON group and MKD group. Bell et al. (2012) also investigated this issue and observed no differences between groups for hip external rotation, internal rotation, extension, or abduction peak strength. Based on those findings and the results of the present study, we might suggest that MKD during the DLS are not the result of hip muscle weakness, but rather a consequence of innefective neuromuscular activation pattern and coordination.