PSI-20 Portfolio Efficiency Analysis with SFA
Nuno Ferreira #1,
Francisca Mendonça Souza
*2, Adriano Mendonça Souza
#3#1ISCTE-IUL, Av. das Forcas Armadas, 1649-026 Lisbon, Portugal [email protected]
*2PPGEP, UFSM – RS/Brasil [email protected]
#3Department of Statistics, Federal University of Santa Maria Roraima Avenue, 100, Santa Maria, RS state, Brazil
Abstract - The determination of the study was to assess the technical efficiency of the individual companies and their respective groups of the Portuguese stock market. In order to achieve that were combined the input variables “market value and return” with exogenous variables such as “interest income," “depreciation," “cost of goods," “employees” and “net sales” in a Stochastic Frontier Analysis model. The technical efficiency of the PSI-20 enterprises index was estimated discovering the factors which assurance to efficiency variability, applying the SFA approach main improvement which lies in its potential to categorize between measurement error and systematic inefficiencies in the estimation process. The results revealed that the technical efficiency is higher for the enterprises in industry, construction and distribution economic sectors whereas the commercial banking sector has the lowest technical efficiency scores. The “employees” and “depreciation” variables are the elements that most enhance to the stock market inefficiency.
Keywords – Stochastic Frontier Analysis; Efficiency; Stock Markets; PSI-20
1.
Introduction
Financial researchers have long been interested to examine whether there is difference between factors influencing business and financial performance. Many studies have emphasized the need for the company´s to increase its competitiveness, and have suggested the use of performance measurement as a tool for continuous improvement. General measurement of a company’s performance and subsequent feedback to its managers is vital for business transformation. Measurement also enables businesses to be compared with each other on the basis of standardized information, allowing best practices to be identified and applied more widely. The general concept of efficiency refers to the
difference between observed and optimal values of inputs, outputs, and input-output mixes. In literature, Decision Maker Units (DMUs) are production units (e.g. firms, regions, countries, etc.) which assumed to produce according to a common technology. Each DMU reach the frontier when produces the maximum possible output for a given set of inputs, if the analysis is output oriented. When the orientation is inverse (input oriented) the frontier is reached when the DMU maintain an expected output consuming the minimum of inputs available. Notwithstanding, the performance measurement concerns different notions of efficiency (e.g. revenue, technical, productive and allocative). Market failure occurs due to inefficiency in the allocation of goods and services. For this matter, the search for inefficiency is sometimes justified due to structural problems or market imperfections or even other factors, resulting in firms producing below their maximum attainable output. Efforts to measure how efficiently a firm produces outputs with its inputs have led to the development of a number of efficiency concepts, including scale efficiency, scope efficiency, economic efficiency, and technical efficiency. Whereas technical efficiency requires only input and output data, economic efficiency also requires price data. A substantial number of literature had documented two broad paradigms for measuring economic efficiency, one based on an essentially nonparametric, programming approach to analysis of observed outcomes, and one based on an econometric approach to estimation of theory based models of production, cost or profit. Following the latter paradigm, the Stochastic Frontier Analysis (SFA) of Aigner et al (1977) is in our days a very popular model for efficiency measurement purposes, being the Cobb-Douglas and the Translog the most frequently applied models in literature of econometric inefficiency estimation.
____________________________________________________________________________________
International Journal of Latest Trends in Finance & Economic Sciences
IJLTFES, E‐ISSN: 2047‐0916
Copyright © ExcelingTech, Pub, UK (http://excelingtech.co.uk/)
The use of SFA in capital market studies is relatively new. Notwithstanding, an extensive survey of the underlying models, econometric techniques and empirical studies can be find in several papers. Among several others, Das and Kumbhakar (2012) focus their analysis in the stock market, proposing an alternative approach to empirically modelling financial constraints, using SFA to estimate a measure of financial constraint for each DMU of a panel of Indian manufacturing firms. Muradoglu and Sivaprasad (2013) explored the effect of leverage mimicking factor portfolios in order to explain the stock return variations. Several studies followed similar approaches to define the percentage that could be increased in the market value of an average DMU regarding the benchmark, considering the efficient use of all resources (e.g. Habib and Ljungqvist (2005); Pawlina and Renneboog (2005); Nguyen and Swanson (2009). In contrast to using market value frontier to measure efficiency, Amess and Girma (2009) use an empirical model to evaluate the effect of efficiency on the market value, applying a SFA approach to estimate TE involving revenue, number of employees and fixed assets.
2.
Methodology
2.1
Dataset
Using the 20 companies of the PSI-20 index, between 01/01/1993 and 01/09/2013 obtained from Datastream database (Table 1), the stock Portuguese index market includes 7 categories of companies, namely: Banks, Industry, Media, Energy, Food & Allied Products, Construction and Communications (5, 3, 1, 4, 4, 1 and 2 companies, respectively). The panel data composition was set considering the individual company’s return as a dependent variable. The market return was taken by preparing individual company’s daily closing price by using which the return of individual company calculated as follows: Individual Market Return = ln(Pt) – ln(Pt-1) where Pt is the closing price at period t, and Pt-1 is the closing price at period t-1 and ln is the natural log.
Table 1 - List of the Companies from PSI-20 Index
Group Company
Industry Altri SGPS Portucel Semapa Construction Mota Engil SGPS Food and Allied Products Jerónimo Martins
Sonae Indústria SGPS Sonae.com Sonae SGPS Media Cofina
Comunications Portugal Telecom SGPS Zon Optimus
Energy EDP Renováveis EDP Energias de Portugal GALP Energia SGPS REN
Banks Banco Comercial Português (BCP) Banco Espírito Santo (BES) Banco Português de Investimento (BPI) BANIF
Espírito Santo Financial Group
2.2. Data analysis
Considering a stochastic frontier model (Battese and
Coelli, 1995), where each DMU is denoted by i, the
individual return is obtained by the following production function:
ln (1)
and where; i = 1, 2,…, N; yi measures the individual
return of the ith company; x
i is a 1 x K vector
corresponding to the inputs (Individual Market Return and Market Value); and β is a 1 x K vector of unknown scalar parameters to be estimated. In this model, the usual error term ε can be decomposed in two distinct terms vi-ui (1) for each DMU. The error
term vi is similar to that in traditional regression
model, and likewise is assumed to be independently
and identically distributed as 0, . This term
captures random variation in output due to factors beyond control of the DMUs, such as measurement errors in dependent variables or explanatory variables eventually omitted. The error term ui is a
non-negative random variable, accounting for the existence of technical inefficiency in production being identically distributed as half-normal ui ~
|N(0,σ2)|. The subtraction of the non-negative random variable ui, from the random error vi, implies that the
logarithm of the production is smaller than it would otherwise be if technical inefficiency did not exist (Battese and Coelli (1995). According to Battese and Coelli (1995), the inefficiency distribution parameter can also be specified as the inefficiency model:
(2) where; δ is a vector of parameters to be estimated, zi
Depreciation; Cost of Goods; Employees and Net Sales) that determine technical inefficiency and ωi is
distributed following N(0, σω2). All observations
either lie on, or are beneath the stochastic production frontier and this is assured by ui ≥ 0 in Equation (2). The variance terms are parameterized by replacing
σv2 and σu2 with and
according Battese and Corra (1977) and Battese and
Coelli (1995). With the value of γ ranged between 0 and 1, the equality to 1 indicates that all the deviation from the frontier are entirely due to technical inefficiency (Coelli, Rao and Battese, 1998) being the technical efficiency of each DMU expressed as follows:
| ,
| , (3)
The E is the expectation operator and thus the measure of technical efficiency is based on a conditional expectation given by Equation (3), considering that the value of vi – ui evaluated at the
maximum value of Yi is conditional on ui = 0 (Battese
and Coelli, 1988).
The parameters of the stochastic frontier model (1) and the technical inefficiency model (2), were estimated using the FRONTIER version 4.1 software (Coelli, 1996). The statistical tests were performed with SPSS®.
3. Empirical Results
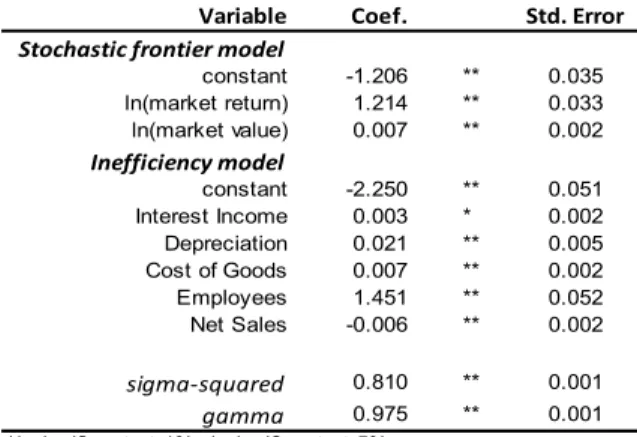
Initially it was estimated the parameters of the stochastic frontier model (1) and the inefficiency model (2). Table 2 reports the maximum-likelihood estimates of the parameters of the models, the corresponding standard errors, and the test statistics.
These estimates justify that the inclusion of the inefficiency effects is highly significant (at 1% level) in the analysis of market returns, as the estimate for the variance is closed to one (γ=0.975). From this it can being interpreted that 97.5% of random variation in stock returns is due to inefficiency. This can also be interpreted that the 97.5 percentage variation in output among the companies is due to the differences in technical efficiency.
It is evident from Table 2 that the estimates of σ (0.81) are significantly (at 1% level) different from zero indicating a good fit and correctness. Regarding the SFA model, the maximum-likelihood estimates of the coefficients of market return and market value are found to be significant at 1% level. These results indicate that the input variables significantly affect
the amount of return in the individual companies listed in the PSI-20.
The market return shows significant relationship with the stock returns which means that if the overall market rises, then the return of individual companies will increase, and if the overall market falls, then the return of individual companies will decrease. The other input variable, namely the market value also shows significant relationship with the stock returns which means that if the market value of individual company shows upper trend, then the return of that company will increase, whereas if it shows lower trend, then the return of that company will decrease.
Table 2 - Maximum-Likelihood Estimates of the Stochastic Frontier Production Function
Variable Coef. Std. Error
Stochastic frontier model constant -1.206 ** 0.035 ln(market return) 1.214 ** 0.033 ln(market value) 0.007 ** 0.002 Inefficiency model constant -2.250 ** 0.051 Interest Income 0.003 * 0.002 Depreciation 0.021 ** 0.005 Cost of Goods 0.007 ** 0.002 Employees 1.451 ** 0.052 Net Sales -0.006 ** 0.002 sigma‐squared 0.810 ** 0.001 gamma 0.975 ** 0.001 ** significant at 1%; * significant at 5%.
These results support previous results (e.g. Hasan et
al, 2012) in a sense that positive relationships
between those input variables are common. Concerning the inefficiency model results from Table 2, it is possible to conclude that “Interest Income”, “Depreciation”, “Cost of Goods” and “Number of Employees” are in fact, factors that contribute to the companies’ inefficiency. Only the “Net Sales” do the opposite. Despite all of the factors being statistically significant, the “number of Employees” is the one that most affect the inefficiency with a coefficient of 1.451. Being a positive impact means that bigger companies tend to be less efficient whereas companies with less employees tend to be more efficient. A comparable interpretation can be done with the remaining coefficients. In the case of the “Net Sales”, the reading of the results should be inverse, meaning that more sales have less impact in the inefficiency, in fact those sales contribute to the company’s efficiency.
This paper studies the technical efficiency of Portuguese enterprises of the PSI-20 index stock market over the period 1993–2013 using stochastic frontier analysis. The period examined in the study is extensive, covering the changing background faced by the major enterprises, financial crises, and many enterprises restructuring processes. During this time window, it was celebrated twenty years of existence of the Maastricht Treaty. In this context, it is reasonable to ask about the current status of the index stock market returns Portuguese efficiency performance. Taking these dynamics into contemplation, this study offers new evidence on the time series properties of the efficiency of the major Portuguese enterprises. Consistent with earlier studies, the results show substantial inefficiencies in the Portuguese enterprises. The estimated model concluded that 97.5% of random variation in stock returns is due to inefficiency.
The number of employees is the factor that most affect the inefficiency means that bigger companies tend to be less efficient. Focusing the analysis by year, the paper achieved the conclusion that the first year of the sample (1993) stayed below the averaged efficiency. This fact was certainly due to the conciliation of this year was the year of the PSI-20 creation.
The model results showed that the three greatest technical efficient groups were Industry, Construction and Food and allied products. The authors believe that the results of this study are very interesting for several players both from academic field and investors and regulatory authorities.
References
[1] Aigner D. J., Lovell C. A. K. and Schmidt, P. (1977). Formulation and estimation of stochastic frontier production function models. Journal of Econometrics, 6, 21-37. [2] Amess, K. and Girma, S., (2009). Do Stock
Markets Value Efficiency? Scottish Journal of
Political Economy,56(3),321–331.
[3] Battese, G. E., and Coelli, T. J. (1988). Prediction of firm-level technical efficiencies with a generalized frontier production function and panel data. Journal of Econometrics, 38:387-399.
[4] Battese, G. E. and Coelli, T. J. (1995). A Model for Technical Inefficiency Effects in a
Stochastic Frontier Production Function for Panel Data. Empirical Economics, 20, 325-332. [5] Battese, G. E., and Corra, G. S. (1977).
Estimation of a production frontier model: With application to pastoral zone of eastern Australia.
Australian Journal of Agricultural and Resource Economics, 21:169-179.
[6] Coelli, T. J., (1996). A guide to FRONTIER
version 4.1: a computer program for stochastic frontier production and cost function estimation, Department of Econometrics,
University of New England, Armidale, Australia.
[7] Coelli, T., Rao, D., and Battese, G. (1998). An Introduction to fficiency and Productivity Analysis. Kulvwer Academic Publishers Group, London
.
[8] Das, A. and Kumbhakar, S. C., (2012). Productivity and Efficiency Dynamics in Indian Banking: An Input Distance Function Approach Incorporating Quality of Inputs and Outputs. Journal of Applied Econometrics, 27(2), 205-234.
[9] Habib, M. and Ljungqvist, A., (2005). Firm value and managerial incentives: A stochastic frontier approach, Journal of Business, 78, 2053-2094.
[10] Hasen, M. Z., Kamil, A. A., Mustafa, A. and Baten, M. A. (2012). Stochastic Frontier Model Approach for Measuring Stock Market Efficiency with Different Distributions, Plosone, 7(5), 1-9.
[11] Meeusen, W. and van de Broeck, J. (1977). Efficiency estimation from Cobb-Douglas production functions with composed error. International Economic Review, 18,435-444.
[12] Muradoglu, Y. G. and Sivaprasad, S. (2013). The effect of leverage mimicking portfolios in explaining stock returns variations, Studies in Economics and Finance, Emerald Group Publishing, 30(2), 94-107.
[13] Nguyen, G. X. and Swanson, P. E. (2009). Firm Characteristics, Relative Efficiency, and Equity Returns, Journal of Financial and Quantitative Analysis, 44(01), 213-236.
[14] Pawlina, G. and Renneboog, L. D. R., (2005). Is Investment-Cash Flow Sensitivity Caused by the Agency Costs or Asymmetric Information? Evidence from the UK, Discussion Paper 2005-23, Tilburg University, Center for Economic Research.