A work project, presented as part of the requirements for the Award of a Masters Degree in Economics from NOVA School of Business and Economics
BENCHMARKING IN PRIMARY HEALTH CARE: AN APPLICATION OF THE STOCHASTIC FRONTIER ANALYSIS AND THE GRADES OF MEMBERSHIP
APPROACH TO PORTUGUESE FAMILY HEALTH UNITS
ANA CATARINA ARRANHADO NEVES, 405
A project carried out under the supervision of:
Professor Pedro Pita Barros
2 Benchmarking in primary health care: An application of the stochastic frontier analysis and the grades of membership approach to Portuguese family health units
Abstract
This work aims at assessing the Portuguese family health units, whose creation was part of the primary health care reform that began in 2005, in terms of their performance. Family health units are ranked with regard to cost efficiency – stochastic frontier analysis is the econometric technique followed – and the establishment of extreme profiles they compare to is determined through the grades of membership approach. The definition of specific goals for each family health unit to achieve in terms of performance are delivered as the final output of this work, which should allow for improvement of efficiency levels.
3 I. Introduction
The primary health care reform that began in 2005 in Portugal aimed, according to the Missão para os Cuidados de Saúde Primários (MCSP), at reorganising the whole health system, with primary health care centres as the supporting pillar of the National Health Service (2006). Family health units (FHUs) were designed as one of the operational units of primary health care centres and were intended to be the first point of contact between the patient and the public health system (MCSP, 2006; MCSP, 2008). FHUs vary among themselves in terms of services provided and costs incurred and it is important to assess them in terms of efficiency, in the context of an increasing proportion of the national income being devoted to expenditures on health. This work aims at (1) quantifying and ranking family health units in terms of cost efficiency, using stochastic frontier analysis as the chosen econometric technique, and at (2) establishing benchmarks (in the form of specific goals regarding performance) for them to follow, through the grades of membership method.
4 primary health care reform that began in Portugal in 2005 is somehow in line with these ideas in the sense that its goal is to have the National Health System (NHS) gravitating towards primary health care (MCSP, 2006).
The creation of family health units (FHUs) was thought as one of the eight main areas of action in terms of the reform (MCSP, 2006). It is intended to foster better access to health services, higher satisfaction levels from both professionals and citizens and to promote a better use of the resources (Barros & Simões, 2007).
FHUs are made up of teams of doctors, nurses and administrative staff who organise themselves in a voluntary way and propose its creation (MCSP, 2008). Each FHU is responsible for the provision of some basic primary health care services to a certain number of patients in a given area but additional services may be contracted, depending on its category, which will then determine the amounts paid to the team members and to the institution itself (MCSP, 2008). There are two categories of FHUs: Type A and B. Type A can be thought of as the least developed one, an early stage the teams have to undergo that allows them to improve on their work and eventually become a type B family health unit; FHUs falling under category B have more demanding targets to meet in terms of services provided (Administração Central do Sistema de Saúde [ACSS], 2010; MCSP, 2008). Payment schemes are also different: Type A members are paid their base salary (plus extra working hours) and type B follow individual payment by results schemes (ACSS, 2010). Also, institutional incentives may be attributed to type B family health units (ACSS, 2010).
5 health care – and questioning whether a sustainable path is being followed –, the pursuit of efficiency becomes imperative (Jacobs, Smith, & Street, 2006; Worthington, 1999). It is thus important to assess these FHUs in terms of efficiency, which here should be understood as cost efficiency, and to allow for improvement of their performance by setting benchmarks for them to follow.
B. Ranking family health units in terms of efficiency: Stochastic frontier analysis This work aims at analysing family health units in terms of cost efficiency, i.e. the quantity of services FHUs can provide at minimum costs given input prices. Stochastic frontier analysis (SFA) is a regression-based technique that allows for the specification of a “best practice” frontier by maximum likelihood estimation (Jacobs et al., 2006; Lovell, 2006). Since this work is about cost efficiency, a minimum cost frontier has to be estimated, against which one may compare the FHUs under assessment.
In this case, SFA follows a conventional process of specifying a cost function with the general form using cross sectional data:
(1)
where refers to costs, refers to prices of inputs and to outputs of the th FHU under observation. In the efficiency analysis the residual is the parameter of interest, representing the deviation between the observed data and the estimated relationship, which has two components with zero covariance:
(2)
6 associated with cost inefficiency (Jacobs et al., 2006; Lovell, 2006). It should be noted that:
(3) and is independent of
and that takes non-negative values (Jacobs et al., 2006; Lovell, 2006). The distribution follows has to be previously assumed (typically, half normal, truncated normal or exponential). is a representation of how far the family health unit operates from the cost frontier – being zero if it were on the frontier, i.e. no inefficiency would be present, and greater than zero otherwise, with costs exceeding the theoretical minimum and meaning that a decrease in costs is still feasible (Greene, 2006; Jacobs et al., 2006). As stated in Jondrow et al. (1982), one will have that is indirectly observed from considering its expected value conditional on the residual : .
The measure of efficiency that allows for ranking FHUs, , can then be obtained – and the way it is computed depends on the empirical specification of the cost function – with playing a central role in determining its value (Jacobs et al., 2006). It lies in the interval , but one will typically present its inverse:
, with 1 representing no inefficiency (and with the differences between the observed data and the relationship predicted by the model being just due to random noise) and with 0 being related to highly inefficient organisations (Jacobs et al., 2006).
7 crucial to allow for the existence of multiple “best practice” models, so that each FHU can look up to the one it compares to.
The grades of membership (GoM) analysis, originally presented by Woodbury and Clive (1974), allows for the delivery of a score measuring the degree of similarity of unit , , to the extreme profile of FHU , . One will have that:
(4) for each
These scores are obtained through maximum likelihood estimation and one can find different proposals for the construction of the likelihood function (Manton et al., 1994). The unconditional likelihood function in Manton et al. (1994) is specified as follows:
(5)
is the response of unit to categorical variable , , with level ,
, and is coded as binary (0,1), meaning “no” and “yes”, respectively;
are realisations of the components of the random vector with distribution function
; is the probability of having the th response for the th question from the th extreme profile.
The ugom application for Stata11 has the general form of the unconditional likelihood function specified as follows:
(6) All are independently and identically distributed realisations of with joint density function , automatically assumed to be the Dirichlet distribution with parameter . is maximised in and in parameter and delivers .
8 greater similarities with the extreme profiles as the units of reference from which specific goals allowing for performance improvement can be defined.
This work proceeds as follows: Section II presents the literature review, particularly focused on the application of SFA to health care; section III is on the empirical specification of these models to family health units in Portugal for the year 2009; the results obtained are presented in section IV. Finally, conclusions are drawn in section V.
II. Literature review
Although increasing costs with healthcare services are partly attributable to inefficiency of providers, only recently have advanced econometric and mathematic techniques of efficiency measurement been applied to the health sector (Worthington, 1999). In fact, Hofler and Folland provided with one of the first applications of SFA to health care in 1991 (as cited in Moshiri, Aljunid, & Amin, 2010). A literature review on more recent use of SFA applied to health care is presented in this section.
Hollingsworth (2008) provides with a review of published papers on frontier efficiency measurement and highlights how it has been used in a number of different settings within the general health sector of both the USA and the EU: One can find hospital, public health, nursing homes and primary care applications of SFA. Attention is drawn to the possibilities of taking access and quality into account when quantifying efficiency, of comparing efficiency levels of organisations according to their legal status, of trying different functional forms when specifying the frontier (Hollingsworth, 2008).
9 working under two different contracting schemes: Some were paid upon the fulfilment of a number of objectives (contracted teams) and others were paid on the basis of historical costs of current inputs (teams managed by the public authorities). The estimates of the inefficiency term are then used for the construction of an inefficiency effects model, pointing out to the non existence of statistical evidence that contracted-out teams were more efficient than the publicly managed ones (Puig-Junoy & Ortún, 2004).
In Murillo-Zamorano and Petraglia (2008) it is shown how different conclusions are reached (including when ranking organisations in terms of efficiency) depending on whether one incorporates quality in the measurement of output produced by primary care centres in Extremadura. It has been shown that different assumptions regarding the distribution of the inefficiency term cause very little impact on the efficiency measures of primary care output of English Family Health Services Authorities (Giuffrida & Gravelle, 1999). Giuffrida and Gravelle (1999) also compare (1) different regression and non-parametric methods in terms of their efficiency rankings and conclude they are poorly correlated and (2) different specifications of the empirical model used and conclude they yield very different efficiency scores.
10 (Street, 2003). Efficiency targets following conclusions from SFA should thus be carefully set.
There are a number of applications of the GoM approach in the establishment of health status profiles, as one can find in McNamee (2004), in Erosheva, Fienberg and Joutard (2007), in Portrait, Lindeboom and Deeg (1999), Seplaki, Goldman, Weinstein and Lin (2004). Ibern (2007) provides with an idea of how to use the GoM as the basis for the assessment of medical facilities in terms of cost efficiency: The estimates of the grades of membership of each one of the 60 hospitals that are part of the Public Hospital Utilization Network in Cataluña to the 5 extreme profiles that are presented in the paper allow for the prediction of resource use, which can then be compared to actual costs incurred by the hospitals. This seems to be the only attempt of using the GoM approach in the efficiency analysis of organisations.
III. Methods A. Data
The data set used in this work comprises cross sectional information on 110 family health units operating all over the country (49 observations from an original sample of 159 FHUs had to be excluded because there was missing data regarding some variables of interest). This data set compiles information collected by a number of institutions and was provided by the Administração Central do Sistema de Saúde. There is data available regarding covered population, activity level, costs incurred and composition of teams of providers for the year 2009.
Variables used.
11 hours and financial incentives for the accomplishment of certain health targets), as well as with pharmaceutical drugs and diagnostic tests prescribed to patients. Total and average user costs are referred to as and , respectively.
As to labour input prices, there is detailed information on expenditures (in Euros) with doctors, nurses and administrative staff for each family health unit. Their prices (or yearly salaries) are defined as the total expenditures divided by the number of professionals. , and stand for the price of having a doctor, a nurse and a member of the administrative staff, respectively, working in the th family health unit.
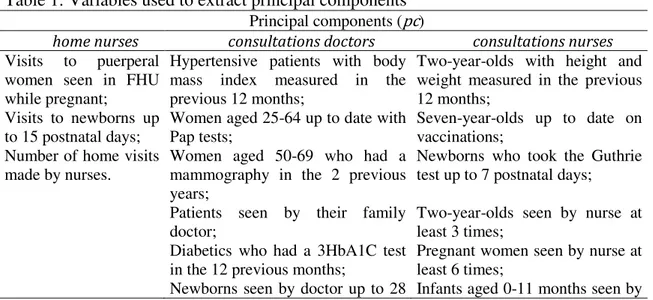
Although one would ideally have health outcomes, indicating the “value-added” to health achieved by patients who contacted with FHUs, existing data only allows for the inclusion of activity levels as outputs. There is information available on the total number of home visits made by doctors . Also, there is information on the provision of some specific services within the more general category of consultations with doctors, consultations with nurses and home visits made by nurses – these variables present, however, high correlation coefficients and one should thus rely on the use of principal components, extracted through principal component analysis, as the outputs. The independent variables used to extract the principal components are listed in Table 1.
The principal component of nurse home visits (accounting for 73.1 percent of total variation) is named , principal components of consultations with doctors (together accounting for 82.06 percent of total variation) are referred to as
12 and and those of consultations with nurses are
and (accounting for 73.89 percent of total variation). Every relates to the quantity of services provided, whereas is about contrasts between services provided specifically to puerperal women/pregnant women/newborns and other more general services; the meaning of is not easily understandable and, since that is not the focus of this work, one will refrain from interpreting this variable. As to which principal components to use as explanatory variables, the eigenvalue greater than unity was used as the rule to retain principal components. Results obtained using general measures of output and principal components may be compared in order to assess their consistency.
Finally, variables regarding population covered that relate to aspects the FHU cannot control and that are likely to affect the level of costs incurred are also included in the data set: is the number of people aged less than 15, is the number of people aged 65 and older and is the number of females.
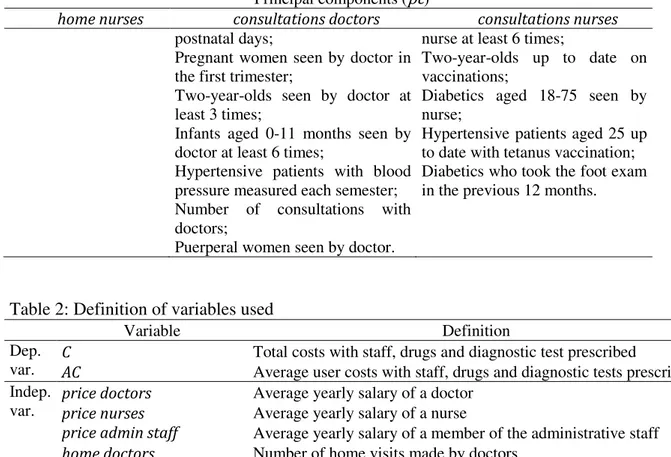
The exact definition and descriptive statistics of these variables are presented in Table 2 and Table 3.
Table 1: Variables used to extract principal components Principal components (pc)
home nurses consultations doctors consultations nurses
Visits to puerperal women seen in FHU while pregnant;
Hypertensive patients with body mass index measured in the previous 12 months;
Two-year-olds with height and weight measured in the previous 12 months;
Visits to newborns up
to 15 postnatal days; Women aged 25-64 up to date with Pap tests; Seven-year-olds up to date on vaccinations; Number of home visits
made by nurses.
Women aged 50-69 who had a mammography in the 2 previous years;
Newborns who took the Guthrie test up to 7 postnatal days;
Patients seen by their family doctor;
Two-year-olds seen by nurse at least 3 times;
Diabetics who had a 3HbA1C test in the 12 previous months;
Pregnant women seen by nurse at least 6 times;
13 Principal components (pc)
home nurses consultations doctors consultations nurses
postnatal days; nurse at least 6 times; Pregnant women seen by doctor in
the first trimester;
Two-year-olds up to date on vaccinations;
Two-year-olds seen by doctor at least 3 times;
Diabetics aged 18-75 seen by nurse;
Infants aged 0-11 months seen by doctor at least 6 times;
Hypertensive patients aged 25 up to date with tetanus vaccination; Hypertensive patients with blood
pressure measured each semester;
Diabetics who took the foot exam in the previous 12 months. Number of consultations with
doctors;
Puerperal women seen by doctor.
Table 2: Definition of variables used
Variable Definition
Dep.
var. C AC Total costs with staff, drugs and diagnostic test prescribed Average user costs with staff, drugs and diagnostic tests prescribed Indep.
var. price doctors price nurses Average yearly salary of a doctor Average yearly salary of a nurse
price admin staff Average yearly salary of a member of the administrative staff
home doctors Number of home visits made by doctors
pc1 home nurses Principal component of home visits made by nurses
pc1 consultations doctors Principal component of consultations with doctors
pc2 consultations doctors Principal component of consultations with doctors
pc3 consultations doctors Principal component of consultations with doctors
pc1 consultations nurses Principal component of consultations with nurses
pc2 consultations nurses Principal component of consultations with nurses
pop65 Number of people aged 65 and older attending the FHU
pop15 Number of people younger than 15 attending the FHU
popfem Number of females attending the FHU
Table 3: Descriptive statistics of variables used
Variable Mean Std. Dev. Min Max C 3,184,802 993,779.4 1,057,239 6,513,609 AC 361.2303 70.40582 169.5066 557.2353
price doctors 60,977.15 25,328.75 13,085.17 115,133.3
price nurses 21,271.53 8,133.464 5,569.374 41,003.06
price admin staff 14,377.39 5,828.084 3,847.034 25,728.83
home doctors 419.9727 183.5131 49 1,096
pc1 home nurses -8.763636 1.48e+09 -2.88e+09 4.04e+09
pc1 consultations doctors -5.309091 2.72e+09 -7.08e+09 9.00e+09
pc2 consultations doctors 4.052841 1.18e+09 -4.28e+09 3.01e+09
pc3 consultations doctors -2.186364 1.04e+09 -1.83e+09 3.31e+09
pc1 consultations nurses -21.67273 2.53e+09 -6.03e+09 1.04e+10
pc2 consultations nurses 5.168182 1.31e+09 -3.39e+09 5.08e+09
14 Variable Mean Std. Dev. Min Max
pop15 1,388.608 364.1761 470.1 2,713.2
popfem 4,580.12 1,088.898 1,661.02 8,299.2
B. Stochastic frontier analysis on the assessment of family health units
The empirical specification of the stochastic cost frontier for FHUs is presented as Equation 7.
(7)
with standing for the constant term, for the vector of explanatory variables in Table 2 and the vector of the parameters. As to the functional form, the likelihood ratio (LR) test was performed when deciding on whether to include the squared term of
(which would allow to correct for the assumption of constant rate of change in costs independently of the scale of operation) and the results suggest the more restrictive specification cannot be rejected, for the usual significance levels, against the unrestrictive model using the squared term. It should be noted that in efficiency analyses logarithmic transformations are typically made but this has the disadvantage of having the variables and the residual approaching normalisation and thus the frontier should reduce to an ordinary least squares regression, with no inefficiency component and only statistical noise being present (Jacobs et al., 2006). This is in fact what happens when the variables of this data set are in the logarithmic form and the frontier is estimated: The null hypothesis of no inefficiency cannot be rejected and thus the SFA should not be performed. Since this does not seem realistic, one will only have variables in natural units in this work.
15 2006). This work compares the correlation coefficients of the efficiency scores of the frontiers using total and average user costs.
As to the distribution of the inefficiency term, its choice is not guided by any economic criterion, as stated in Schmidt and Sickles (as cited in Jacobs et al., 2006). Although comparison regarding the inefficiency scores using various distributional assumptions is made, this work focuses on the stochastic frontier with the inefficiency component assumed to follow the exponential distribution.
The explicit formula that allows for the estimation of the inefficiency term following the exponential distribution is as follows:
(8)
where stands for the standard deviation, is the probability density function of the standard normal distribution and is the cumulative distribution function of the standard normal distribution.
The measure that allows ranking family health units is in this case specified as (Jacobs et al., 2006):
(9)
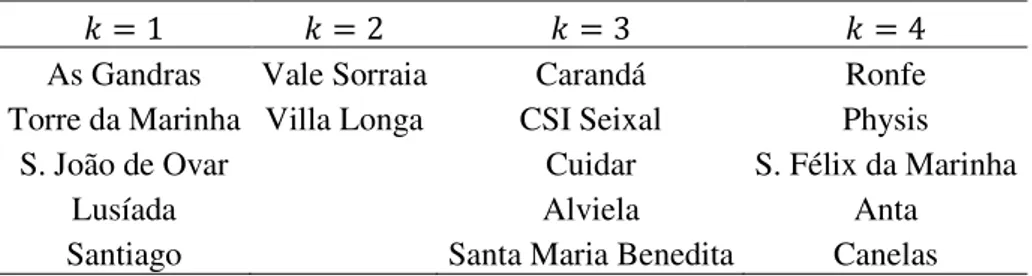
16 defined sets of extreme profiles to which FHUs present some degree of similarity (grade of membership scores). The number of extreme profiles is set at 4.
Table 4: Definition of additional variables used Variable Definition
users Number of people attending the FHU
teams Number of doctors, nurses and members of the administrative staff at the FHU
Table 5: Descriptive statistics of additional variables used Variable Mean Std. Dev. Min Max
users 8,816.809 2,112.448 3,134 15,960
teams 19.87273 4.115554 10 34
Table 6: Definition of classes used in the the GoM analysis Variable Interval considered (observations)
C (4) (43) (62) (1)
price doctors (18) (24) (63) (5)
price nurses (18) (30) (51) (11)
price admin staff (20) (29) (49) (12)
home doctors (93) (17)
pc1 home nurses (63) (35) (12)
pc1 consultations doctors (42) (14) (54)
pc2 consultations doctors (54) (30) (26)
pc3 consultations doctors (62) (31) (17)
pc1 consultations nurses (10) (97) (3)
pc2 consultations nurses (54) (33) (23)
pop65 (12) (87) (10) (1)
pop15 (14) (83) (13)
popfem (9) (93) (8)
users (10) (97) (3)
teams (12) (84) (14)
IV. Results
A. Stochastic frontier analysis on the assessment of family health units
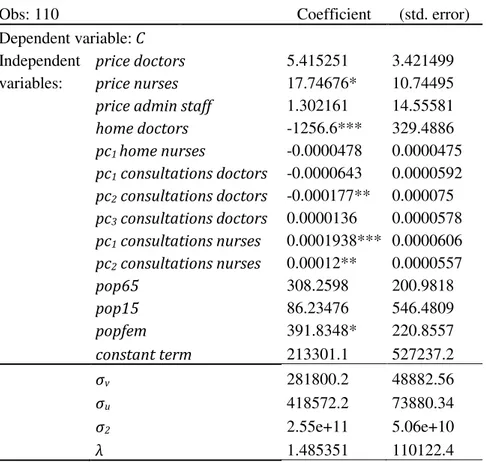
17 element makes the most part of the error term . The null hypothesis of no cost inefficiency is tested against the alternative . The one sided generalised LR test is performed and the null is rejected at 1 percent significance level. It is also tested whether variables accounting for characteristics of covered population are jointly significant and the LR test suggests costs incurred are a function of prices faced and outputs provided, as well as age mix and gender of the population served.
Table 7: Estimates of parameters of the stochastic cost frontier
Obs: 110 Coefficient (std. error)
Dependent variable: C
Independent price doctors 5.415251 3.421499 variables: price nurses 17.74676* 10.74495
price admin staff 1.302161 14.55581
home doctors -1256.6*** 329.4886
pc1 home nurses -0.0000478 0.0000475
pc1 consultations doctors -0.0000643 0.0000592
pc2 consultations doctors -0.000177** 0.000075
pc3 consultations doctors 0.0000136 0.0000578
pc1 consultations nurses 0.0001938*** 0.0000606
pc2 consultations nurses 0.00012** 0.0000557
pop65 308.2598 200.9818
pop15 86.23476 546.4809
popfem 391.8348* 220.8557
constant term 213301.1 527237.2
σv 281800.2 48882.56
σu 418572.2 73880.34
σ2 2.55e+11 5.06e+10
λ 1.485351 110122.4
*Statistically significant at 10 percent significance level. ** Statistically significant at 5 percent significance level. *** Statistically significant at 1 percent significance level.
As to the efficiency measure
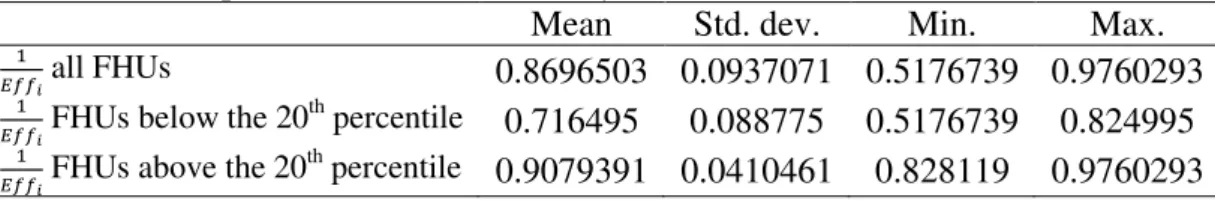
18 against the alternative that type A present smaller average efficiency levels than type B family health units.
Table 8: Descriptive statistics of efficiency scores
Mean Std. dev. Min. Max.
all FHUs 0.8696503 0.0937071 0.5176739 0.9760293 FHUs below the 20
th percentile
0.716495 0.088775 0.5176739 0.824995 FHUs above the 20
th percentile
0.9079391 0.0410461 0.828119 0.9760293
Graph 1: Distribution of efficiency scores
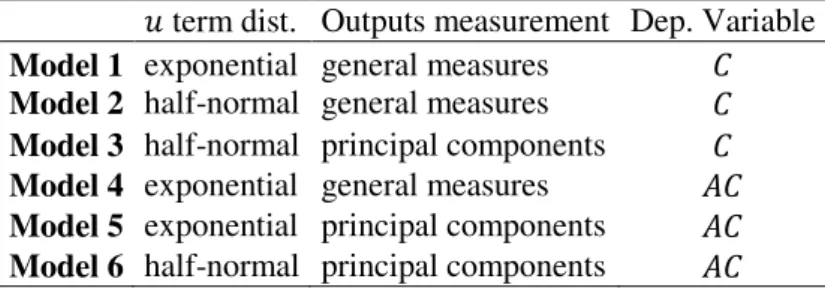
It should be noted that different model specifications provide similar results in terms of both efficiency scores and ranking positions. Other cost frontiers with different specifications regarding (1) the distribution of the inefficiency term , (2) the way output is measureda and (3) the dependent variable used were also estimated. Table 9 summarises these other model specifications. The Pearson correlation coefficient of the
aThis refers to using either the principal components of and or the
“general measures”, i.e. just the number of home visits made by nurses and consultations with doctors.
0
2
4
6
.5 .6 .7 .8 .9 1
19 efficiency measure
and of the ranking positions across the various models was computed (Table 10 and Table 11) and provides strong evidence of the robustness of the efficiency scores obtained with the stochastic frontier in Equation 7.
Table 9: Specification of alternatives cost frontier models term dist. Outputs measurement Dep. Variable
Model 1 Model 2 exponential half-normal general measures general measures
Model 3 half-normal principal components
Model 4 exponential general measures
Model 5 exponential principal components
Model 6 half-normal principal components
Table 10: Correlation across different models regarding efficiency scores
Equation 7 Model 1 Model 2 Model 3 Model 4 Model 5 Model 6
Equation 7 1.0000
Model 1 0.8074 1.0000
Model 2 0.6965 0.9198 1.0000
Model 3 0.9643 0.7968 0.7670 1.0000
Model 4 0.7484 0.8345 0.5927 0.6568 1.0000
Model 5 0.9105 0.7225 0.5013 0.8100 0.8684 1.0000
Model 6 0.9049 0.6967 0.5264 0.8612 0.8310 0.9632 1.0000
Table 11: Correlation across different models regarding ranking positions of FHUs
Equation 7 Model 1 Model 2 Model 3 Model 4 Model 5 Model 6
Equation 7 Model 1 Model 2 Model 3 Model 4 Model 5 Model 6 1.0000 0.7723 0.7172 0.9859 0.6994 0.8852 0.8834 1.0000 0.9809 0.7843 0.8305 0.6402 0.6623 1.0000 0.7394 0.7592 0.5598 0.5866 1.0000 0.6847 0.8572 0.8740 1.0000 0.7904 0.8066 1.0000
0.9858 1.0000
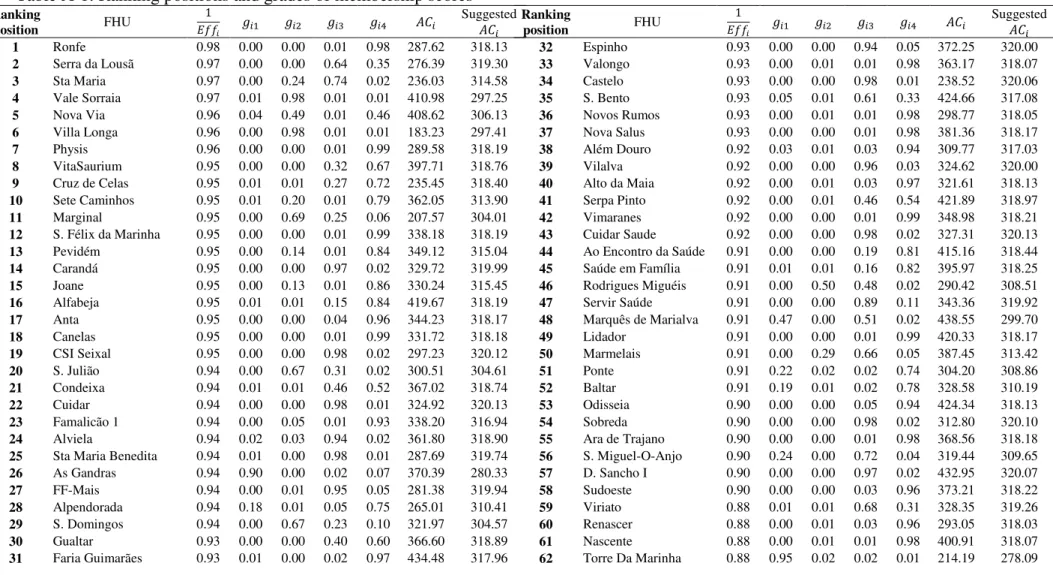
B. Benchmarking for family health units: The grades of membership approach The maximisation of the unconditional likelihood in Equation 6 delivers the grades of membership estimates for each FHU under observation for .
As to the establishment of benchmarks, both efficiency scores
20 appendix). FHUs are ordered based on their ranking positions regarding efficiency scores. The most efficient FHUs within the th group (i.e. presenting ) can be thought of as reference units in terms of extreme profiles and each one of them is referred to as , b.
As to recommendations for performance improvement, one will have: (10)
for each and
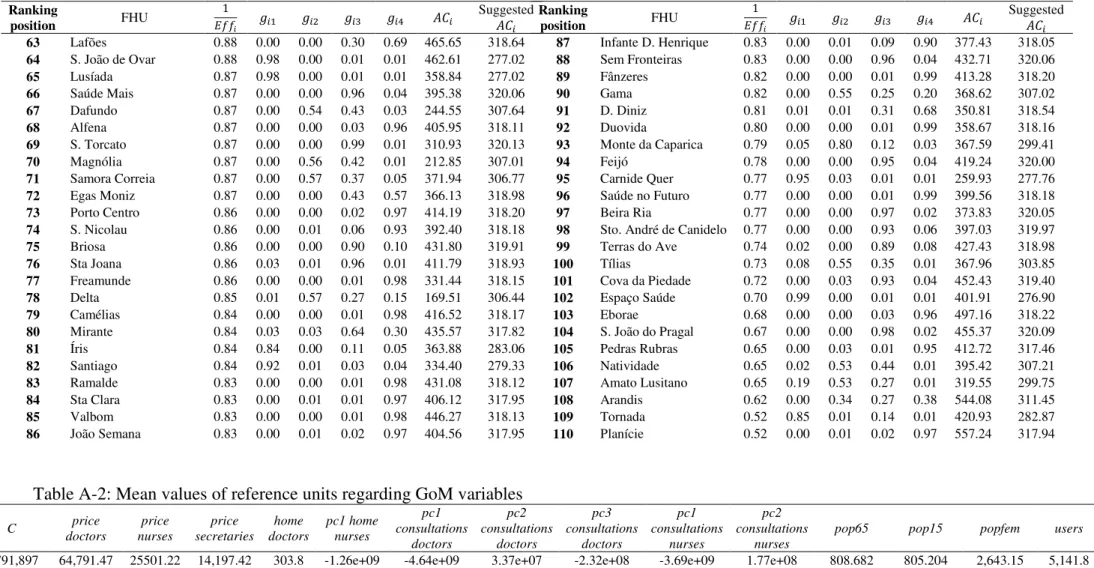
where is a specific value for each FHU to achieve in terms of variable . Table A-1 also provides an application of the above instructions to average user costs, allowing for comparison to be made between suggested and actual . Table A-2 presents the averages of the reference units of each group for the GoM variables. One can generally refer to groups and as representative of the outliers, i.e. FHUs of very small and large dimension, respectively. Group corresponds to median-sized FHUs and serves as reference for FHUs around the 75th percentile in terms of size. It should also be noted that reference units belonging to and
(i.e. above average dimension FHUs) are all type B and the remaining are mostly type A.
Table 12: FHUs set as reference units
As Gandras Vale Sorraia Carandá Ronfe Torre da Marinha Villa Longa CSI Seixal Physis
S. João de Ovar Cuidar S. Félix da Marinha
Lusíada Alviela Anta
Santiago Santa Maria Benedita Canelas
b is set equal to 5 for all groups, except for group , for which . This is so because there are
21 V. Discussion
This work aims at ranking family health units in terms of cost efficiency and at establishing benchmarks. The definition of concrete targets to achieve, are delivered as the final output of this work, which should help FHUs enhance their performance in terms of cost efficiency. This can be thought of as a valuable instrument in the context of an increasing proportion of national income being devoted to health expenditures. Caution should however be exercised when following these benchmarks: Both the stochastic frontier that was estimated (used to rank family health units) and the grades of membership approach (used to set the reference units and to establish benchmarks in the form of goals in terms of performance) present some limitations.
As to SFA, the effect of part of the variables explaining costs is not significantly different from zero, meaning that the use of other independent variables might alter results regarding the inefficiency term (and, as a consequence, affect efficiency scores and ranking positions). On the GoM approach, the choice regarding the division of variables into classes is an arbitrary one. Division into different intervals might be specified instead and would most likely affect the grades of membership scores. Also, the statistical programme used does not allow testing for the optimal number of extreme profiles.
22 References
Administração Central do Sistema de Saúde. 2010. Cuidados de saúde primários 2011: Metodologia de contratualização. Author.
Barros, Pedro P., and Jorge A. Simões. 2007. Portugal: Health system review. Health Systems in Transition, 9 (5).
Erosheva, Elena A., Stephen E. Fienberg and Cyrille Joutard. 2007. “Describing disability through individual-level mixture models for multivariate binary data.” The Annals of Applied Statistics, 1: 502-537.
Giuffrida, Antonio, and Hugh Gravelle. 1999. “Measuring performance in primary care: Econometric analysis and DEA.” The University of York Discussion Papers in
Economics 1999/36.
Greene, William H. 2006. “The econometric approach to efficiency analysis.” In The Measurement of Productive Efficiency: Techniques and Applications, ed. Harold O. Fried, Shelton S. Schmidt and C. A. K. Lovell, 92-250. Oxford: Oxford University Press, (Orig. pub. 1993).
Hollingsworth, Bruce. 2008. “The measurement of efficiency and productivity of health care delivery.” Health Economics, 17: 1107-1128.
23 Jacobs, Rowena, Peter. C. Schmidt and Andrew Street. 2006. Measuring Efficiency in Health Care: Analytic Techniques and Health Policy. Cambridge: Cambridge University Press.
Jondrow, James, C. A. K. Lovell, Ivan S. Materov and Peter Schmidt. 1982. “On the estimation of technical inefficiency in the stochastic frontier production function model.” Journal of Econometrics, 19: 233-238.
Lovell, C. A. K. 2006. “Frontier analysis in healthcare.” International Journal of Healthcare Technology and Management, 7: 5-14.
Manton, Kenneth G., Max A. Woodbury and H. D. Tolley. 1994. Statistical Applications Using Fuzzy Sets. New York: John Wiley & Sons.
McNamee, Paul.“A comparison of the grade of membership measure with alternative health indicators in explaining costs for older people.” 2004. Health Economics, 13: 379-395.
Missão para os Cuidados de Saúde Primários (MCSP). 2006. Linhas de acção prioritária para o desenvolvimento dos Cuidados de Saúde Primários. Lisbon: Author.
MCSP. 2008. Unidades de Saúde Familiar, Modelos Organizacionais. Lisbon: Author. Retrieved from http://www.mcsp.min-saude.pt/engine.php?cat=45&area=0
Moshiri, Hossein, Syed M. Aljunid, and Rahmah M. Amin. 2010. “Hospital and efficiency: Concept, measurement techniques and review of hospital efficiency studies.”
24 Murillo-Zamorano, Luis R., and Carmelo Petraglia. 2008. “Technical efficiency in primary health care: Does quality matter?” Munich Personal RePEc Archive 10725.
Portrait, France, Maarten Lindeboom and Dorly Degg. 1999. “Health and mortality of the elderly: The grade of membership method, classification and determination.” Health Economics, 8: 441-457.
Puig-Junoy, Jaume, and Vicente Ortún. 2004. “Cost efficiency in primary care contracting: A stochastic frontier cost function approach.” Health Economics, 13:
1149-1165.
Seplaki, Christopher L., Noreen Goldman, Maxine Weinstein and Yu-Hsuan Lin. 2004. “Measurement of cumulative physiological dysregulation in and older population.” Office of Population Research Princeton University Working Paper No.
2004-02.
Starfield, Barbara, Leiyu Shi, and James Macinko. 2005. “Contribution of primary care to health systems and health.” The Milbank Quarterly, 83: 457-502.
Street, Andrew. 2003. “How much confidence should we place in efficiency estimates?” Health Economics, 12: 895-907.
Woodbury, Max A., and Jonathan Clive. 1974. “Clinical pure types as a fuzzy partition.” Journal of Cybernetics, 4: 111-121.
26 Appendix
Table A-1: Ranking positions and grades of membership scores Ranking
position FHU
Suggested 1 Ronfe 0.98 0.00 0.00 0.01 0.98 287.62 318.13 2 Serra da Lousã 0.97 0.00 0.00 0.64 0.35 276.39 319.30 3 Sta Maria 0.97 0.00 0.24 0.74 0.02 236.03 314.58 4 Vale Sorraia 0.97 0.01 0.98 0.01 0.01 410.98 297.25 5 Nova Via 0.96 0.04 0.49 0.01 0.46 408.62 306.13 6 Villa Longa 0.96 0.00 0.98 0.01 0.01 183.23 297.41 7 Physis 0.96 0.00 0.00 0.01 0.99 289.58 318.19 8 VitaSaurium 0.95 0.00 0.00 0.32 0.67 397.71 318.76 9 Cruz de Celas 0.95 0.01 0.01 0.27 0.72 235.45 318.40 10 Sete Caminhos 0.95 0.01 0.20 0.01 0.79 362.05 313.90 11 Marginal 0.95 0.00 0.69 0.25 0.06 207.57 304.01 12 S. Félix da Marinha 0.95 0.00 0.00 0.01 0.99 338.18 318.19 13 Pevidém 0.95 0.00 0.14 0.01 0.84 349.12 315.04 14 Carandá 0.95 0.00 0.00 0.97 0.02 329.72 319.99 15 Joane 0.95 0.00 0.13 0.01 0.86 330.24 315.45 16 Alfabeja 0.95 0.01 0.01 0.15 0.84 419.67 318.19 17 Anta 0.95 0.00 0.00 0.04 0.96 344.23 318.17 18 Canelas 0.95 0.00 0.00 0.01 0.99 331.72 318.18 19 CSI Seixal 0.95 0.00 0.00 0.98 0.02 297.23 320.12 20 S. Julião 0.94 0.00 0.67 0.31 0.02 300.51 304.61 21 Condeixa 0.94 0.01 0.01 0.46 0.52 367.02 318.74 22 Cuidar 0.94 0.00 0.00 0.98 0.01 324.92 320.13 23 Famalicão 1 0.94 0.00 0.05 0.01 0.93 338.20 316.94 24 Alviela 0.94 0.02 0.03 0.94 0.02 361.80 318.90 25 Sta Maria Benedita 0.94 0.01 0.00 0.98 0.01 287.69 319.74 26 As Gandras 0.94 0.90 0.00 0.02 0.07 370.39 280.33 27 FF-Mais 0.94 0.00 0.01 0.95 0.05 281.38 319.94 28 Alpendorada 0.94 0.18 0.01 0.05 0.75 265.01 310.41 29 S. Domingos 0.94 0.00 0.67 0.23 0.10 321.97 304.57 30 Gualtar 0.93 0.00 0.00 0.40 0.60 366.60 318.89 31 Faria Guimarães 0.93 0.01 0.00 0.02 0.97 434.48 317.96
Ranking
position FHU
27 Ranking
position FHU
Suggested 63 Lafões 0.88 0.00 0.00 0.30 0.69 465.65 318.64 64 S. João de Ovar 0.88 0.98 0.00 0.01 0.01 462.61 277.02 65 Lusíada 0.87 0.98 0.00 0.01 0.01 358.84 277.02 66 Saúde Mais 0.87 0.00 0.00 0.96 0.04 395.38 320.06 67 Dafundo 0.87 0.00 0.54 0.43 0.03 244.55 307.64 68 Alfena 0.87 0.00 0.00 0.03 0.96 405.95 318.11 69 S. Torcato 0.87 0.00 0.00 0.99 0.01 310.93 320.13 70 Magnólia 0.87 0.00 0.56 0.42 0.01 212.85 307.01 71 Samora Correia 0.87 0.00 0.57 0.37 0.05 371.94 306.77 72 Egas Moniz 0.87 0.00 0.00 0.43 0.57 366.13 318.98 73 Porto Centro 0.86 0.00 0.00 0.02 0.97 414.19 318.20 74 S. Nicolau 0.86 0.00 0.01 0.06 0.93 392.40 318.18 75 Briosa 0.86 0.00 0.00 0.90 0.10 431.80 319.91 76 Sta Joana 0.86 0.03 0.01 0.96 0.01 411.79 318.93 77 Freamunde 0.86 0.00 0.00 0.01 0.98 331.44 318.15 78 Delta 0.85 0.01 0.57 0.27 0.15 169.51 306.44 79 Camélias 0.84 0.00 0.00 0.01 0.98 416.52 318.17 80 Mirante 0.84 0.03 0.03 0.64 0.30 435.57 317.82 81 Íris 0.84 0.84 0.00 0.11 0.05 363.88 283.06 82 Santiago 0.84 0.92 0.01 0.03 0.04 334.40 279.33 83 Ramalde 0.83 0.00 0.00 0.01 0.98 431.08 318.12 84 Sta Clara 0.83 0.00 0.01 0.01 0.97 406.12 317.95 85 Valbom 0.83 0.00 0.00 0.01 0.98 446.27 318.13 86 João Semana 0.83 0.00 0.01 0.02 0.97 404.56 317.95
Ranking
position FHU
Suggested 87 Infante D. Henrique 0.83 0.00 0.01 0.09 0.90 377.43 318.05 88 Sem Fronteiras 0.83 0.00 0.00 0.96 0.04 432.71 320.06 89 Fânzeres 0.82 0.00 0.00 0.01 0.99 413.28 318.20 90 Gama 0.82 0.00 0.55 0.25 0.20 368.62 307.02 91 D. Diniz 0.81 0.01 0.01 0.31 0.68 350.81 318.54 92 Duovida 0.80 0.00 0.00 0.01 0.99 358.67 318.16 93 Monte da Caparica 0.79 0.05 0.80 0.12 0.03 367.59 299.41 94 Feijó 0.78 0.00 0.00 0.95 0.04 419.24 320.00 95 Carnide Quer 0.77 0.95 0.03 0.01 0.01 259.93 277.76 96 Saúde no Futuro 0.77 0.00 0.00 0.01 0.99 399.56 318.18 97 Beira Ria 0.77 0.00 0.00 0.97 0.02 373.83 320.05 98 Sto. André de Canidelo 0.77 0.00 0.00 0.93 0.06 397.03 319.97 99 Terras do Ave 0.74 0.02 0.00 0.89 0.08 427.43 318.98 100 Tílias 0.73 0.08 0.55 0.35 0.01 367.96 303.85 101 Cova da Piedade 0.72 0.00 0.03 0.93 0.04 452.43 319.40 102 Espaço Saúde 0.70 0.99 0.00 0.01 0.01 401.91 276.90 103 Eborae 0.68 0.00 0.00 0.03 0.96 497.16 318.22 104 S. João do Pragal 0.67 0.00 0.00 0.98 0.02 455.37 320.09 105 Pedras Rubras 0.65 0.00 0.03 0.01 0.95 412.72 317.46 106 Natividade 0.65 0.02 0.53 0.44 0.01 395.42 307.21 107 Amato Lusitano 0.65 0.19 0.53 0.27 0.01 319.55 299.75 108 Arandis 0.62 0.00 0.34 0.27 0.38 544.08 311.45 109 Tornada 0.52 0.85 0.01 0.14 0.01 420.93 282.87 110 Planície 0.52 0.00 0.01 0.02 0.97 557.24 317.94
Table A-2: Mean values of reference units regarding GoM variables
C price
doctors price nurses price secretaries home doctors pc1 home nurses pc1 consultations doctors pc2 consultations doctors pc3 consultations doctors pc1 consultations nurses pc2 consultations nurses
pop65 pop15 popfem users teams