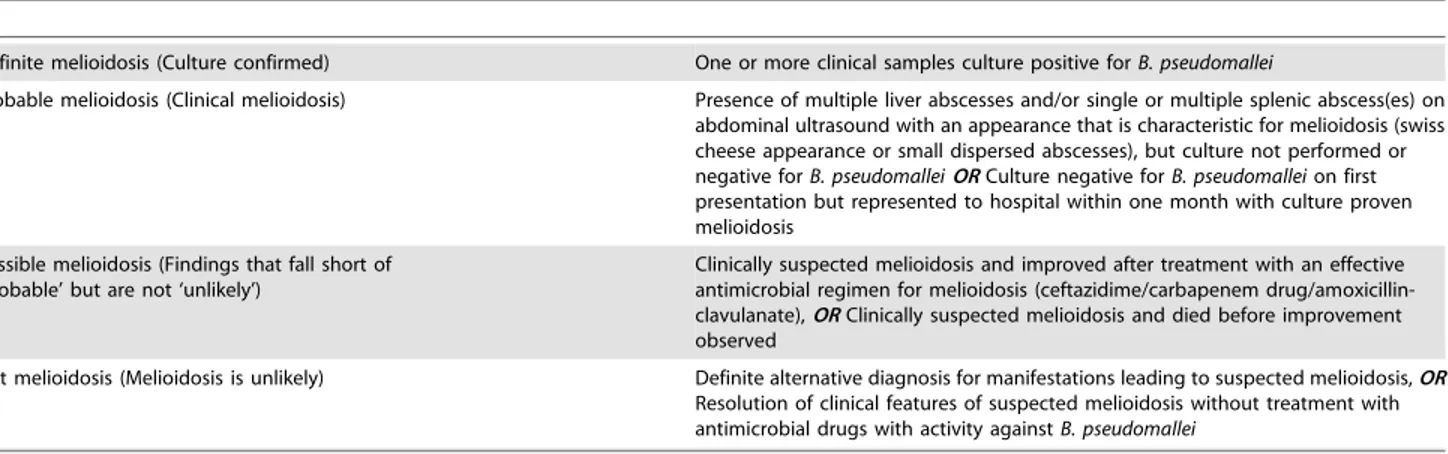
Defining the true sensitivity of culture for the diagnosis of melioidosis using Bayesian latent class models.
Texto
Imagem
Documentos relacionados
The probability of attending school four our group of interest in this region increased by 6.5 percentage points after the expansion of the Bolsa Família program in 2007 and
Há evidências que esta técnica, quando aplicada no músculo esquelético, induz uma resposta reflexa nomeada por reflexo vibração tônica (RVT), que se assemelha
Objective: To understand how elderly persons perceive subjective aspects linked to current and other life experiences related to the process of becoming frail. Method: A qualitative
We therefore examined the clinical course of patients admitted to hospital with 2009 pandemic influenza A(H1N1), who were or weren’t taking statins at time of admission.. Methods:
The structure of the remelting zone of the steel C90 steel be- fore conventional tempering consitute cells, dendritic cells, sur- rounded with the cementite, inside of
H„ autores que preferem excluir dos estudos de prevalˆncia lesŽes associadas a dentes restaurados para evitar confus‚o de diagn€stico com lesŽes de
Ousasse apontar algumas hipóteses para a solução desse problema público a partir do exposto dos autores usados como base para fundamentação teórica, da análise dos dados
(1984) analisando povoamentos de Eucalyptus saligna, aos 8 e 9 anos de idade, respectivamente, verificaram que em média 85% da biomassa aérea encontrava- se no fuste (madeira
