www.atmos-chem-phys.net/9/2597/2009/ © Author(s) 2009. This work is distributed under the Creative Commons Attribution 3.0 License.
Chemistry
and Physics
Elemental content of PM
2
.
5
aerosol particles collected in G¨oteborg
during the G¨ote-2005 campaign in February 2005
J. Boman1, M. J. Gatari2, S. Janh¨all1,*, A. S. Shannigrahi1, and A. Wagner1,**
1Department of Chemistry, Atmospheric science, University of G¨oteborg, 412 96 G¨oteborg, Sweden
2Institute of Nuclear Science and Technology, University of Nairobi, P.O. Box 30179-00100, Nairobi, Kenya *now at: Max Planck Institute for Chemistry, Dept. Biogeochemistry, J.-J.-Becherweg 27, 55128 Mainz, Germany **now at: Department of Applied Physics, Condensed matter physics, Chalmers University of Technology, 412 96 G¨oteborg, Sweden
Received: 3 January 2008 – Published in Atmos. Chem. Phys. Discuss.: 18 April 2008 Revised: 16 December 2008 – Accepted: 31 March 2009 – Published: 9 April 2009
Abstract. The G¨ote–2005 measurement campaign aimed at studying the influence of the winter thermal inversions on urban air pollution. Elemental speciation of PM2.5 aerosol
particles, collected on Teflon filters at three urban sites and one rural site in the G¨oteborg region, was a major part of the study. Trace element analysis was done by Energy Dis-persive X-Ray Fluorescence (EDXRF) spectrometry and the concentrations of S, Cl, K, Ca, Ti, V, Mn, Fe, Ni, Cu, Zn, Br and Pb were determined. The elemental content of the par-ticles, local wind speed and direction, and backward trajec-tories were used to investigate possible sources for the pol-lutants. We concluded that S, V, Ni, Br, and Pb had their main sources outside the central G¨oteborg area, since ele-vated concentrations of these elements were not observed during an inversion episode. Sea traffic and harbour activ-ities were identified, primarily by the S and V content of the particles. This study showed that the elemental analysis by EDXRF presents valuable information for tracing the origin of air masses arriving at a measurement site.
1 Introduction
Air pollution in urban environments is a major problem to human health. This has forced governments to invoke regu-lations controlling pollution in an effort to protect their citi-zens. The control is achieved through the provision and im-plementation of air quality standards that address the con-centrations of the criteria pollutants above which harm to
Correspondence to:J. Boman ([email protected])
human health may occur. Particulate matter is one of these criteria pollutants which attract increasing global attention. The environmental quality standards for particulate matter that are stipulated for the European Union (European Union, 1999) are hard to follow in many large cities (Baldasano et al., 2003). This is the case for G¨oteborg, Sweden, where the measurement campaign presented here was carried out in February 2005. The air quality standard, derived from the regulations in chapter 5 of the Swedish environmental code is based on the EU directive 1996/62/EC and its daugh-ter directives. It stipulates the average annual concentration of PM10 to be below 40µg m−3 with a 24 h limit value of 50µg m−3. This annual threshold is expected to be reduced to 20µg m−3by the year 2010. The continued use of PM10, an integrative measure of particle mass concentration, as a criteria pollutant is under discussion since new norms based on particles of aerodynamic diameter smaller than 2.5µm (PM2.5) are impending (European Union, 1999). The shift
in concern is motivated by the higher anthropogenic input to PM2.5mass concentration compared to the input from natural
sources and their ability to be transported over long distances thus influencing a larger part of the population. The capabil-ity of atmospheric wind systems to transport PM2.5aerosol
0.0 1.0 2.0 3.0 4.0 5.0 6.0 7.0 8.0 9.0 10.0 2/3/20 05 2/4/20 05 2/5/2 005 2/6/20 05 2/7/20 05 2/8/20 05 2/9/2 005 2/10/2 005 2/11/2 005 2/12/2 005 2/13/ 200 5 2/14/2 005 2/15/2 005 2/16/2 005 2/17/2 005 2/18/ 200 5 2/19/2 005 2/20/2 005 2/21/ 200 5 2/22/2 005 2/23/2 005 2/24/2 005 2/25/2 005 2/26/ 200 5 2/27/2 005 2/28/2 005 3/1/20 05 3/2/2 005 3/3/2 005 3/4/20 05 Date Win d s p
eed (m s-1
) 0.0 90.0 180.0 270.0 360.0 Wi nd di rec ti on (de g rees ) Wind speed Wind direction
Fig. 1.The average wind speed (m s−1) and wind direction (degrees) for the measurement period calculated from noon each day. The day indicated in the figure the date as when the filters were collected. 0 (and 360) degrees represents wind coming from north, 90 degrees is east, 180 degrees south and 270 degrees is westerly winds.
N
1 km
Lipstick
Femman
Campus
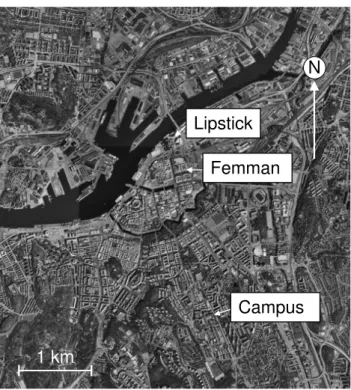
Fig. 2.Map showing the location of the urban measurement sites in G¨oteborg, Sweden.
parameter, PM10or PM2.5, is not easy to use for source
ap-portionment. Consequently, a more detailed knowledge of the constituents of the particles is of great value (Ariola et al., 2006; Artinano et al., 2004; Chow and Watson, 2002;
Moln´ar et al., 2006). The measurements of the current study were part of a four week winter air pollution measurement campaign, G¨ote–2005, conducted in G¨oteborg, Sweden. The focus of these measurements was to describe the trace ele-ment content of PM2.5particles in G¨oteborg, the influence
of temperature inversions on particle mass concentration and composition, and possible sources of the trace elements in the particles.
2 Site description and experimental details
the year and precipitation is frequent but not heavy. Febru-ary is normally a cold winter month in G¨oteborg and in 2005 the temperature varied between −9.1◦C and +7.3◦C with an average temperature of −0.6◦C. Part of the mea-surement period was windy as several low pressure systems passed G¨oteborg. The wind was easterly or north-north-easterly (Fig. 1) for 40% of the campaign period. The average wind speed and wind direction for the measurement period were calculated from noon each day to match the fil-ter changing time of the PM2.5samples. The indicated date
in the figure is the date when sample/fresh filters were col-lected/loaded. PM2.5 particles were collected at three sites,
Femman, Campus and Lipstick (Fig. 2), representing differ-ent urban conditions, and at one rural site, R˚a¨o. All these sampling sites were located in places without point sources in the near vicinity.
The Femman site was placed on the roof of a commercial complex located in the busy centre of G¨oteborg. The site is the main monitoring station for air quality in the city and it is maintained by the local environmental office in G¨oteborg since 1965. It was chosen as an urban background site. The sampler was positioned approximately 30 meters above ground. Aerosol samples were collected between 4 Febru-ary and 3 March 2005 at this site. The Chalmers Campus area is situated 2 km south of the city centre. The area repre-sents a less busy area which is traversed by a yearly average of 8000 vehicles per day. The Campus sampling site was located approximately 10 m above ground level, 50 m above sea level and 20 m from the street. Aerosol sampling took place between 7 and 28 February 2005 at this site. The Lip-stick building is located on sea level 500 m north-north east of the Femman site, in the docklands in the central parts of G¨oteborg. The sampling site was located 88 m above ground level. This site was selected with the expectation that it would be above low level inversions. Aerosol samples were collected between 17 and 26 February 2005 at this site. The rural sampling site was at R˚a¨o (57.41◦N; 11.93◦E) which is located 35 km south of G¨oteborg. It was close to the sea a few meters above sea level. The sampler had its inlet ap-proximately 1.5 m above ground and aerosol samples were collected between 11 and 26 February.
Particle collection was done on 25 mm diameter Teflon filters with a pore size of 3µm (PALL TefloTM R2PI025) using plastic cyclones (Casella Ltd, UK). The flow through the cyclone was kept constant by a critical orifice to main-tain a particle cut off diameter of 2.5µm. Samples were changed at noon on a daily basis, except at R˚a¨o where sam-ples were changed at an interval of four to seven days due to the expected low particle concentrations at the site. The me-teorological information during the measurement campaign period was obtained from the local environmental office in G¨oteborg.
All obtained samples were analyzed for their elemental content by Energy Dispersive X-Ray Fluorescence (EDXRF) spectrometry (Van Grieken and Markowicz, 1993). The
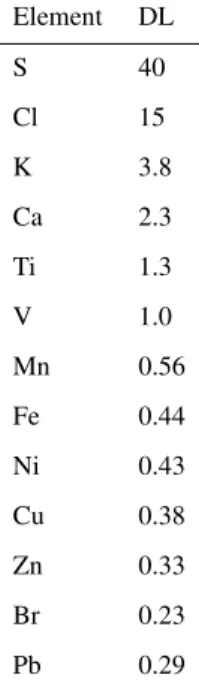
Table 1.Detection limits (DL) in ng m−3for the analysed elements.
Element DL S 40 Cl 15 K 3.8 Ca 2.3 Ti 1.3 V 1.0 Mn 0.56 Fe 0.44 Ni 0.43 Cu 0.38 Zn 0.33 Br 0.23 Pb 0.29
spectrometer is based on three-axial geometry with a Mo sec-ondary target that facilitates a good signal to background ra-tio giving low detecra-tion limits, Table 1. The spectrometer was operated at 55 kV and 25 mA and the samples were ana-lyzed for 1000 s (Boman et al., 2005; Gatari et al., 2006). For calibration of the spectrometer, thin film standards with spec-ified uncertainty of 5% in the elemental concentration were used (Micromatter Inc., Seattle, WA, USA). By repeatedly (five times) analysing two aerosol filter samples the mean analytical precision of the spectrometer was determined to be 5% (Moln´ar et al., 2006). Spectral evaluation was done with the AXIL software program (Bernasconi et al., 2000). A Dionex Ion Chromatograph was used to analyse the SO2−4 content in the samples collected at the three urban sites be-tween 17 and 26 February (Janh¨all et al., 2003). The anal-ysis was done using IONPAC A59-S as analytical column with a 1.8 mM Na2CO3/1.7 mM NaHCO3 eluent at a flow of 2 ml m−1for conductivity detection. The determination of particle mass on the filters was done by a Mettler Toledo MT5 micro balance.
3 Results and discussion
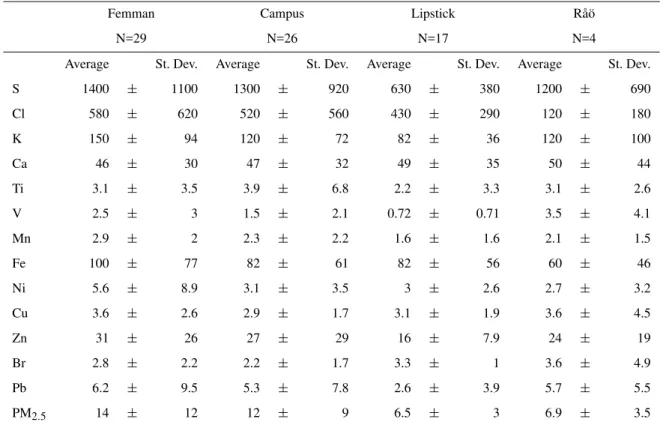
Table 2. Full campaign concentration averages with standard deviations (St. Dev.) in ng m−3for the analysed elements and the PM2.5
mass concentrations at the four sites. Sampling period at Femman was between 4 February and 3 March 2005, at Campus between 7 to 28 February, at the Lipstick site between 17 to 26 February and at R˚a¨o between 11 and 26 February. PM2.5concentration is given inµg m−3.
Concentrations below detection limit (DL) have been replaced by DL/2 in the statistical calculations. N=Number of filter samples collected.
Femman Campus Lipstick R˚a¨o
N=29 N=26 N=17 N=4
Average St. Dev. Average St. Dev. Average St. Dev. Average St. Dev. S 1400 ± 1100 1300 ± 920 630 ± 380 1200 ± 690 Cl 580 ± 620 520 ± 560 430 ± 290 120 ± 180 K 150 ± 94 120 ± 72 82 ± 36 120 ± 100 Ca 46 ± 30 47 ± 32 49 ± 35 50 ± 44 Ti 3.1 ± 3.5 3.9 ± 6.8 2.2 ± 3.3 3.1 ± 2.6 V 2.5 ± 3 1.5 ± 2.1 0.72 ± 0.71 3.5 ± 4.1 Mn 2.9 ± 2 2.3 ± 2.2 1.6 ± 1.6 2.1 ± 1.5 Fe 100 ± 77 82 ± 61 82 ± 56 60 ± 46 Ni 5.6 ± 8.9 3.1 ± 3.5 3 ± 2.6 2.7 ± 3.2 Cu 3.6 ± 2.6 2.9 ± 1.7 3.1 ± 1.9 3.6 ± 4.5 Zn 31 ± 26 27 ± 29 16 ± 7.9 24 ± 19 Br 2.8 ± 2.2 2.2 ± 1.7 3.3 ± 1 3.6 ± 4.9 Pb 6.2 ± 9.5 5.3 ± 7.8 2.6 ± 3.9 5.7 ± 5.5 PM2.5 14 ± 12 12 ± 9 6.5 ± 3 6.9 ± 3.5
0 50 100 150 200 250 300 350 400
2/4/2005 2/11/2005 2/18/2005 2/25/2005
0 500 1000 1500 2000 2500 3000 3500 4000 4500 5000
Fe S
Eastern Europe
Shipping
Baltic region Atlantic
Finland
Russia
Northern Scandinavia Inversion
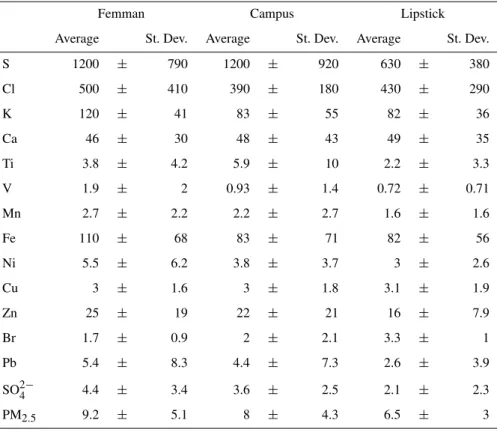
Table 3. Simultaneous sampling period 17–26 February concentration averages with standard deviations (St. Dev.) in ng m−3for the analysed elements, SO24−and the PM2.5mass concentrations at the three city sites. SO
2−
4 and PM2.5mass concentration is given inµg
m−3. Concentrations below detection limit (DL) have been replaced by DL/2 in the statistical calculations.
Femman Campus Lipstick Average St. Dev. Average St. Dev. Average St. Dev. S 1200 ± 790 1200 ± 920 630 ± 380 Cl 500 ± 410 390 ± 180 430 ± 290 K 120 ± 41 83 ± 55 82 ± 36 Ca 46 ± 30 48 ± 43 49 ± 35 Ti 3.8 ± 4.2 5.9 ± 10 2.2 ± 3.3 V 1.9 ± 2 0.93 ± 1.4 0.72 ± 0.71 Mn 2.7 ± 2.2 2.2 ± 2.7 1.6 ± 1.6 Fe 110 ± 68 83 ± 71 82 ± 56 Ni 5.5 ± 6.2 3.8 ± 3.7 3 ± 2.6 Cu 3 ± 1.6 3 ± 1.8 3.1 ± 1.9 Zn 25 ± 19 22 ± 21 16 ± 7.9 Br 1.7 ± 0.9 2 ± 2.1 3.3 ± 1 Pb 5.4 ± 8.3 4.4 ± 7.3 2.6 ± 3.9 SO24− 4.4 ± 3.4 3.6 ± 2.5 2.1 ± 2.3 PM2.5 9.2 ± 5.1 8 ± 4.3 6.5 ± 3
variations induced by meteorological conditions, sampling variations and analytical uncertainties in the EDXRF evalua-tion of the elements. PM2.5mass concentrations inµg m−3
are also included in Table 2. The concentrations for most el-ements were above the detection limit (DL) in a majority of the samples. In the cases where concentrations were below DL the elemental concentration was represented by DL/2 in the statistical calculations (Hornung and Reed, 1990). The entry<DL in the tables indicates that more than half of the samples had concentrations below DL. Table 3 shows con-centrations from samples collected over the period 17 to 26 February 2005. The samples were collected simultaneously at the three measurement sites in the city and are presented to facilitate comparison between them. The Teflon filters used in the measurement campaign were the optimum choice for EDXRF analysis but not ideal for ion chromatography, thus the SO24−determinations have higher uncertainties, assessed to be 15%.
For most of the elements in Table 2 the difference be-tween average concentrations from the four sampling sites was small and within a factor of two. However, the daily concentrations of different elements were highly variable and this was mainly due to different weather conditions, as
indi-cated by the high standard deviations in Tables 2 and 3 and the varying concentrations of sulphur at the Femman mea-surement site. This is illustrated in Fig. 3.
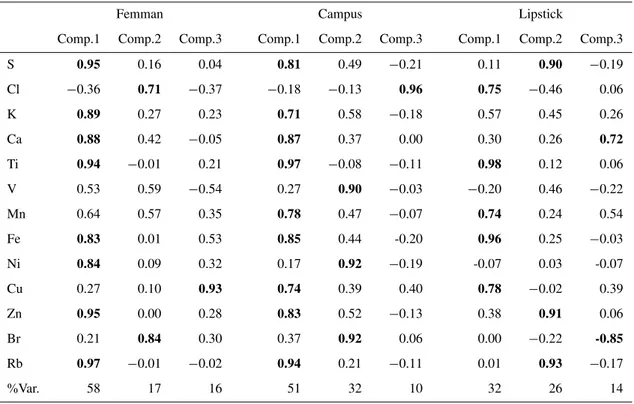
Table 4.The three main components of the Principal Component Analysis of the elemental concentrations at the three city sites during 17–26 February. The results are Varimax rotated with Kaiser normalization. Elemental component contributions higher than 0.7 are indicated in bold. %Var. is the percentage explained by the component.
Femman Campus Lipstick
Comp.1 Comp.2 Comp.3 Comp.1 Comp.2 Comp.3 Comp.1 Comp.2 Comp.3 S 0.95 0.16 0.04 0.81 0.49 −0.21 0.11 0.90 −0.19 Cl −0.36 0.71 −0.37 −0.18 −0.13 0.96 0.75 −0.46 0.06 K 0.89 0.27 0.23 0.71 0.58 −0.18 0.57 0.45 0.26 Ca 0.88 0.42 −0.05 0.87 0.37 0.00 0.30 0.26 0.72
Ti 0.94 −0.01 0.21 0.97 −0.08 −0.11 0.98 0.12 0.06 V 0.53 0.59 −0.54 0.27 0.90 −0.03 −0.20 0.46 −0.22 Mn 0.64 0.57 0.35 0.78 0.47 −0.07 0.74 0.24 0.54 Fe 0.83 0.01 0.53 0.85 0.44 -0.20 0.96 0.25 −0.03 Ni 0.84 0.09 0.32 0.17 0.92 −0.19 -0.07 0.03 -0.07 Cu 0.27 0.10 0.93 0.74 0.39 0.40 0.78 −0.02 0.39 Zn 0.95 0.00 0.28 0.83 0.52 −0.13 0.38 0.91 0.06
Br 0.21 0.84 0.30 0.37 0.92 0.06 0.00 −0.22 -0.85
Rb 0.97 −0.01 −0.02 0.94 0.21 −0.11 0.01 0.93 −0.17
%Var. 58 17 16 51 32 10 32 26 14
of G¨oteborg in 1999 to investigate the vertical distribution of different air pollutants. Although Total Suspended Particles (TSP) were measured the concentrations of S and Pb were only slightly higher than the ones measured in this study. This reinforces their conclusion that S and Pb are mainly in PM2.5and thus can be transported over long distances.
Implications of emissions from sea traffic and harbour activities were found on 4 and 5 February. These days the S concentrations were high, reaching 2600 ng m−3 and 1900 ng m−3 at Femman and Campus, respectively. The back trajectories indicated that the air masses passed over the North Sea, UK, and Denmark before reaching G¨oteborg. The high S concentration might have originated from ship emissions, both in the vicinity of G¨oteborg and on the North Sea. G¨oteborg hosts the largest port within the Nordic coun-tries and the international sea traffic is allowed to use fuels with high S content. The V and Ni concentrations were also high, 8.9 and 6.8 ng m−3for V and 3.8 and 2.4 ng m−3for Ni at Femman and Campus, respectively, implicating the ship emissions as suggested in previous studies (Isakson et al., 2001; Moln´ar et al., 2006). With air arriving from south west, thus passing the harbour area, not only the human activities can be considered. There is also an input of sea salt particles containing sulphate compounds as well as Cl (Janenicke and Schutz, 1988). Although the majority of the sample mass
from sea salt particles is found in the larger fraction of the particle range, above PM2.5, an influence on PM2.5can also
be seen. P´erez et al. (2008) estimated that in Barcelona, also a sea side city, on an average 2% of the PM2.5 mass
was made up of particles from sea spray, compared to 5% in PM10. Negral et al. (2008) estimated the ratio between ma-rine and non-mama-rine SO24−to approximately 1:100 in PM2.5
aerosol particles collected in the coastal city of Cartagena, Spain. If a similar ratio is assumed for G¨oteborg the largest part of the measured S did not come from sea salt but from other sources, most likely ships passing outside G¨oteborg or manoeuvring in the harbour.
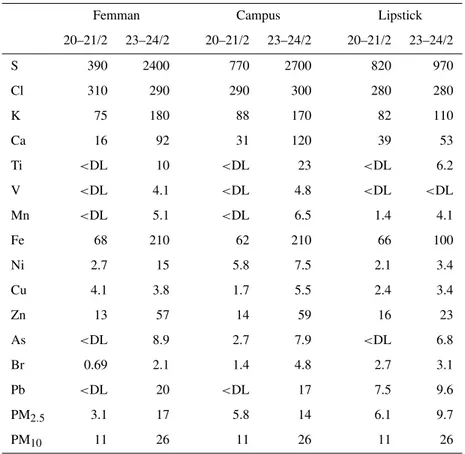
Table 5.Two days urban sampling comparison of average concentrations in ng m−3for the analysed elements.<DL means below detection
limit. PM2.5and PM10 mass concentrations are given inµg m−3. PM10 mass concentrations are from the local environmental office
(Brandberg, 2005).
Femman Campus Lipstick 20–21/2 23–24/2 20–21/2 23–24/2 20–21/2 23–24/2 S 390 2400 770 2700 820 970 Cl 310 290 290 300 280 280
K 75 180 88 170 82 110
Ca 16 92 31 120 39 53
Ti <DL 10 <DL 23 <DL 6.2
V <DL 4.1 <DL 4.8 <DL <DL
Mn <DL 5.1 <DL 6.5 1.4 4.1
Fe 68 210 62 210 66 100
Ni 2.7 15 5.8 7.5 2.1 3.4 Cu 4.1 3.8 1.7 5.5 2.4 3.4
Zn 13 57 14 59 16 23
As <DL 8.9 2.7 7.9 <DL 6.8
Br 0.69 2.1 1.4 4.8 2.7 3.1 Pb <DL 20 <DL 17 7.5 9.6
PM2.5 3.1 17 5.8 14 6.1 9.7
PM10 11 26 11 26 11 26
aerosol of mainly crustal origin. The second component at Femman contained Cl and Br, and could represent the influ-ence of sea spray, while the component represented by Cu, having the only high elemental load, could be a signature of non tailpipe emissions from traffic (Moln´ar et al., 2007). It was surprising to find high loading of V and Ni in the sec-ond component at Campus site, since V and Ni are tracers of heavy fuel oil combustion and thus could be assumed to influence the down town Femman site as well. Since Cl, that is known to be a signature element of sea salt, is in a compo-nent of its own at the Campus site, the high loadings of V, Ni and Br in component two might instead indicate the influence of combustion of heavy fossil fuels, from both sea traffic and Eastern Europe region. The wind direction during this period was dominated by north easterly winds, with westerly winds at the beginning of the period. At Femman a high loading of Ni was found in the first component while a moderately high loading of V was attributed to the second compound, indicating a more mixed aerosol at Femman. Factor analysis of PM2.5aerosol particles collected at the Campus area by Moloi et al. (2002) showed that most of the collected PM2.5
aerosol particles at that time came from sea spray and
indus-trial activities in the harbour area. That was characterised by Cl, Ni, and Br. The influence of vehicle emissions was also identified by the content of K, Cu, Zn and Pb in the same study.
speed thereafter decreased more of the air originated from the Baltic countries before coming from the northern part of Norway and Sweden on 26 February. The trace element data showed a general increase of many of the elemental concen-trations on 23 and 24 February compared to 20 and 21 Febru-ary as depicted by Fe and S in Fig. 3.
Despite the fact that the airborne particles were being col-lected over several days, the same trend of increasing ele-mental concentrations was seen in the data from R˚a¨o when samples collected between 14 and 21 February and the ones for 21 to 25 February were compared. An explanation is that there are more coarse particles in the air during the windy period and as a result more of them join the PM2.5fraction.
This phenomenon was shown in an investigation on effects of wind speed on the relation between particles of different sizes by Kim et al. (2005). If the elements Ca, Ti and Fe are used as indicators for particles with crustal origin, a high influence of crustal particles is seen during the windy days. The influence of crustal particles in the PM2.5particle range was also seen
by P´erez et al. (2008) in Barcelona, Spain. In comparison to the monthly average concentration of 20.5µg m−3recorded by the local environmental office, relatively high PM10 con-centrations that ranged between 21.5 and 33.6µg m−3were reported on the same days in February. The higher con-centrations of S, V, and Ni on 23 and 24 February were likely to originate from combustion processes in the eastern part of Europe where the air masses passed before reaching G¨oteborg. These elements are normally found in the fine particle fraction and can thus be transported long distances before the settling of the particles. The good correlation be-tween the S concentrations obtained from the EDXRF anal-ysis with the sulphate concentrations from the IC analanal-ysis (r2=0.96) implied that most of the measured particulate S was in the form of sulphate.
The higher Pb concentration during the windy days was likely due to particles originating from Eastern Europe. Al-though unleaded gasoline is used in all countries in the region (UNEP, 2006) lead is still dispersed in particles that are re-suspended by strong winds and traffic. Pb is also dispersed from the tail pipe systems of cars that previously used leaded fuel. Cl was the only element with stable concentration dur-ing the period 20 to 24 February, Table 5, indicatdur-ing little influence from sea salt and this agreed well with the wind direction over the period.
The night between the 27 and 28 February had a strong night inversion that was identified by Brandberg (2005) with a vertical temperature difference of + 0.2◦C m−1. The pos-itive vertical temperature difference was sustained for al-most 12 h. Despite the 24 h sampling period, covering more than the inversion episode, the increase in concentration for most elements was approximately a factor of two when com-pared to the median concentration for the whole measure-ment campaign period, with the exception of Cl and Fe. The highest recorded Fe concentrations over the whole mea-surement campaign period were 350 ng m−3at Femman and
230 ng m−3 at the Campus site, respectively. Similarly Cl concentrations were the second highest at 2400 ng m−3and 1500 ng m−3 at both sites respectively. The local environ-mental office had their highest PM10 mass concentration at the same time with an hourly maximum of 177µg m−3on 27 February at 11:00 p.m., an eightfold increase compared to the monthly average of 20.5µg m−3. This type of night and early morning inversion episodes is known to lead to higher concentrations of traffic related elements in G¨oteborg like K, Cu, Zn and Pb (Janh¨all et al., 2006). However this was not evident from these 24 h measurements, probably because the inversion layer was broken before morning rush hours.
The highest Cl concentrations were recorded on 10 Febru-ary when the wind was coming from the North Sea area in the south west direction from G¨oteborg with a speed of approxi-mately 6 m s−1. The Cl concentration indicated the influence of sea salt particles. Comparing the ratio between S and Cl in sea salt (S/Cl=0.05) (Jaenicke and Schutz, 1988) with the ratio in the samples from 10 February (S/Cl=0.2 at the Fem-man and Campus sites) a relative excess of S was revealed and that could indicate emissions from sea traffic.
A comparison of elemental concentrations between the Campus and R˚a¨o sites, Table 2, showed only slightly higher (<50%) levels at the Campus site, or no difference at all, for elements normally connected to urban activities like traffic and industries (V, Fe, Ni, Cu, Zn, Pb). This, together with the fact that Pb concentrations were below the annual national environmental quality standard limit value of 0.5µg m−3for Pb in ambient air in all samples indicated that the urban air in G¨oteborg is comparatively clean when trace elements are considered.
The current study confirms earlier source apportionments in G¨oteborg. A measurement made by Moloi et al. (2002) in March 2000 on the same campus area as in this campaign showed the same range of concentrations for most trace ele-ments. The averages of S concentrations differed by almost 50% between the two Campus measurements with the high-est S concentration in the current study. Pb was measured in 2000 but it was below the detection limit in this study, indi-cating a general decrease of Pb in the particles due to the use of unleaded gasoline. In a European Community Respira-tory Health Survey (ECRHS) G¨otschi et al. (2005) measured the elemental content of PM2.5for one year including March
4 Summary and conclusions
During the measurement campaign one night-time temper-ature inversion was recognised as well as some days with exceptionally high elemental concentrations. Since the con-centrations of S, V, Ni, Br, and Pb did not increase during the inversion their major sources had to be seen as of non local origin. Back trajectory studies pointed to Eastern Europe as a major source area for S, Fe, Zn, and Pb. In this detailed study the main parameters influencing the elemental content of the PM2.5particles were found to be wind speed and wind
direction. These parameters were matched by back trajectory studies, since the areas over which the air masses had been passing played a major role in the composition of the PM2.5
particles. The detailed analysis of differences in elemental composition and interpretation of the results provides an im-proved understanding of the influences of possible sources on the elemental concentrations in urban aerosol particles. Pin-pointing more explicit sources is not possible since the air is mixed during long distance transport and long measurement times leading to the conclusion that shorter measurement pe-riods are needed as well as better knowledge of emission from different sources. From the analysis of the elemental composition it can be concluded that S is a suitable tracer for air masses coming from both Eastern Europe and ship emissions. High concentrations of V and Ni indicated influ-ence from sea traffic and the harbour area as well as Eastern Europe. A comparison between the elemental ratios of sea salt elements and the same elements in the analysed parti-cles makes it possible to estimate that three quarters of the measured S does not come from the sea salt, but from other sources. These sources are most likely sea traffic in the same sea. The inversion period helped us conclude that Pb and S are not emitted in the G¨oteborg area despite the influence from sea traffic that was noted on the other days. It can be concluded that trace element analysis is an effective tool for estimation of air mass origin, which could be confirmed by trajectory analysis.
Acknowledgements. This work was supported by the Swedish Foundation for Strategic Environmental Research (MISTRA). We thank Srishti Vamsi Kiran V. S. Allumalla and Venu Gopal Rao from the Applied Environmental Measurement Techniques (AEMT) Master’s program at Chalmers University of technology for their help with sampling and initial elemental analysis. Svante Sj¨ostedt is acknowledged for the ion chromatography analysis. The cooperation with the G¨ote-2005 research team is highly appreciated.
Edited by: D. Chen
References
Areskoug, H, Johansson, C., Alesand, T., Hedberg, E., Ekengrena, T., Vesely, V., Wideqvist, U., and Hansson, H.-C.: Concentra-tions and sources of PM10and PM2.5in Sweden, ITM-Report No. 110, Stockholm, Sweden, http://www.itm.su.se/reflab/ dokument/ITM Report 110 Kartlaggningsrapporten.pdf, last ac-cess: 17 September 2008.
Ariola, V., D’Alessandro, A., Lucarelli, F., Marcazzan, G., Mazzei, F., Nava, S., Garcia-Orellana, I., Prati, P., Valli, G., Vecchi, R., and Zucchiatti, A.: Elemental characterization of PM10, PM2.5
and PM1in the town of Genoa (Italy), Chemosphere, 62, 226, 2006.
Artinano, B., Salvador, P., Alonso, D. G., Querol, X., and Alastuey, A.: Influence of traffic on the pm10 and pm2.5 urban aerosol fractions in Madrid (Spain), Sci. Total Environ., 334–335, 111, 2004.
Baldasano, J. M., Valera, E., and Jimenez, P.: Air quality data from large cities, The Science of The Total Environment, 307, 141– 165, 2003.
Bernasconi, G., Tajani, A., and Kregsamer, P.: Manual for qxas/axil. Version 3.5, IAEA, Vienna, 200, 2000.
Boman, J., Gatari, M. J., Wagner, A., and Hossain, M. I.: Elemen-tal characterization of aerosols in urban and rural locations in Bangladesh, X-Ray Spectrometry, 34, 460–467, 2005.
Brandberg, J: Luftkvalitet i G¨oteborgsomr˚adet Februari 2005. Milj¨of¨orvaltningen, G¨oteborg, 2005 (in Swedish).
Chow, J. C., and Watson, J. G.: Review of PM2.5and PM10 ap-portionment for fossil fuel combustion and other sources by the chemical mass balance receptor model, Energy Fuels, 16, 222– 260, 2002.
Dockery, D. W., Pope, C. A., Xu, X., Spengler, J. D., Ware, J. H., Fay, M. E., Ferris, B. G., and Speizer, F. E.: An association be-tween air pollution and mortality in six US Cities, New Engl. J. Med., 329, 1753–1759, 1993.
Draxler, R. R. and Rolph, G.: Hysplit (hybrid single-particle la-grangian integrated trajectory) model: http://www.arl.noaa.gov/ ready/hysplit4.html, last access: 12 May 2006.
European Union: Council directive 1999/30/ec of 22 april 1999 re-lating to limit values for sulphur dioxide, nitrogen dioxide and oxides of nitrogen, particulate matter and lead in ambient air, 1999.
Gatari, M. J., Boman, J., Wagner, A., Janh¨all, S., and Isakson, J.: Assessment of inorganic content of PM2.5particles sampled in a rural area north-east of Hanoi, Vietnam, Sci. Total Environ., 368, 675, 2006.
G¨otschi, T., Hazenkamp-von Arx, M. E., Heinrich, J., Bono, R., Burney, P., Forsberg, B., Jarvis, D., Maldonado, J., Norb¨ack, D., Stern, W. B., Sunyer, J., Tor´en, K., Verlato, G., Villani, S., and Kunzli, N.: Elemental composition and reflectance of ambi-ent fine particles at 21 European locations, Atmos. Environ., 39, 5947, 2005.
Hornung, R. W. and Reed, L. D.: Estimation of average concentra-tion in the presence of nondetectable values, Appl. Occop. Envi-ron. Hug., 5, 46–51, 1990.
Isakson, J., Persson, T. A., and Selin Lindgren, E.: Identification and assessment of ship emissions and their effects in the harbour of G¨oteborg, Sweden, Atmos. Environ., 35, 3659, 2001. Jaenicke, R., and Schutz, L.: Sources of aerosols and production
Janh¨all, S., Olofson, K. F. G., Andersson, P. U., Pettersson, J. B. C., and Hallquist, M.: Evolution of the urban aerosol during win-ter temperature inversion episodes, Atmos. Environ., 40, 5355, 2006.
Janh¨all, S., Moln´ar, P., and Hallquist, M.: Vertical distribution of air pollutants at the Gustavii cathedral in G¨oteborg, Sweden, Atmos. Environ., 37, 209–217, 2003.
Kim, K.-H., Kim, M.-Y., Hong, S. M., Youn, Y. H., and Hwang, S. J.: The effects of wind speed on the relative relationships between different sized-fractions of airborne particles, Chemo-sphere, 59, 929, 2005.
Moln´ar, P., Bellander, T., S¨allsten, G., and Boman, J.: Indoor and outdoor concentrations of PM2.5trace elements at homes, preschools and schools in Stockholm, Sweden, J. Environ. Mon-itor., 9, 348–357, 2007.
Moln´ar, P., Johannesson, S., Boman, J., Barreg˚ard, L., and S¨allsten, G.: Personal exposures and indoor, residential out-door, and urban background levels of fine particle trace ele-ments in the general population, J. Environ. Monitor., 8, 543– 551, doi:10.1039/b600827e, 2006.
Moloi, K., Chimidza, S., Lindgren, E. S., Viksna, A., and Standze-nieks, P.: Black carbon, mass and elemental measurements of airborne particles in the village of Serowe, Botswana, Atmos. Environ., 36, 2447–2457, 2002.
Negral, L., Moreno-Grau, S., Moreno, J., Querol, X., Viana, M. M., and Alastuey, A.: Natural and Anthropogenic Contributions to PM10and PM2.5in an Urban Area in the Western Mediterranean
Coast, Water Air Soil Poll., 192, 227–238, 2008.
P´erez, N., Pey, J., Querol, X., Alastuey, A., L´opez, J. M., and Viana, M.: Partitioning of major and trace components in PM10– PM2.5–PM1at an urban site in Southern Europe, Atmos.
Envi-ron., 42, 1677–1691, 2008.
Pope, C. A. and Dockery, D. W.: Health effects of fine particulate air pollution: Lines that connect, J. Air Waste Manage., 56, 709– 742, 2006.
Schlesinger, R. B., Kunzli, N., Hidy, G. M., G¨otschi, T., and Jerret, M.: The health relevance of ambient particulate matter charac-teristics: Coherence of toxicological and epidemiological infer-ences, Inhal. Toxicol., 18, 95–125, 2006.
UNEP: Central and eastern europe + central Asia lead matrix: http: //www.unep.org/pcfv/Documents/MatrixCEELeadJun06.pdf, last access: 2 August 2006.