THE INFLUENCE OF THE RATE OF SELENIUM
CRYSTALLIZATION FROM AQUEOUS
SOLUTIONS ON ITS MORPHOLOGY
I. Harañczyk* , B. Szafirska** and K. Fitzner *
* Laboratory of Physical Chemistry and Electrochemistry, ** Laboratory of Metallurgy of Non-Ferrous Metals,
Faculty of Non-Ferrous Metals, University of Mining and Metallurgy, 30 Mickiewicza Ave., 30-059 Kraków, Poland
(Received 19 November; accepted 20 January 2002)
Abstract
Selenium crystallization process from aqueous solutions was investigated at constant temperature of 357 K. Two different reducers were used, namely dissolved NaHSO3 and
gaseous SO2. Experiments were conducted for solutions with different initial selenium
con-centration and different pH. The degree of conversion αwas determined as a function of time from the weight of the sediment, and can be described by Avrami-type equation of the following form:
- ln ( 1 - α) = (6.95 .10 -3 .t )1.52
valid at constant temperature of 357 K for NaHSO3 reducer, rate constant
k = 6.95.10-3min–1, and t in minutes. When the reduction was carried out in SO
2stream, the
rate constant k was found to be strongly dependent on the flow rate. Possible mechanism of the reduction process and the influence of the rate of the reduction on the morphology of the product were suggested.
I. Harañczyk et al.
1. Introduction
Selenium finds a broad range of applications because of the variety of interesting physical and chemical properties it exhibits. Due to extensive research on the electronic properties, selenium and its semiconducting compounds can be used in a variety of solid state devices. Its principal application is found in xerography, but amorphous selenium, due to its sensitivity to X-rays, can also be used in X-ray detectors used in radiology. Because it exhibits anisotropic conductivity, selenium solid-state rectifiers are based on this particular property.
The metallurgical application of selenium results from its ability to crystallize in the form of a thin film. Some metals containing an addition of selenium are characterized by considerably better electrical and mechanical properties [1-3]. The addition of selenium to the liquid metal, like iron or copper, results in a decrease of its surface tension. It should be mentioned that different selenium properties result from its particular structure. It can appear in three amorphous and three crystalline modifications [4,5]. Amorphous selenium can be red, black and glassy depending on conditions of its formation. The basic stable form is hexagonal, called also metallic. It has the characteristic structure of spiral chains of Se atoms [4,5,6]
The description of selenium crystallization can be found in the literature [7-10] but this description is given for the process of liquid selenium crystalliza-tion under cooling. Since the industrial process of selenium produccrystalliza-tion is based on the aqueous solution reduction with SO2, the rate of this process is of great importance because the morphology of the product depends on this rate. However, the information about the process of selenium crystallization during the reduction of aqueous selenite solution is generally missing. This lack of information can be attributed to the complexity of the process as well as the experimental difficulties. In aqueous solutions selenium may exist in the form of various ionic species. Depending on initial concentration, pH and temperature, there may exist either HSeO3-or SeO
32-ions in the solution, and
hexagonal crystals. The time of this transformation depends on many factors, but it seems that the most important is temperature. If one assumes that the reducer itself may exist in the solution in the form of different ionic species, the mechanism of the reduction process may be really a complicated one.
In the present paper the influence of the form of the reducer on the rate of the precipitation process was investigated, and consequently, on the morphology of the precipitated selenium. Thus, the estimation of the rate of this precipitation was necessary. Moreover, during the experiments two reducing agents were used, namely, gaseous SO2and acidic sodium bisulphate solution. It was expected that the application of different forms of reducers should also shed some light on the mechanism of the reduction process.
2. Experimental
During the investigations of selenium crystallization after the reduction from the sodium selenite NaSeO3 aqueous solution, two different experimen-tal arrangements were used. Their schemes are shown in Figures 1a and b, respectively. One arrangement, shown in Fig.1a, was used to study the reduction reaction with NaHSO3 used as the reducing agent. The other one, shown in Fig.1b, was used to study the reduction process with gaseous SO2. All experiments were carried out at constant temperature of 357 (+/-1) K.
During the first series of experiments sodium bisulphate was added to the sodium selenite solution. This addition was made in the amount two and a half as big as required by reaction stoichiometry. The initial concentration of Se 4+
ions was kept constant and equal to 0.25 mol.L -1. Initial pH0varied and was
I. Harañczyk et al.
Fig.1a. Experimental arrangement used for the reduction of Se4+ions with NaHSO 3. 1 -
reactor, 2 - Pt electrode, 3 - calomel electrode, 4 - salt bridges, 5 - feeder, 6 - thermostat, 7 - magnetic stirrer, 8 - heater, 9 - thermometers, 10 - computer.
Fig.1b. Experimental arrangement used for the reduction of Se4+ions with SO
2. 1 - vessel
with iodine solution, 2 - cylinder with SO2, 3 - manometer, 4 - vessel with SO2
dissolved in water, 5 - reducing valve, 6 - protection vessel, 7 - valves, 8 - reactor with Na2SeO3solution, 9 - thermostat, 10 - thermometers, 11 - heater, 12 - burette,
Pourbaix diagram supplied the information about the ionic species present in the solution.
From the weight of the sediment the degree of conversion α, defined as the weight of precipitated selenium divided by the total amount of selenium in the solution, was determined. Finally, the morphology of the sediment was inves-tigated by means of the scanning electron microscope. During the second experiment, conducted for the sake of comparison, the flow of SO2was passed through the solution at the same temperature of 357 K. The determination of the time of the reduction process was based on the titration curve of non reacted SO2with iodide solution. Different flow rates of SO2, namely 0.028; 0.075; 0.152 and 0.23 g SO2per minute, were used.
It was observed that in both experiments selenium precipitation from the solution took place in two steps. At the beginning of the process red sediment appeared, then it quickly changed its colour into black. Finally, it gradually coagulated, and accumulated at the bottom of the vessel. At the same time the solution became decolorized. This was the signal to end the measurements, since apparently under imposed conditions, the system reached the final, stable state. If the reduction process was suddenly interrupted, the red, colloidal sediment appeared, which made selenium filtration impossible. This problem was avoided by dilution of the reacting solution in a large amount of water.
3. Results
3.1. Characterization of redox potential changes
The change of the measured potential E as well as pH during the course of reaction was measured as a function of time. The initial selenium concentra-tion C0
Se+4 corresponds to 0.25 m solution of selenium selenite NaSeO3.
Respective 3d plots of E vs. pH and time τare shown in Figures 2a through c. It was observed that after reducer addition the changes in the solution follow similar sequence of events:
I. Harañczyk et al.
Fig.2. Three dimensional redox potential E vs. pH plots recorded after NaHSO3addition to
the Na2SeO3solution with the initial Se concentration 0.25 mole.L-1 and different
initial pHo.
- next, after about 300 s, the deposition of selenium begins, usually on the wall of the vessel, and accelerates while red, colloidal selenium appears in the bulk of the solution. This happens at different pH depending on initial pH0. Corresponding pH values are: for pH0= 8.3 =>5; for pH0= 6.2 and
4.3 => 3.1.
-finally, the sediment slowly turns into black with simultaneous decoloriza-tion of the soludecoloriza-tion. Only at pH0 = 8.3 red selenium was not observed
during the course of reaction. Precipitated deposit was black.
When obtained E vs. pH experimental points are superimposed on Se-S-H2O Pourbaix diagram calculated for 357 K [11], one may observe that pH values, at which Se appeared in the solution as a separate phase, correspond roughly to HSe-/HSeO
3- and H2Se/HSeO3- equilibrium lines (Fig.3).
Moreover, while the reaction proceeds, they stay along this line all the time, and gradual decrease in pH is observed. From this observation one may draw the conclusion that depending on initial conditions two different reaction schemes may take place:
either
SeO3-2+ H
2O =HSeO3-+ OH- (1)
HSeO3-+ 3HSO
3-+ 3H2O= 6H++ SO42-+ HSe-+ 3OH- (2)
or
HSeO3-+ 3HSO
3- + 3H2O = 6H++ 3SO42-+ HSe-+ 3OH- (3)
HSe-+ H+= H
2Se (4)
and then the respective reactions of disproportionation may follow: HSeO3-+ 2 HSe-+ 3H+= 3Se0+ 3H
2O (5)
HSeO3-+ H
2Se + 3H+= 2 Se0+ 3 H2O (6)
They are responsible for the appearance of Se atom clusters as a separate phase in the solution. These clusters may play a part of nuclei of the solid phase. It is also interesting to note that apparently the reaction of reduction proceeds along two different paths: SeO3–2=> HSeO
3-=> HS-and HSeO3-=>
HSe-, depending on initial pH.
I. Harañczyk et al.
3.2. Estimation of the rate of the process
Observed crystallization process is massive i.e. it may take place at any point of the solution volume. However, contrary to the crystallization process from supersaturated solution, nucleation stage is substituted in this case by the chemical reaction, in which under the action of the reducer the number of produced clusters of Se atoms increases in time. The following stage of the crystal growth is controlled by the mass transfer and resulting enlargement of clusters. The very first change in colour after reducer addition was noticed after about 300 s, which means that after this time the reduced selenium is present in the system as a separate phase. The overall crystallization process took more that 15000 s, which means that a much longer time is necessary to turn this phase into a black, stable crystalline form. Thus, it seems reasonable to assume that the overall process is controlled by the step connected with the heterogeneous transformation analogous to the rate growth of gray tin into white tin matrix [12]. That’s why it was decided to describe the rate of selenium crystallization by the Avrami - Erofeev equation [13], which
connects the rate of heterogeneous transformation with the degree of conversion, α.
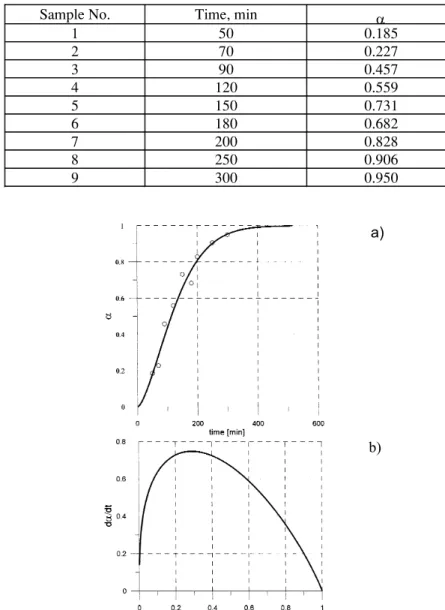
The results of experimental determination of the parameter αwith NaHSO3 reducer are gathered in Table 1. Data reported in Table 1 were obtained for the gas-tight system, in which constant monitoring of the redox potential, except for the initial and final states, was not possible. In this way the possible interaction with air and its influence on the results was avoided. Using the obtained experimental data the dependence of the fraction a on time was derived and it is shown in Fig.4a. The experimental results shown in Fig.4a were described with the rate equation:
- ln(1 – α) = (k t) n (7)
where k is rate constant dependent on temperature [13]. The least-square fit to the log [-ln (1-a)] vs.log t plot gave the dependence compatible with eq.(7) in the following form:
- ln (1-a) = 6.95.10-3 .t 1.52 (8)
with k = 6.95.10-3min-1= 1.16.10-4s-1at 357 K.
In turn, calculated rate of the process da/dt = f(a), shown in Fig.4b. reveals that at certain value of α(α =0.3) the rate reaches its maximum.
Since the process with applied SO2reducer was much faster , unfortunate-ly it was impossible to determine the rate of this process in a similar manner. Moreover, it was found that the rate was dependent on the SO2 flow rate. However, it was possible to determine a for the final amount of Se deposit obtained under different experimental conditions. Using these data rough comparison of the rates can be made in the following way:
- it was observed that initial time tiis necessary to saturate the solution with SO2before the reaction starts. This time depends also on the flow rate vSO2. At this time α is 0. However, αcan be determined for final time, tf. - the obtained products are mainly two dimensional (e.g. in Fig.8b and c),
I. Harañczyk et al.
Sample No. Time, min α
1 50 0.185
2 70 0.227
3 90 0.457
4 120 0.559
5 150 0.731
6 180 0.682
7 200 0.828
8 250 0.906
9 300 0.950
Table 1. Experimental data obtained for the reduction with NaHSO3and initial Se=4
concentration 0.28 mole L-1 in the gas - tight system. (pHo= 6.6, T = 357 K,
reducer excess: 2.5, stirring).
Fig.4. a) Degree of conversion αvs. time dependence ; (ο) - experimental points. Solid line - calculated from Eq.(8)
b) Rate of the process calculated from Eq.(8) as a function of α
a)
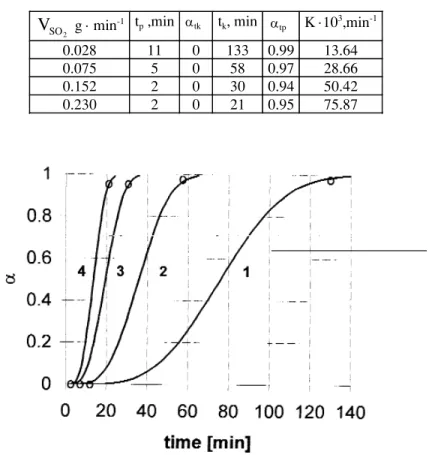
Under these conditions and using the data shown in Table 2, one can calculate the plot of αvs. time at different SO2flow rates, using (tf– ti) instead of t in Eq.(7). Obtained plots for solutions with pH0= 5 are shown in Fig.5a,
while Fig.5b demonstrates the flow rate dependence of the rate dα/dt vs. α. Derived rate constants k are shown in Fig.6 as a function of the flow rate, and the obtained dependence is:
2
SO
V g ⋅ min-1
tp ,min tk, min K ⋅103,min-1
0.028 11 0 133 0.99 13.64 0.075 5 0 58 0.97 28.66 0.152 2 0 30 0.94 50.42 0.230 2 0 21 0.95 75.87
Table 2. Experimental data obtained for the reduction with gaseous SO2for different flow
rate. (initial Se+4concentration 0.26 mole.L-1, pHo= 5.0, T = 357 K).
Fig.5. a) Degree of conversion a vs. time dependence during reduction with SO2, calculated
for fixed pHo= 5 and different SO
2flow rates: (1) - 0.028 g/min; (2) - 0.075
g/min; (3) - 0.152 g/min and (4) - 0.230 g/min.
αtp
I. Harañczyk et al.
Fig.5.b) Rate of the process as a function of α( Flow rates the same as shown in Fig.5a.)
k = 5.0.10-3+ 0.3 v
SO2 (9)
where k is in min-1.
These results, though approximate, clearly demonstrate that the degree of conversion a depends on the flow rate and the process with SO2is much faster than that with NaHSO3 reducer. Moreover, extrapolation of Eq.(9) to zero flow rate yields the value of k = 5.0.10-3 min-1 which is very close to k =
6.95.10-3min-1 obtained for the reduction with NaHSO
3This may suggest that
the saturation of the solution with SO2has the main influence on the reduction process.
3.2. The influence of the rate of the process on products morphology
Since the reduction with SO2 is much faster than with NaHSO3 it can be shown that HSO3–species, which act slower, can produce crystalline deposit
as a final Se form. Figures 7a,b and c show the stages of the evolution of selenium deposit obtained during the process in which HSO3 – species took
part in the reduction. In turn, Figures 8a,b and c show deposits obtained for almost identical initial conditions after faster reduction process, i.e. when gaseous SO2 was used with different flow rates as a reducer. This deposit is very dense and apparently amorphous.
4. Discussion
The rate of selenium crystallization from aqueous solutions after reduction at constant temperature of 357 K with different reducers was established. Also, the influence of the rate on the morphology of selenium deposit was demonstrated. Results of our experiments have shown that independently of initial conditions the reduction process proceeds through two steps:
Se (aq. soln.) => Se (red) => Se (black) (10)
I. Harañczyk et al.
it is even possible to hamper the stage of Se (red) formation (pH > 8, high Se concentration ) and black, crystalline Se is formed.
The analysis of α(t) and dα/dt = f(α) dependencies obtained for NaHSO3 reducer indicate that after short induction period the reaction accelerates and the rate reaches the maximum at the degree of conversion α = 0.3. This happens after approximately 500 s, i.e. the time which corresponds roughly to the point of the minimum on the E vs. time curves shown in Figures 2a-2c. This supports the assumption that the generation of Se clusters due to chemical reaction takes place in a very short period of time in comparison with the overall process. Then, the steady decrease in rate should correspond to the stage of interaction between clusters and resulting growth of the solid phase. Comparison of these results with figures 5a and b shows that reduction with SO2reducer is faster and its rate depends on the flow rate.
Detailed mechanism of the reduction process cannot be derived from our study. However, it seems there is a chance to identify the stage responsible for the appearance of Se in the solution as a separate phase. The change of the reducer from NaHSO3 to SO2 accelerates the reduction process, and its rate apparently depends on the flow rate. The fact that at zero flow rate this rate corresponds to the rate of reduction with NaHSO3 indicates the influence of SO2on reduction reaction. It seems that using SO2the solution must reach the level of saturation with SO2first, and then the reaction may proceed. The more SO2is supplied to the system , the faster the reaction of reduction is. Its first
stage proceeds down to Se–2species formation. Then, the system finds itself
in far-from-equilibrium state as long as Se0appears due to disproportionation
reaction. The return to equilibrium is fast and the first phase which is formed along this kinetic path, is amorphous red selenium. Then, slow crystallization process takes over which turns amorphous, red selenium into black, crystalline one.
In more acidic solutions with NaHSO3reducer (final pH < 3 ) the system behaves similarly as in the case of the reduction process in the solution saturated with SO2. The reaction is fast and black, amorphous sediment is the product. In turn, for high pH0 >8 and high initial Se concentration (~0.25
mol*L -1) the process is slow and black crystalline Se appears directly from
change in pH of the solution may influence the rate of the reaction and conse-quently, the morphology of selenium deposit. This knowledge, though certainly incomplete, may help to control deposition process of selenium of required morphology from aqueous solutions.
c) b)
a)
Fig.7. Selenium deposit obtained after selenite solution reduction with NaHSO3 .
(Magnification given in parenthesis)
a) co= 0.066 mole .L-1, pHo= 8.1 (x10000)
b) co= 0.250 mole .L-1, pHo= 8.3 (x5000)
c) co= 0.250 mole .L-1, pHo= 4.3 (x5000)
Fig.8. Selenium deposit obtained after selenite solution reduction with SO2. (Magnification
given in parenthesis)
a) co= 0.067mole .L-1, pHo= 8.1, V
SO2= 0.03 g/min (x10000)
b) co= 0.250 mole .L-1, pHo= 8.2, V
SO2= 0.08 g/min (x5000) c) b)
I. Harañczyk et al.
Acknowledgements
This work was done under contract with KGHM Polska Miedz S.A. Glogów.
References
1. M.Sadayappan, T.A.Fasoyinu, D.Cousineau, R.Zavadil, M.Sahoo,
Trans.American Foundarymen’s Soc.,106 (1998) 305.
2. M.Popescu, F.A.Fasoyinu, M.Sahoo, D.T.Peters,Trans.American
Foundarymen’s Soc.,106 (1998) 381.
3. L.V.Whiting, P.D.Newcombe, M.Sahoo,Trans.American
Foundarymen’s Soc.,106 (1998) 575.
4. K.C.Mills, Thermodynamic Data for Inorganic Sulphides, Selenides
and Tellurides, Butterworths, London 1974.
5. R.A.Zingaro, W.Ch.Cooper, Selenium, VNB (London, Toronto, Melbourne),1974.
6. A. van Hippel, M.C.Bloom, J.Chem.Phys., 18 (1950) 1243. 7. K.P.Mamedov, Z.D.Nurieva, Kristalografiya, 9 (1964) 1964.
8. M.B. Janiua, J.M. Toguri, W.C. Cooper, Can. J. Phys, 49 (1971) 475. 9. S.I.Mekhtyeva, D.S.Abdinov,G.M.Aliyev,Zh.Fiz.Khim.,42 (1968) 243. 10. S.U.Dzhalylov,Russ.J.Phys.Chem., 39 (1965) 1376.
11. HSC Chemistry for Windows (version 4.0), Chemical Reaction and Equilibrium Software with Extensive Thermochemical Database,
Outokumpu,1999.
12.W.G.Burgers, L.J.Groen, Disc.Faraday Soc., 23 (1957) 183.