ABSTRACT: Multivariate techniques have become a useful tool for studying the phenotypic di-versity of Germplasm Bank accessions, since they make it possible to combine a variety of different information from these accessions. This study aimed to characterize the phenotypic dispersion of garlic (Allium sativum L.) using two multivariate techniques with different objective functions. Twenty accessions were morphologically characterized for bulb diameter, length, and weight; number of cloves per bulb; number of leaves per plant; and leaf area. Techniques based on generalized quadratic distance of Mahalanobis, UPGMA (Unweighted Pair Group Method with Arithmetic Mean) clustering, and nMDS (nonmetrric MultiDimensional Scaling) were applied and the relative importance of variables quantifi ed. The two multivariate techniques were capable of identifying cultivars with different characteristics, mainly regarding their classifi cation in sub-groups of common garlic or noble garlic, according to the number of cloves per bulb. The representation of the phenotypic distance of cultivars by multidimensional scaling was slightly more effective than that with UPGMA clustering.
Keywords: Allium sativum L., nMDS, UPGMA, genetic divergence
Introduction
Several countries, including the United States, the United Kingdom, Japan, Germany, Italy, Australia, Chile, the Czech Republic, and Brazil, have created Ger-mplasm Banks for the conservation of garlic accessions (Allium sativum L.) due to limited species recombination (Matus et al., 1999, Stavelíková, 2008). The phenotypic variability in these banks should be quantifi ed in order to allow an effective use of accession collections, and this warrants the need for studies on the morphological characterization of cultivars.
In studies of the genetic divergence of garlic cul-tivars, UPGMA (Unweighted Pair Group Method with Arithmetic mean) clustering has been used by Mota et al. (2004), Vieira and Nodari (2007), and Buso et al. (2008). However, the objective functions of agglomerative hier-archical methods, such as UPGMA, are conditioned to the hierarchical property of clusters, which may not ac-tually exist. Therefore, multiple techniques are required to make robust inferences about phenotypic variability.
Multi-Dimensional Scaling (MDS) is an ordering technique for dimensional reduction that allows one to map individuals as points in low-dimensional space (generally 2D or 3D) (Manly, 2004; Borg and Groenen, 2005). MDS is especially useful when the relation be-tween individuals is unknown (not an unusual case in germplasm banks), but it is possible to estimate a detach-ment matrix between them.
In accessions of cocoa, Leal et al. (2008) used a hierarchical method together with an MDS solution to identify accession diversity. Studying genetic variability of Tibouchina papyrus populations, Telles et al. (2010) based their conclusions on the results of UPGMA and
MDS analyses. No studies were found in the literature that examined the phenotypic relations of garlic cultivars using the tools of cluster analysis and MDS mapping.
This study aimed to characterize the phenotypic dispersion of garlic cultivars, based on morphologic characteristics, using two multivariate techniques with distinct objective functions.
Materials and Methods
The following morphological variables were used: bulb diameter (DIAM), bulb length (BL), average bulb weight (BW), number of cloves per bulb (NCB), number of leaves per plant (NLP), and leaf area (LA), obtained from readings of a leaf area integrator. The data were obtained from an experiment comprised of twenty garlic accessions. Accession origins and popular names are de-scribed in Table 1.
The experiment was carried out in 2010 in an experi-mental area in Viçosa, state of Minas Gerais, Brazil (20º45’ S; 42º51’ W; average altitude of 650 m). The experimental design was a completely randomized block with four rep-lications. The experimental units consisted of four longi-tudinal rows 1.0 m long, spaced at 0.25 cm, with plants every 0.10 cm, totaling 40 plants per experimental unit. Plants in the two central rows were considered useful, and those located 0.10 cm from each edge were excluded. After harvesting, plants were submitted to the curing process in the fi eld and in warehouses for 3 and 60 days, respectively. After the fi eld curing process, plants had their aerial parts removed 0.10 cm above the bulbs and their roots entirely removed. The variables NLP and LA were measured im-mediately after harvesting, while the others were evalu-ated after the warehouse curing process.
Received April 21, 2013 Accepted July 15, 2013
1University of São Paulo/ESALQ – Dept. of Exact Sciences,
C.P. 09 – 13418-900 – Piracicaba, SP – Brazil.
2Federal University of Viçosa – Dept. of Statistics, Av. P.H.
Rolfs, s/n – 36570-000 – Viçosa, MG – Brazil.
3Federal University of Viçosa – Dept. of Crop Science.
*Corresponding author <[email protected]> Edited by: Thomas Kumke
Morphological phenotypic dispersion of garlic cultivars by cluster analysis and
multidimensional scaling
Anderson Rodrigo da Silva1*, Paulo Roberto Cecon2, Carlos Tadeu dos Santos Dias1, Mário Puiatti3, Fernando Luiz Finger3,
Based on the morphological phenotypic charac-teristics described, the detachment among accessions was measured by two multivariate techniques: cluster analysis and multidimensional scaling, described as fol-lows.
Prior to the cluster analysis, the residual variances and covariances between variables were estimated. We calculated the means of each accession for each vari-able. Based on the estimates, the generalized quadratic distance of Mahalanobis was adopted as a dissimilarity measure between the accessions to carry out the cluster-ing by UPGMA in accordance to the algorithm proposed by Lance and Williams (1967) to update detachments between entities during the clustering process. This is shown in equation 1:
(1) where i and j are newly clustered entities and k is another entity to be clustered. To reach the ob-jective function of UPGMA method, the fol-lowing parameterization is used (equation 2):
(2)
where i, j, and are the required parameters for the algorithm; ni and nj show the number of accessions in entities i and j, respectively.
The Mojena (1977) method, based on the relative size of the fusion levels in the dendrogram, was used to indicate the cut-off point. The purpose was to select the number of groups in stage j that, primarily, complete j > , where j is the fusion level corresponding to stage j (j = 1, 2, ..., g –1), is the reference cut-off point given by: kˆ, where and
ˆ
are, respectively, themean and standard deviation of values; k is a constant whose value to be adopted, as suggested by Milligan and Cooper (1985), is k =1.25 as a cut-off point for the defi ni-tion of the number of groups.
The generalized quadratic distance of Mahalanobis also allowed us to quantify the relative contributions of each of the p = 6 characters to phenotypic detachment using the criterion proposed by Singh (1981), based on
Sj (j=1, 2, ..., p) statistics. In this case, it was considered that the generalized quadratic distance of Mahalanobis between accessions i and i’ can be explained by equa-tion 3:
(3)
And, for this distance, the contribution of the j-th character is given by equation 4:
(4)
where jj, is the element of the j-th line and j’-th inverse column of the matrix for residual variances and covari-ances, and dj represents the difference between acces-sion i and accesacces-sion i’ for the j-th character. Then, the value of S.j is obtained by the contributions of the j-th character at g(g–1)/2 detachment between accessions.
The second multivariate analysis technique was based on nonmetric multidimensional scaling (nMDS) where only information about the order of dissimilari-ties was used to obtain a geometric representation. In this case we used the representation of bidimensional space of the generalized detachment matrix of Ma-halanobis. Formally, nMDS is defi ned by a monotonic functionf : dijdij whose objective is to represent the
information of dissimilarity ordering of g accessions, such as d =f(d )ij ij ij, where dij, dij, and ij represent,
re-spectively, the dissimilarity, the disparity, and the map-ping error for accessions i and j in a particular number of dimensions. A dispersion diagram was used to show the results of the nMDS solution. The analysis of adjust-ment level in two dimensions of multidimensional space was observed using the formula (equation 5) of Kruskal’s Stress1:
(5)
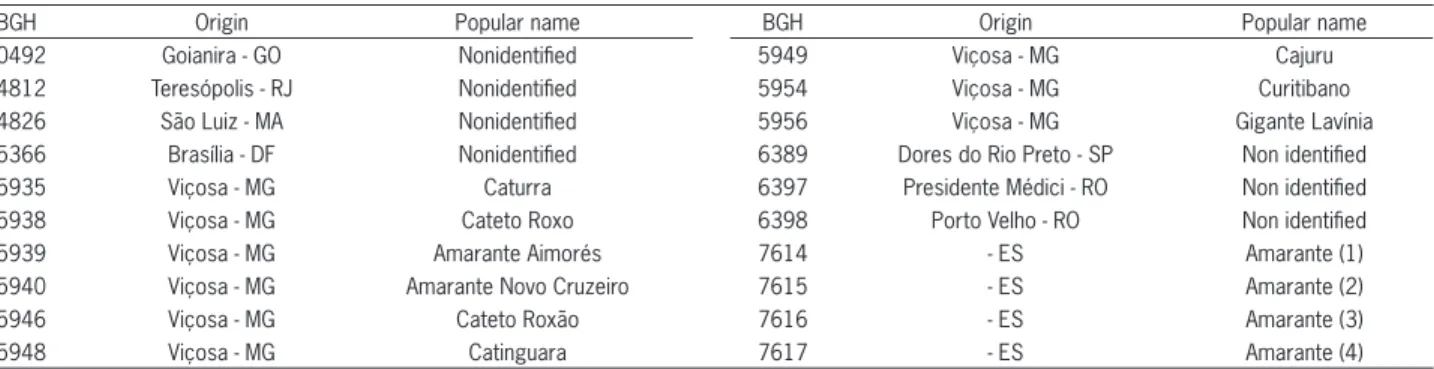
Table 1 − BGH identifi cation, origin, and popular name (or variety name) of twenty garlic accessions registered at BGH/UFV.
BGH Origin Popular name BGH Origin Popular name
0492 Goianira - GO Nonidentifi ed 5949 Viçosa - MG Cajuru
4812 Teresópolis - RJ Nonidentifi ed 5954 Viçosa - MG Curitibano
4826 São Luiz - MA Nonidentifi ed 5956 Viçosa - MG Gigante Lavínia
5366 Brasília - DF Nonidentifi ed 6389 Dores do Rio Preto - SP Non identifi ed
5935 Viçosa - MG Caturra 6397 Presidente Médici - RO Non identifi ed
5938 Viçosa - MG Cateto Roxo 6398 Porto Velho - RO Non identifi ed
5939 Viçosa - MG Amarante Aimorés 7614 - ES Amarante (1)
5940 Viçosa - MG Amarante Novo Cruzeiro 7615 - ES Amarante (2)
5946 Viçosa - MG Cateto Roxão 7616 - ES Amarante (3)
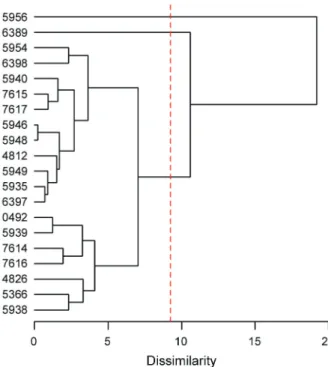
48 % of the last fusion level (Figure 1). Based on this information, we identifi ed three clusters of accessions, two of which consisted of a single accession (BGH-5956 and BGH-6389). Therefore, one cluster accounted for 90 % of the accessions. Considering the fusion level of this cluster of approximately seven in the dissimilarity mea-sure, this means that circa 35 % of the dissimilarity (or 65 % of similarity) of the accessions within the cluster is in relation to the last fusion level.
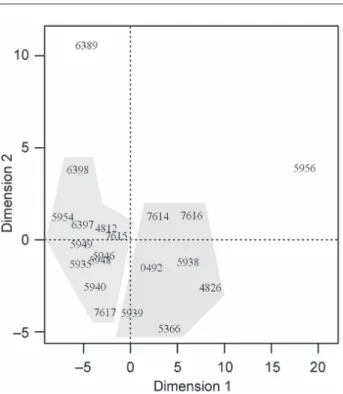
The stress value of the nMDS solution with repre-sentation in two dimensions was 11.5 %. According to the table proposed by Sturrock and Rocha (2000), at this stress value there is a 1 % probability that the accessions are randomly arranged in bidimensional space. The re-sults of this solution are shown in Figure 2. Dimension 1 shows a great distance between accession BGH-5956 and the other 19 accessions. Likewise, dimension 2 pri-marily refl ects the phenotypic divergence of accession BGH-6389 in relation to the others. Therefore, acces-sions BGH-5956 and BGH-6389 are atypical points. In a study carried out by Menezes Sobrinho et al. (1999), the cultivar Gigante Lavínia (BGH-5956) was also allocated to a cluster different from the other accessions, as in our study.
The nMDS solution in two dimensions provided results similar to those obtained from the cluster meth-od. However, with the geometric representation of the distances, it is possible that the formation of four clus-The table of stress values proposed by Sturrock
and Rocha (2000) was used to validate the result ob-tained with the nMDS solution by comparing the value obtained with the stress value generated from random matrices with the same number of objects and the same number of dimensions (twenty and two, respectively, in this study).
A graphic representation of the original detach-ment matrices, cophenetic distances obtained from UPGMA method and disparities, all ordered according to the number of groups, was made to visualize the de-gree of dissimilarity (or similarity) within and between groups. To standardize representation to the scale [0, 1], the detachments were divided by the maximum distance in each matrix. We also calculated the correlations be-tween matrices of original distances, cophenetic distanc-es, and disparities.
The matrix for residual variances and covariances was obtained from the 'Experimental Statistics' module and distances between accessions were calculated by the 'Multivariate Analysis' module, both part of Genes software version 2009.7.9 (Cruz, 2006). The cluster analysis was carried out with the 'hclust' function of the stats package, nonmetric multidimensional scal-ing with the 'isoMDS' function of the MASS package, and the graphic representation of detachment matrices with the 'image' function of the graphics package. All of them are packages of R software version 2.15.2 (R Core Team, 2012).
Results and Discussion
In the Mahalanobis distance, accessions BGH-5940 and BGH-5956 had the greatest divergence (26.73, data not shown), and accessions 5946 and BGH-5948 had the smallest distance (0.22, data not shown). More than 60 % of these divergences are attributed to differences between productive characteristics of plants, namely number of cloves per bulb (NCB) (43 %, data not shown) and average bulb weight (BW) (20 %, data not shown), in relation to the measurement of relative importance proposed by Singh (1981). These results are in accordance with those obtained by Menezes Sobrin-ho et al. (1999) wSobrin-ho, using principal components and canonic variables for the morphological characteriza-tion of garlic germplasm, reported that NCB and BW are among the ten features evaluated that most contributed to the morphological distinction of accession groups of the Germplasm Bank in Brasília, Federal District, Bra-zil (15º47’ S; 47º55’ W). In a study on garlic diversity based on morphological features, Panthee et al. (2006) used cluster analysis and principal components analysis and observed that BW, DIAM, BL, and NCB were the characteristics that most contributed to the diversity of the 179 accessions.
Based on the method of Mojena (1977), we ap-plied a cut-off point to the dendrogram of the UPGMA method at a dissimilarity of 9.2, which corresponds to
ters may be more appropriate, according to the separa-tion caused by the shades in Figure 2. Such formasepara-tion indicates an average within-cluster distance (for the two clusters with more than one accession) of approximately four, which represents less than 20 % of the higher dis-parity. If a cut-off in the dendrogram were made allow-ing the formation of fi ve clusters, the exact same clusters identifi ed with the nMDS solution would be made and the fusion level of these clusters would represent ap-proximately 21 % of the last level. It is apparent, there-fore, that the Mojena method was not very strict, given that the criterion used to determine the number of clus-ters was infl ated by the high fusion level in the accession BGH-5956 in relation to the others, because the variance of fusion levels is more affected than the average.
The most appropriate cluster formation can be visualized graphically by the matrix representation of the dissimilarity level between the accessions based on the original distances ordained in accordance to the k number of clusters. A good representation originates a good block-diagonal structure, i.e., an ideal cluster has accessions that present dissimilarity equal to zero for all accessions of this cluster and equal to one for all accessions of the other cluster. Figure 3 was used as the basis for cluster formation, and k = 3, k = 4, and k = 5 were used. The colors used to represent dissimi-larity level between accessions ranged from black (no dissimilarity) to white (highly dissimilar). The forma-tion of four clusters made it possible to identify clearly the more similar accessions, showing a block-diagonal structure. In addition, the blocks showed an internal
dissimilarity level lower than 20 % of the maximum dissimilarity.
Representation of original distances is more accu-rately reached with disparities than with cophenetic dis-tances (Figure 3). Indeed, once in the cophenetic matrix, the distance between any accession of one cluster to an accession of another cluster is the same, i.e., the fusion level of clusters. The result of the nMDS solution, i.e., the disparity matrix strongly correlated (0.96) with the matrices for original distances, and the correlation of the cophenetic matrix was higher (0.86) (Table 2). Thus, both techniques were correlated (0.88).
Figure 4 shows the average of the four clusters formed by the garlic accessions for the morphological characters of higher relative importance (NCB and BW). Cluster 1, containing seven accessions, represents ac-cessions that can be used as pertaining to the common subgroup, according to the olericultural classifi cation of Embrapa (Luengo et al., 1999). Of the nine cultivars from the municipality of Viçosa (Minas Gerais, Brazil), two (Cateto Roxo and Amarante Aimorés) were located in Cluster 1. Cluster 2, containing eleven accessions, was characterized by noble cultivars with average BW.
Not only did accession BGH-5956 had higher aver-age BW, it also presented high NCB, which is an undesir-able characteristic from the commercial perspective. Ol-iveira et al. (2010) also observed that the Gigante Lavínia cultivar (BGH-5956) stood out for showing higher BW (25.2 g), which is far below the value found in the cur-rent study (47.4 g). This can be obviously explained by edaphoclimatic differences. On the other hand, acces-sion BGH-6389 can be considered an ideal cultivar for the market, given its high BW and an NCB around 15 (characteristic of noble garlic). For the Amarante, Cateto Roxo and Caturra cultivars, located in Cluster 2 in the current study, Oliveira et al. (2010) obtained results (ex-cept for environmental interference) consistent with BW averages ranging from 16 to 20 g, approximately, and NCB of around 10 to 15.
Conclusions
The two multivariate techniques with distinct ob-jective functions made it possible to identify cultivars with different characteristics, mainly, in terms of sub-group classifi cation of noble and common garlic, accord-ing to the number of cloves per bulb. The representation of phenotypic dispersion of cultivars by multidimension-al scmultidimension-aling was slightly more effective than the represen-tation of the cluster analysis with the UPGMA method.
Figure 2 − Scatter plot in bidimensional space of disparities among twenty garlic accessions.
Table 2 − Correlation matrix between original distances, cophenetic distances and disparities.
Original Cophenetic Disparity
Original 1 -
-Cophenetic 0.86 1
Figure 3 − Matrix representation of the dissimilarity level among the accessions for original distances, cophenetic distances, and disparities clustered in accordance to k number of clusters.
Acknowledgements
To FAPEMIG, for providing fi nancial support for this project, to CAPES, for granting a scholarship to the fi rst author, and to CNPq, for granting productivity scholarships.
References
Borg, I.; Groenen, P.J.F. 2005. Modern multidimensional scaling: theory and applications. 2ed. Springer, New York, NY, USA. Buso, G.S.C.; Paiva, M.R.; Torres, A.C.; Resende, F.V.; Ferreira,
M.A.; Buso, J.A.; Dusi, A.N. 2008. Genetic diversity studies of Brazilian garlic cultivars and quality control of garlic-clover production. Genetics and Molecular Research 7: 534-541.
Cruz, C.D. 2006. Software Genes: Biometry. = Programa Genes: Biometria. UFV, Viçosa, MG, Brazil (in Portuguese).
Lance, G.N.; Williams, W.T. 1967. A General theory of classifi catory sorting strategies. 1. Hierarchical systems. Computer Journal 9: 373-380.
Leal, J.B.; Santos, L.M.; Santos, C.A.P.; Pires, J.L.; Ahnert, D.; Corrêa, R.X. 2008. Genetic diversity among farm and germplasm bank accessions of cacao in Bahia, Brazil. Pesquisa Agropecuária Brasileira 43: 851-858 (in Portuguese, with abstract in English).
Luengo, R.F.A.; Calbo, A.G.; Lana, M.M.; Moretti, C.L.; Henz, G.P. 1999. Classifi cation of Vegetables. = Classifi cação de Hortaliças. Embrapa Hortaliças, Brasília, DF, Brazil (Documents 22) (in Portuguese).
Manly, B.F.J. 2004. Multivariate Statistical Methods: A Primer. 3ed. Chapman & Hall, London, UK.
Matus, I.; Gonzaléz, M.I.; Pozo, A. 1999. A evaluation of phenotypic variation in a Chilean collection of garlic (Allium sativum L.) clones using multivariate analysis. Plant Genetic Resources Newsletter 117: 31-36.
Menezes Sobrinho, J.A.; Charchar, J.M.; Aragão, F.A.S. 1999. Morphological characterisation of garlic germplasm by cluster, principal components and canonic variables analysis. Horticultura Brasileira 17: 96-101 (in Portuguese, with abstract in English).
Milligan, G.W.; Cooper, M.C. 1985. An examination of procedures for determining the number of cluster in a data set. Psychometrika 50: 159-179.
Mojena, R. 1977. Hierarchical grouping method and stopping rules: an evaluation. Computer Journal 20: 359-363.
Mota, J.H.; Souza, R.J.; Yuri, J.E.; Resende, G.M.; Paiva, L.V. 2004. Genetic diversity of the cultivars of garlic (Allium sativum L.) for molecular marker RAPD. Ciência e Agrotecnologia 28: 764-770 (in Portuguese, with abstract in English).
Oliveira, F.L.; Doria, H.; Teodoro, R.B.; Resende, F.V. 2010. Agronomic characteristics of garlic cultivars in Diamantina, Brazil. Horticultura Brasileira 28: 355-359 (in Portuguese, with abstract in English).
Panthee, D.R.; Kc, R.B.; Regmi, H.N.; Subedi, P.P.; Bhattarai, S.; Dhakal, J. 2006. Diversity analysis of garlic (Allium sativum L.) germplasms available in Nepal based on morphological characters. Genetic Resources and Crop Evolution 53: 205-212.
R Core Team. 2012. R: A language and environment for statistical computing. R Foundation for Statistical Computing, Vienna, Austria. Available at: http://www.r-project.org [Accessed Nov 4, 2012]
Singh, D. 1981. The relative importance of characters affecting genetic divergence. Indian Journal Genetics & Plant Breeding 41: 237-245.
Stav líková, H. 2008. Morphological characteristics of garlic (Allium sativum L.) genetic resources collection. Horticulture Science 35: 130-135.
Sturrock, K; Rocha, J. 2000. A multidimensional scaling stress evaluation table. Field Methods 12: 49-60.
Telles, M.P.C.; Silva, S.P.; Ramos, J.R.; Soares, T.N.; Melo, D.B.; Resende, L.V.; Batista, E.C.; Vasconcellos, B.F. 2010. Genetic structure of natural populations of Tibouchina papyrus (pau-papel) in areas of cerrado rupestrian fi elds. Revista Brasileira de Botânica 33: 291-300 (in Portuguese, with abstract in English). Vieira, R.L.; Nodari, R.O. 2007. Genetic diversity of garlic revealed