NITROGEN DOSES AND WATER BALANCE
COMPONENTS AT PHENOLOGICAL STAGES OF CORN
Monica Martins da Silva1; Paulo Leonel Libardi2*; Flávia Carvalho Silva Fernandes2
1
UNICASTELO - Av. Hilário da Silva Passos, 950 - 13690-970 - Descalvado, SP - Brasil. 2
USP/ESALQ - Depto. de Ciências Exatas, Pavilhão de Engenharia - C.P. 09 - 13418-900 - Piracicaba, SP - Brasil. *Corresponding author <pllibard@esalq.usp.br>
ABSTRACT: Determining the intensity of the water balance components in the control volume of a soil, and consequently defining the most likely periods of occurrence of a water deficit in a crop, is an exercise that requires knowledge about soil, climate and plant factors. This research aimed to evaluate soil water balance components at phenological stages of corn (Zea mays L.) under no-till system, when fertilized with 60, 120, and 180 kg ha–1 of nitrogen. The field experiment was carried out in
Piracicaba, State of São Paulo, Brazil, on a Typic Hapludox. Evaluations were made in the 2004/2005 and 2005/2006 corn cropping seasons, divided over three stages according to the plant’s phenology. Runoff was not taken into account. Measurements were made for precipitation (P), internal drainage (D) (or capillary rise) at a 0.8 m depth, and water storage variation (Δh) in the soil layer from 0.0-0.80 m; actual evapotranspiration (ET) was considered the unknown quantity of the equation. Corn grain yield was evaluated as well. In general, the soil water balance components were modified by N doses, because the soil had been relatively smaller Δh in treatments involving N application than in the treatment without N, resulting in smaller D values in those treatments, which resulted in greater absorption by the plants and greater ET. As expected, the plant developmental stage II had a higher ET value.
Key words: internal drainage, hydraulic conductivity, actual evapotranspiration, tensiometer, no-till system
DOSES DE NITROGÊNIO E COMPONENTES DO BALANÇO
HÍDRICO EM FASES FENOLÓGICAS DO MILHO
RESUMO: Determinar a intensidade dos componentes do balanço de água no solo num certo volume de controle de solo e, por conseguinte, a definição dos períodos mais prováveis de déficit hídrico para a cultura, está relacionada ao conhecimento de fatores do solo, do clima e da planta. Avaliaram-se componentes da equação do balanço de água no solo para fases fenológicas do milho (Zea mays L.), sob sistema de plantio direto, adubado com 60, 120 e 180 kg ha–1 de nitrogênio. O experimento foi
conduzido em Piracicaba, SP, num Latossolo Vermelho-Amarelo. A avaliação foi feita nas safras 2004/ 2005 e 2005/2006 de milho dividindo-as em três fases de acordo com a fenologia da planta. O deflúvio superficial foi desconsiderado, e foram medidas a precipitação pluvial (P), a drenagem interna (D) (ou ascensão capilar) na profundidade de 0,8 m, a variação da armazenagem (Δh) na camada de solo de 0,0-0,80 m, e a evapotranspiração real (ET) foi considerada como incógnita da equação. Também, avaliou-se o rendimento de grãos de milho. De forma geral, os componentes da equação do balanço foram alterados pelas doses de N, uma vez que nos tratamentos com aplicação de N, o solo mostrou uma Δh relativamente menor que o tratamento sem N, refletindo em menor valor de D nesses tratamentos, sendo traduzido em maior absorção pelas plantas bem como maior ET. A fase II de desenvolvimento das plantas apresentou maior ET como esperado.
Palavras-chave: drenagem interna, condutividade hidráulica, evapotranspiração real, tensiômetro, sistema de plantio direto
INTRODUCTION
Growing corn (Zea mays L.) without irrigation
re-quires judicious planning, so that the crop developmen-tal period coincides with favorable temperatures and an adequate amount and distribution of rainfall to en-sure good yield, with regard to water supplies.
dis-tribution of roots in the soil, favoring an efficient use of water throughout the productive process (Silva, 2007).
Soil and crop management practices have been rec-ommended in order to revert the process of physical degradation of agricultural soils, thus providing better water distribution through the soil profile. For example, alterations caused by the no-till system (NTS) in soil physical properties, particularly in structure, must cer-tainly change water behavior in the soil (Azooz & Arshad, 1996). In studies dealing with soil-plant inter-actions, it is essential to know the water movement through the soil profile, internal drainage, movement of pollutants and nutrients, retention curve, and the soil hydraulic conductivity function to prepare the soil wa-ter balance (Vieira & Castro, 1987; Pauletto et al., 1988). Determining the intensity of water entry and exit processes in a given soil volume used as control, and consequently defining the most likely periods of occurrence of a water deficit in a crop requires not only knowledge about soil and climate factors, but also about the plant, especially with regard to its phenol-ogy, which represents a starting point for a sound in-terpretation of the balance results (Cintra et al., 2000). The objective of this research was to evaluate the components of the soil water balance equation at phe-nological stages of corn crops under the NTS, when fertilized with N doses.
MATERIAL AND METHODS
Location and characterization of the field experiment The field experiment was carried out in Piracicaba, State of São Paulo, Brazil, (22°42’30"S, 47º38’00" W, 546 m altitude). According to Köppen’s international classification, the climate in the region is Cwa, also referred to as “tropical highland”. It is a mesothermal climate with a dry winter, in which the mean tempera-ture of the coldest month is below 18oC, with a mean
temperature in the warmest month above 22oC. The
average annual temperature, precipitation, and relative
humidity values are 21.1oC, 1257 mm, and 74%,
re-spectively. The dry season occurs between the months of April and September, with July as the driest month. The rainiest month varies between January and Feb-ruary, and the total amount of rainfall in the driest month does not exceed 30 mm. The soil at the site is a low base status, Loamy Typic Haplustox, locally known as “Latossolo Vermelho-Amarelo”.
The experiment was installed in the 2003/2004 crop-ping season, during which the no-till system (NTS) was implemented. Thereafter, the following crops were grown in rotation in the field experiment: corn→black oat→corn→white lupin→corn. In this research, which
aimed to evaluate soil water balance components (evapotranspiration, precipitation, and internal drainage or capillary rise), we monitored the 2004/2005 and
2005/2006 corn (Zea mays L.) cropping seasons.
Therefore, the results obtained refer to the second and third years of NTS implementation.
The experimental design consisted of randomized blocks with three replicates. Treatments consisted of
three N doses (60, 120, and 180 kg ha–1) and a
con-trol. The ammonium sulfate fertilizer was applied at 30 kg ha–1 N during seeding, and the rest was applied
as sidedressing when the plants had between six and eight leaves. Each experimental plot had an area of 36
m2 (5.0 × 7.2 m), with a distance of 2.0 m between
plots, on a ground slope of approximately 3%.
Corn (Zea mays L.) seeding, development, and soil
fertilization
The corn was seeded manually on 12/02/2004 and on 11/18/2005; emergence occurred on 12/08/2004 and on 11/23/2005; full bloom was observed on 12/ 10/2004 and on 01/19/2006; the crop was harvested on 04/06/2005 and on 03/22/2006, and grain yield was then determined. After both harvests, the crop residues were ground to simulate the action of a drum roller chopper.
Basic fertilization (phosphate and potassium) was done manually on the seeding furrow, using single su-perphosphate (90 kg ha–1 P
2O5) and KCl (50 kg ha –1
K2O). The N fertilizer was ammonium sulfate applied
manually in the seeding furrow and later as sidedressing in a shallow furrow at 0.20 m from the planting row when the corn plants had six to eight completely un-folded leaves.
Evaluations in the soil
by infiltration. After the profile was saturated with wa-ter, the plot was covered with a plastic sheet and later with straw mulch to prevent any water flux from the surface. The moment at which the plastic sheet was installed was considered as the redistribution time zero (t = 0), marking the beginning of the tensiometer read-ings, which continued for 18 days, until water move-ment practically ceased, i.e., until the tensiometer read-ings remained practically constant. Based on the ten-siometer readings, matric potential values were ob-tained. Using the retention curves determined at the same depths, we obtained water volume content val-ues as a function of redistribution time, allowing a hy-draulic conductivity equation to be written via the equa-tion:
Z t z
Z
Z dZ t K
∂ ∂ ∂ ∂ − =
∫
φθ θ) 0
( (1)
where t is redistribution time; Z is soil depth; φt is soil
water total potential, and θ is volume water content. The K(θ) function obtained after applying the method for the 0.8 m depth was:
K (θ) = 507.05e50.676(θ–0.3529) (2)
where K is expressed as mm day–1.
Soil water balance
Water balance was calculated at the three pheno-logical stages during the full cycle of the corn crops in the 2004/2005 and 2005/2006 cropping seasons, that is, stage (i): from eight leaves until tasseling; stage (ii): from flowering until milky and milky dough; and stage (iii): until harvest. This determination is based on the use of the mass conservation law, in which the alge-braic sum of water fluxes in a control volume deter-mines its changes in stored soil water, at a given time interval (Rose & Stern, 1967). Thus, the soil water balance equation can be written as:
P + 1 + D + CR + ET + R = ΔhZ (3)
where P is precipitation (mm); I is irrigation (mm); D is internal drainage (mm); CR is capillary rise (mm); ET is evapotranspiration (mm); R is runoff (mm), and
Δhz is the water storage variation (mm).
The entry of water via precipitation was computed by a pluviometer installed at the center of the field ex-periment. Because the experiment area was not irri-gated, the “I” parameter was not taken into consider-ation in the equconsider-ation. Since the water volumes collected during the rainy periods resulted in very small runoff values (the sum of all volumes collected did not reach
2 mm), the R component was also disregarded in the balance equation.
Internal drainage and capillary rise at the depth and time considered were estimated using Darcy-Buckingham’s equation, i.e.:
dZ d K
q=− (θ) φt (4)
where q is soil water flux density (mm day–1) and dφ t/
dZ is the total potential gradient.
In order to use equation (4), three Hg tensiometers were installed in each plot, one at each depth (0.7, 0.8, and 0.9 m). Thus, hydraulic conductivity was deter-mined based on the daily readings from the tensiom-eters at 0.8 m and the corresponding retention curve, using equation (2), and the gradient was determined based on the daily readings from the tensiometers at depths of 0.7 and 0.9 m.
The total potential φt (m), was calculated by
φt = –12.6H + hc (5)
since
φt = φm + φg (6)
where φgis the gravitational potential of water in the
soil, measured considering a gravitational reference lo-cated on the soil surface. Therefore, φg = -Z (m), and the matric potential φm was calculated according to the equation
φm = –12.6H + hc + Z (7)
where H (m Hg) is the manometer reading; hc (m)is
the height of the mercury reservoir in relation to the soil surface, and Z (m) is the installation depth of the
tensiometer cups.
During some days of the periods for which deter-minations were made, water flux had positive results, indicating the occurrence of capillary rise. However, for water balance purposes, the sum of the capillary rise and internal drainage components verified in the period was taken into account, and the resulting net flow cor-responded always to internal drainage.
∫
= LZ Z dZ
h
0θ( ) (8)
where θ = volume water content, and Z is the soil
depth defined for the balance, equal to 0.80 m. There-fore, hz represents water storage at the 0-Z m layer.
This integral was evaluated for Z = 0.80 m using the trapezoid rule of numerical integration (Z = 0.05 m to
0.80 m), assuming the same value of θ used in Z =
0.05 m for the Z layer = 0.0-0.05 m, resulting in the following expression:
h0.0–0.80=[(θ0.05 + θ0.10 + 2θ0.20 + θ0.30)0.05 + (θ0.30 + 2θ0.50
+ θ0.70)0.10 + (θ0.70 + θ0.80)0.05] (9)
Using the water storage values obtained for the limit dates of each period of the soil water balance, we ob-tained water storage variation Δhz, calculated by:
(
)
zt
t Z
h dt dz t
j
i
Δ = ⎥⎦ ⎤ ⎢⎣
⎡
∫
∂ ∂∫
/0 θ (10)
where Δhz is soil water storage variation in time
pe-riod tj – ti.
Evapotranspiration was determined by difference, i.e., it was considered the unknown quantity of the equation, since the other terms of the equation were determined according to the methodologies described above.
Statistical analysis
Due to the characteristics of the phenomenon, means among treatments were compared using Tukey’s test (p = 0.05). Regression analysis was
per-formed on the relationship between grain yield and ni-trogen doses. The SANEST statistical software was used (Zonta & Machado, 1980).
RESULTS AND DISCUSSION
Internal drainage and precipitation
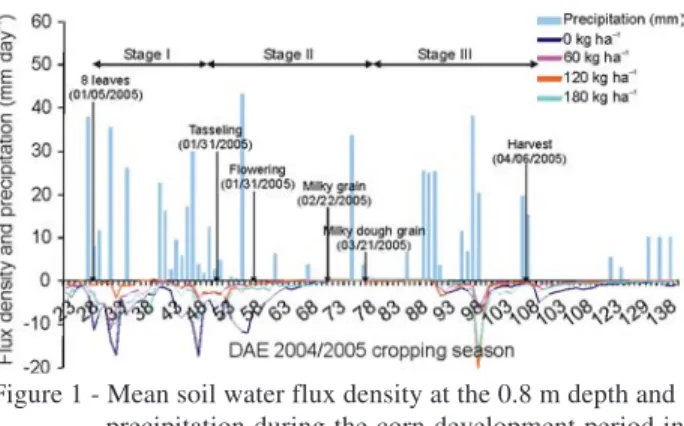
Regardless of N doses, the mean values for soil water flux density and precipitation observed dur-ing the first and second corn croppdur-ing seasons (2004/2005 and 2005/2006, respectively) had a variation behavior pattern, with high values under greater precipitation (Figures 1 and 2). This occurs at high precipitation intensities, especially in sandy soils, allowing rapid water fluxes through the soil profile (Gaiser et al., 2004). In addition, the treat-ments that received N doses had the smallest flux density values in the seasons with the highest wa-ter demand in corn, i.e., tasseling (stage I), and flowering and grain filling (stage II), which could be translated as absorption by the plants, since smaller water storage variation values were ob-served.
Considering the internal drainage observed throughout the cropping season (sum of daily flux densities), at all stages evaluated, except at stage I during the second cropping season, there were no dif-ferences between N doses, except in relation to the control, which had greater drainage (Table 1). The higher internal drainage value in the control could be the result of higher soil water storage as compared with other treatments, because of lower demand by the crop.
In both corn cropping seasons, all N doses pro-vided smaller internal drainage values relative to the control at the various stages, i.e., smaller descending water movement through the soil, possibly because there was a greater amount of water absorbed by the plants under those treatments, since water storage variation was smaller at those doses in stages I and II during the second cropping season, also with a ten-dency of smaller values in those treatments during the first cropping season studied. These results are in agreement with the evapotranspiration values obtained (Table 3), which were higher at the doses mentioned in the stages studied during both corn cropping sea-sons. In addition, because the soil has been used un-der the NTS, it is believed that the N doses applied improved root development, thus modifying the soil’s physical conditions via an increase in organic matter, resulting in greater water retention.
Figure 2 - Mean soil water flux density at the 0.8 m depth and precipitation during the corn development period in the 2005/2006 cropping season.
Stage I: 8 leaves until tasseling; stage II: from flowering until milky and milky dough; stage III: until harvest. Means in the same column, followed by common letters do not differ (Tukey’s test, p < 0.05).
Table 2 - Soil water storage variation at corn phenological stages during the 2004/2005 and 2005/2006 cropping seasons as a function of N doses.
e s o
D StageI StageII StageIII
n o s a e S g n i p p o r C 5 0 0 2 / 4 0 0 2 a h g
k –1 ----------------------------------------- mm----------------------------------------
-0 234.17a 114.14 a 55.48a
0
6 81.28b 33.52 b 10.27b
0 2
1 46.87b 56.18 b 17.83b
0 8
1 107.72b 37.19 b 21.10b
n o s a e S g n i p p o r C 6 0 0 2 / 5 0 0 2
0 114.01a 299.86 a 103.62a
0
6 88.52a 126.13 b 52.56b
0 2
1 62.61a 168.19 b 36.68c
0 8
1 73.91a 140.39 b 18.18d
Table 1 - Internal soil water drainage at corn phenological stages during the 2004/2005 and 2005/2006 cropping seasons as a function of N doses.
Stage I: 8 leaves until tasseling; stage II: from flowering until milky and milky dough; stage III: until harvest. Means in the same column, followed by common letters do not differ (Tukey’s test, p < 0.05).
Precipitation values of 247.5, 251.4, and 72.8 mm were observed in the 2004/2005 cropping season at stages I, II, and III, respectively. In the following crop-ping season, rainfall amounts were 246.2, 326.8, and 104.5 mm at stages I, II, and III, respectively, which could justify the higher internal drainage in stage II during the 2005/2006 cropping season.
Soil water storage variation
The 2004/2005 cropping season produced negative water storage values (Table 2) without difference in any of the three periods evaluated. Rains were not sub-stantial during that period (Figure 3), which contrib-uted toward negative soil water storage. In addition, the crop provided further soil shading during that stage,
which may have made it more difficult for the water to penetrate the soil, thus decreasing storage. The smaller value observed for water storage variation in the 2004/2005 corn cropping season was obtained at 56 days after corn emergence (DAE) (Figure 1) that is, at stage II (during full bloom), the season with the highest water demand and maximum absorption of nutrients by the plants.
In the 2005/2006 cropping season there was a crease in water storage as N increased in the crop de-velopmental stages I and II (Table 2). This could be due to enhanced rooting provided by N (Pandey et al., 2000). However, at stage III, when water intake de-creased, water storage variation had an inverse behav-ior relative to the initial stages of development. In the
e s o
D Stage I Stage II Stage III
n o s a e S g n i p p o r C 5 0 0 2 / 4 0 0 2 a h g
k –1 ----------------------------------------- mm----------------------------------------
-0 -21.68a -39.23a -20.22 a
0
6 -29.36a -39.47a -15.43 a
0 2
1 -37.91a -41.12a -20.62 a
0 8
1 -41.60a -41.93a -16.11a
n o s a e S g n i p p o r C 6 0 0 2 / 5 0 0 2
0 56.22a -14.84a -13.54 b
0
6 40.78b -18.55ab -12.11ab
0 2
1 45.20b -22.41ab -9.35 a
0 8
crop developmental stages I and II there is greater de-mand for nutrients and soil water to meet the needs created by the increased growth rate (Ritchie et al., 2003).
Studies have shown the effects of N and irrigation on water utilization by corn and demonstrated that at 50 DAE there was a decrease in soil water content
when the highest N dose (100 kg ha–1) was applied
(Ogola et al., 2002). In the same cropping season, the smallest storage variation values (Figure 4) comprised the 11 days from emergence until the dough grain stage (78 DAE); however, positive soil water storage val-ues were obtained in all doses only at stage I, indicat-ing that the amount of rainfall was sufficient to sup-ply the crop’s water requirements. In addition, an im-proved soil water storage is expected under the NTS due to the structural changes that occur during the soil’s adaptation to reduced management and to the mulch that remains on the soil. Su et al. (2007) inves-tigated the effects of conservation tillage practices on
soil water storage, and verified that the highest water storage value after six years was obtained under NTS. Different results were obtained by Silva et al. (2006), who observed greater water storage under the con-ventional than in the NTS. Nevertheless, the latter was more efficient in terms of available stored water for the plants.
Evapotranspiration
In both corn cropping seasons, evapotranspiration was not affected by N doses, except in relation to the control (Table 3), in all of the crop’s developmental stages, except for stage I in the second cropping sea-son, since there was no difference for water storage variation during that stage. These results suggest that the N doses improved root development in the corn plants, allowing better water extraction from the soil layer exploited (Ogola et al., 2002).
In the 2004/2005 cropping season, due to both re-duced precipitation and water distribution during the
Table 3 - Evapotranspiration at corn phenological stages during the 2004/2005 and 2005/2006 cropping seasons as a function of N doses.
Stage I: 8 leaves until tasseling; stage II: from flowering until milky and milky dough; stage III: until harvest. Means in the same column, followed by common letters do not differ (Tukey’s test, p < 0.05).
e s o
D StageI StageII StageIII
n o s a e S g n i p p o r C 5 0 0 2 / 4 0 0 2
a h g
k –1 ----------------------------------------- mm----------------------------------------
-0 35.01b 186.49b 48.98b
0
6 195.58a 257.36a 77.55a
0 2
1 238.52a 236.34a 75.60a
0 8
1 173.10a 256.14a 67.80a
n o s a e S g n i p p o r C 6 0 0 2 / 5 0 0 2
0 75.96a 41.78b 10.17b
0
6 116.91a 219.54a 64.05a
0 2
1 138.38a 181.01a 77.16a
0 8
1 130.31a 214.76a 93.92a
Figure 3 - Variation in soil water storage and precipitation during the development period of a corn crop at the 0.0-0.8 m layer in the 2004/2005 cropping season.
grain filling period (Figure 1), which probably led to smaller grain yield results at those doses relative to the following cropping season (Figure 5), the higher ET values could be related to negative water storage val-ues (Table 2), since internal drainage was smaller at those doses (Table 1).
Precipitation was high in the 2005/2006 cropping season, with positive soil water storage at least dur-ing stage I; in the other stages, water storage varia-tion was relatively higher than in the first cropping sea-son. According to studies by Zhang et al. (2004) about the effect of soil water content on ET, wheat and corn productivity, and water use efficiency, soil water deficit has a decreasing impact on ET and vice-versa. In ad-dition, soil water storage and precipitation are factors that influence ET (Farré & Faci, 2006). Ogola et al. (2002) verified that the effect of N doses on ET was higher in experiments with irrigation (adequate soil water content) than in experiments without irrigation. Consequently, all water supplied to the crop in the sec-ond cropping season was used, in spite of losses by internal drainage. This also implies that N doses seemed to have provided good root development of plants with reference to water extraction from the soil layer un-der study.
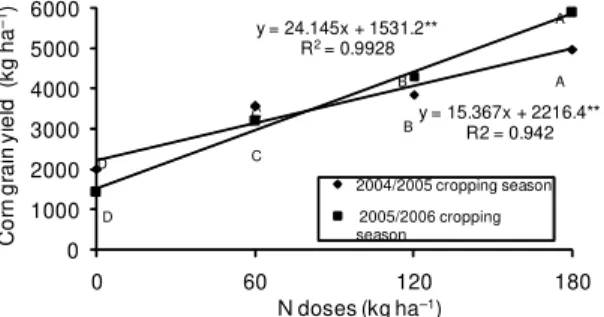
ET was higher in stages I and II, in both cropping seasons, especially in stage II, demonstrating that a higher demand for nutrients and soil water occurs dur-ing this crop development period to meet the require-ments of an increased growth rate (Ritchie et al., 2003). Therefore, these ET results are in agreement with the results obtained for grain yield in both crop-ping seasons studied, since the latter was positively correlated with corn grain yield.
REFERENCES
AZOOZ, J.H.; ARSHAD, M.A. Soil infiltration and hydraulic conductivity under long-term no-tillage and conventional tillage systems. Canadian Journal of Soil Science, v.76, p.143-152, 1996.
CINTRA, F.L.D.; LIBARDI, P.L.; SAAD, A.M. Balanço hídrico no solo para porta-enxertos de citros em ecossistema de Tabuleiro Costeiro. Revista Brasileira de Engenharia Agrícola e
Ambiental, v.4, p.23-28, 2000.
FARRÉ, I.; FACI, J.M. Comparative response of maize (Zea mays
L.) and sorghum (Sorghum bicolor L. Moench) to deficit irrigation in a Mediterranean environment. Agricultural
Water Management, v.83, p.135-143, 2006.
GAISER, T.; DE BARROS, I.; LANGE, F. M.; WILLIAMS, J.R. Water use efficiency of a maize/cowpea intercrop on a highly acidic tropical soil as affected by liming and fertilizer application.
Plant and Soil, v.263, p.165-171, 2004.
LIBARDI, P.L. Dinâmica da água no solo. 2.ed. São Paulo: Editora da Universidade de São Paulo, 2005. 329p.
OGOLA, J.B.O.; WHEELER, T.R.; HARRIS, P.M. Effects of nitrogen and irrigation on water use of maize crops. Field Crops
Research, v.78, p.105-117, 2002.
PANDEY, R.K.; MARANVILE, J.W.; ADMOU, A. Deficit irrigation and nitrogen effects on maize in a Sahelian enviroment. I. Grain yield and yield components. Agricultural Water
Management, v.6, p.1-13, 2000.
PAULETTO, E.A.; LIBARDI, P.L.; MANFRON, P.A.; MORAES, S.O. Determinação da condutividade hidráulica de solos a partir da curva de retenção de água. Revista Brasileira de Ciência
do Solo, v.12, p.89-195, 1988.
ROSE, C.W.; STERN, W.R. Determination of withdrawal of water from soil by crop roots as a function of depth and time.
Australian Journal of Soil Research, v.5, p.11-19, 1967.
RITCHIE, S.W.; HANWAY, J.J.; BENSON, G.O. Como a planta de milho se desenvolve. Informações Agronômicas,v.103, p.1-19. 2003.
SILVA, M.M.; ALVES, M.C.; SOUSA, A.P.; FERNANDES, F.C.S. Impacto do manejo nos atributos físico-hídricos de um Latossolo Vermelho sob cerrado, no município de Selvíria, Estado do Mato Grosso do Sul. Acta Scientiarum Agronomy, v.28, p.13-22, 2006.
SILVA, M. M. Balanço de água no solo com milho sob sistema plantio direto e diferentes doses de nitrogênio. Piracicaba: USP/ ESLAQ, 2007. 86p.Tese (Doutorado)
SU, Z.; ZHANG, J.; WU, W.; CAI, D.; LU, J.; JIANG, G.; HUANG, J.; GAO, J.; HARTMANN, R.; GABRIELS, D. Effects of conservation tillage practices on winter wheat water-use efficiency and crop yield on the Loess Plateau, China.
Agricultural Water Management, v.87, p.307-314, 2007.
VIEIRA, S.R.; CASTRO, O.M. Determinação, em laboratório, de curvas de retenção de água com tensiômetros. Revista
Brasileira de Ciência do Solo, v.11, p.87-90, 1987.
ZHANG, Y.; KENDY, E.; QIANG, Y., CHANGMING, L.; YANJUN, S.; HONGYONG, S. Effect of soil water deficit on evapotranspiration, crop yield, and water use efficiency in the North China Plain. Agricultural Water Management, v.64, p.107-122, 2004.
ZONTA, E.P.; MACHADO, A.A. SANEST – Sistema de Análise
Estatística. Piracicaba: USP/ESALQ, 1980. (Software).
WATSON, K.K. An instantaneous profile method for determining the hydraulic conductivity of unsaturated porous materials.
Water Resources Research, v.2, p.709-715, 1966.
Figure 5 - Regressions for corn grain yield in the 2004/2005 and 2005/2006 cropping seasons. **significant at 1% level.
y = 15.367x + 2216.4** R2 = 0.942 y = 24.145x + 1531.2**
R2= 0.9928
0 1000 2000 3000 4000 5000 6000
0 60 120 180
C
o
rn g
rai
n y
ie
ld
(
k
g
ha
–1
)
N doses (kg ha–1)
2004/2005 cropping season 2005/2006 cropping season
A
B
C
D D
C
B
A