Ion-Polymer Interaction Analysis: an Inversion Of NMR Spin Echo Experimental Data
Rita C.O. Sebasti˜ao∗ and Jo˜ao P. Braga
Universidade Federal de Minas Gerais, Instituto de Ciˆencias Exatas, Departamento de Qu´ımica, Av. Antˆonio Carlos, 6627, BH-MG, 31270-901
Luciano S. Virtuoso and Karla A.S.F. Vello
Universidade Federal de Alfenas, Centro de Ciˆencias Exatas, Curso de Qu´ımica, Rua Gabriel Monteiro da Silva, 700, Alfenas-MG, 37130-000
Carlos N. Pacheco
Princeton University, Department of Chemistry, Princeton, 08544-1009, USA
Luis H.M. da Silva
Universidade Federal de Vic¸osa (UFV), Departamento de Qu´ımica Av., P.H. Rolfs, sn, Vic¸osa-MG, 36370-000
(Received on 20 July, 2010)
A methodology for ion-polymer interaction estimation is discussed in the present work. This method is based on the inversion of experimental spin echo NMR data using Hopfield neural network to retrieve transverse re-laxation time distributions. The adopted model systems consist of aqueous solutions of poly (ethylene oxide), molar mass 1500, 4000 and 35000 g mol−1and sodium nitroprusside (NP) at different concentrations. Dipolar interaction is investigated in this work through the reduction in the transverse relaxation time and increase in the area under the distribution curves of the PEO protons which presented a linear correlation with the NP con-centration. Neural network results were compared with the Simplex optimization procedure and experimental NMR values. The proposed methodology is robust, stable, non restrictive in relation to the system and more efficient to handle experimental data.
Keywords: Interaction ion-polymer; Ill-posed inverse problem; Neural network; Transverse relaxation time distribution.
1. INTRODUCTION
Nuclear Magnetic Resonance (NMR) relaxometry is a very useful tool for understanding chemical and physical phenomena in complex multiphase systems. In special, works in the literature confirm the transverse relaxation function is more sensitive to structural changes than the spin-lattice relaxation and self-diffusion measurements [1-3]. Chemical environment induces the formation of isochro-mats, a physical concept that means an infinitesimal ensem-ble with the same frequency. The spin echo decay data can be obtained by the Carr-Purcell-Meiboom-Gill – CPMG se-quence pulse, which refocuses these magnetizations and ac-quires information on molecular dynamics throughout the transverse relaxation time,T2. This important parameter can be used to indirectly measure properties of organic liquid and soft-solid samples [4].
To analyze a sample through NMR relaxometry, it is cru-cial to obtain a reliable deconvolution ofT2components from the discrete and noisy decaying echo signal. This is es-sentially an ill-conditioned inverse problem [5-9] and needs robust mathematical treatment to be solved. Hopfield neu-ral network, adapted to inverse problem methodology [6,7], were used in the present work to obtainT2distributions from spin echo NMR experimental data [10] in aqueous solutions of poly(ethylene oxide) and sodium nitroprusside.
Natural or synthetic water-soluble polymers are widely ap-plied in technological areas such as biotechnology, pharma-ceuticals and adhesives [11,12]. This number of applications
∗Electronic address:[email protected]
has increased considerable, and polymers are expected to be the main product demanded by industrially developed so-cieties [13]. Nevertheless, the expansion of research needs physicochemical data of macromolecular aqueous solutions, as well as the development of models to relate experimental data with molecular interaction parameters. This is an im-portant step for understanding more complex formulations requested by the numerous technical applications.
The establishment of a systematic and effective method-ology for quantitative evaluation of ion-polymer interaction in aqueous media is proposed in this work. This methodol-ogy is not restricted to a specific system and provides a wide range of applications, such as data processing in the brain tissue for the diagnosis of multiple sclerosis [8], kinetic con-stants inversion from absorbance measurement [14] and data processing of scattered light [15-17].
2. THEORETICAL BACKGROUND
2.1. Relaxation process in a system of two spins
Dipole-dipole interaction consists in a spin particleI inter-acting with a magnetic field generated by another spin parti-cleS. The Hamiltonian of this interacting pair is [18]
H′=−h
2
R3γIγS[3(I·n) (S·n)−I·S] (1)
along thezdirection. In this case, the non-perturbed Hamil-tonian is composed by the motion of the particles, HM, and the Zeeman energies for each spin, so that
H=HM−~B0γIIz−~B0γSSz+H ′
For spins of value 1/2, according to its magnetic moments, the longitudinal components of IZand SZare
IZ |+i = + 1 2|+i
IZ |−i= − 1
2 |−i (2)
SZ |+i= + 1 2 |+i
SZ |−i= − 1 2 |−i
From this, it can be established four eigenstates |+i |+i; |+i |−i; |−i |+iand| −i| −i with the respec-tive population numbers N++; N+−; N−+ and N−−. Tran-sitions between these eigenstates are possible through the transitions probabilitiesω0,ω1, ω′1andω2 respectively, as represented in the diagram of Figure 1.
FIG. 1: Diagram of transition probabilities among the eingestates of a dipole-dipole interaction.
The longitudinalT1relaxation time calculation was firstly carried out by Abragam and Pound [19]. In 1955, Solomon
[18] has extended this methodology to transverse relaxation time calculation,T2, by considering interacting pairs of like spins, nuclei in paramagnetic solution and interacting unlike spins. For this, a new basis set is defined in similarity with the equation (2) as
Ix |αi = + 1 2 |αi
Ix |βi = − 1
2 |βi (3)
Sx |αi= + 1 2 |αi
Sx |βi= − 1 2 |βi
In this base, four states
|αi |αi; |αi |βi; |βi |αiand |βi |βi are also established, with their occupation number Nαα; Nαβ; Nβα and Nββ and transition probabilities per unit of time u0,u1,u′1and u2, respectively. However, these states are not eigenstates of en-ergy and the base must be defined from its orthogonal states expansion in the eigenvectors of energy, |+iand |−i as
|αi=
1 √ 2
[|+i+|−i]
|βi=
1 √ 2
[|+i− |−i]
Additionally, although the basis set of equation (3) can be assumed, the experimentally observable quantities are the z-components of the macroscopic magnetizations, Izand Sz, being proportional to
(N+++N+−)−(N−++N−−) =KIz
(N+++N−+)−(N+−+N−−) =KSz (4)
To develop this equation, one can consider the kinetic pro-cess of the eigenstates transition:
dN++ dt =−
ω1+ω ′ 1+ω2
N+++ω′1N+−+ω1N−++ω2N−−+c
dN+− dt =ω
′ 1N++−
ω0+ω ′ 1+ω1
N+−+ω0N−++ω1N−−+c
dN−+
dt =ω1N+++ω0N+−−
ω0+ω ′ 1+ω1
N−++ω
′
dN−
dt =ω2N+++ω1N+−+ω ′ 1N−+−
ω1+ω ′ 1+ω2
N−−+c
Substituting equations (5) in the derivative form of equa-tion (4) we get:
dIZ
dt =−(ω0+2ω1+ω2) IZ−I0
−(ω2−ω0) (SZ−S0)
dSZ
dt =−(ω2−ω0) IZ−I0
−(ω0+2ω1+ω2) (SZ−S0) (6)
withI0andS0being the equilibrium magnetization of spins IandS.
For the transverse components, Ixand Sx, in the basis set of equations (3), the calculation method is identical [18]. We have only to substitute the probabilities of transitions and the occupation numbers of the states, getting the equations
dIx
dt=−(u0+2u1+u2)Ix−(u2−u0)Sx
dSx
dt =−(u2−u0)Ix−(u0+2u1+u2)Sx (7)
In the present work, nuclei in paramagnetic solution are studied. For this case, the relaxation process of a nu-clear spin, I , when paired with an electronic spin, S, of a paramagnetic ion is a consequence of the dipole-dipole interaction, H′. In contrast, for the electronic spin, this pro-cess is negligible and we have to consider Sz=S0and Sx=0, which causes a simple decay in equation (7), with the relax-ation time:
1 T2
=u0+2u1+u2 (8)
The transition probabilities are calculated by perturbation theory in first order, as in reference [18] and the transverse relaxation time of spins in paramagnetic solutions can be de-scribed by
1 T2
=h
2γ2
Iγ2S
r6 τc (9)
beingrthe interatomic distance andτc the rotational corre-lation time, or the characteristic time of a particle in solution on Brownian rotation diffusion movement.
2.2. The spin echo theory
The nuclear spin angular frequency, i.e. the Larmor fre-quency, is represented as [19,20],
ω(r) =−γB(r) (10)
in whichγis the magnetogyric ratio andB(r)the local mag-netic field. Due to spin-spin interactions, neighboring nu-clei have different local fields and different frequencies. The
spins can be refocused, forming an echo, by applying a hard 1800pulse of radio-frequency after a hard 900pulse in rela-tion to the total magnetizarela-tion vector. This experiment was first verified by E.L. Hahn in 1949, after the initial discovery of NMR [20]. From this experiment, two important prop-erties can be obtained: relaxation time and diffusion coeffi-cient [21].
Decrease of coherence produces a magnetization decaying curve in each echo time, t, from which the transverse relax-ation time [19-23],T2, can be calculated. Nevertheless, dis-tribution ofT2components reflects the several spin-spin re-laxation processes occurring inside the matter. The concept ofT2distribution is useful since there will be a set of isochro-mats acting in the relaxations process. Under these theoret-ical considerations a singleT2component is not possible, as in equation (9), but rather its distribution. Consequently one has to deal with multipleT2components, resulting in a total magnetization function [21]:
Ixy=
∑
P(λi)exp(−tλi) (11)withλi=1/T2i, the decay rate for each process and P(λi) its
corresponding probability.
For a continuous distribution of transverse relaxation times and the probability density function [6], f(λ) =
P(λ)
dλ, this equation can be written as
Z
K(t,λ)f(λ)dλ=I(t) (12) in whichI(t)is the signal intensity measured at the spin echo time, t, andK(t,λ) =exp(−tλ) the kernel of the process. Equation (12) is a Fredholm integral equation of first or-der [20-22] used to calculate the relaxation time distribution function by a deconvolution process. Presence of noisy in the available data for the echo signal will make the inverse calculation of f(λ)an inverse ill-posed problem. Therefore, one has to use robust and stable methods to solve this kind of problem. In this work, Hopfield neural network method-ology was chosen [6,7].
2.3. Neural Network background
In the neural network approach, nervous impulse simula-tion is performed applying a transfer funcsimula-tion,φ, in the neu-ron states,u. The activated values are propagated in the net-work during a learning time until a convergence criteria is reached. For this, an energy function is defined as [6]
E=1 2
m
∑
j=1
(Pcal,j−Pexp,j)2 (13)
withPcalandPexpthe calculated and experimental properties, respectively.
Calculated spin echo decay curve, thePcalproperty, is
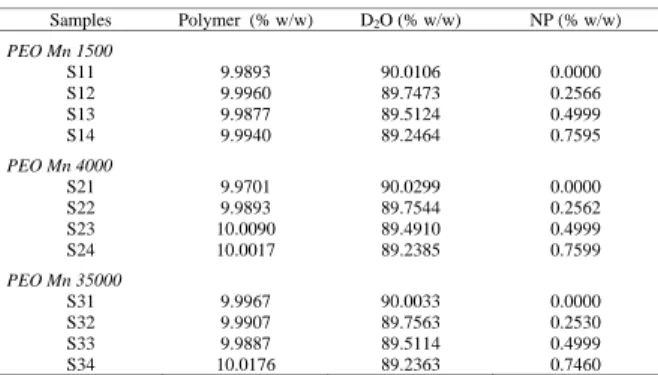
TABLE 1: Sample compositions.
Samples Polymer (% w/w) D2O (% w/w) NP (% w/w)
PEO Mn 1500
S11 9.9893 90.0106 0.0000 S12 9.9960 89.7473 0.2566 S13 9.9877 89.5124 0.4999 S14 9.9940 89.2464 0.7595
PEO Mn 4000
S21 9.9701 90.0299 0.0000 S22 9.9893 89.7544 0.2562 S23 10.0090 89.4910 0.4999 S24 10.0017 89.2385 0.7599
PEO Mn 35000
S31 9.9967 90.0033 0.0000 S32 9.9907 89.7563 0.2530 S33 9.9887 89.5114 0.4999 S34 10.0176 89.2363 0.7460
during the learning time,τ. In this case, the activated neurons in the network represent thef(λ)curve. Thus, the derivative of the energy function is written as, [24]
dE dτ =
n
∑
i=1
m
∑
j=1
ej
∂(Pcal)j
∂φi
∂φi
∂ui
dui
dτ
(14)
in whichnis the number of neurons andej=∑mj=1(Pcal,j−
Pexp,j). This is also the number of points retrieved in the
transverse relaxation functionf(λ)from the inversion process of themexperimental data.
The neural network convergence is assured by the error function decreasing with the learning time. For this, two con-ditions in the algorithm have to be imposed. The first one is establish
dui
dτ =−
m
∑
j=1
∂(Pcal)j
∂φi
ej (15)
transforming (14) in
dE dτ =−
n
∑
i=1
∂φi
∂ui
du
i
dτ
2
(16)
The transfer function as an increasing function of the neu-ron states, i.e.∂φ
∂u>0, which will implydEdτ <0, is the sec-ond csec-ondition to be assumed.
As the learning process is carried out, several solutions are possible to be found. Nevertheless, this neural network approach, as a consequence of the decreasing error, provides the one which best reproduces the experimental property.
Solution of Hopfield differential equations were obtained by integrating equations (15) using a fourth order Runge-Kutta method [25]. From an initial guess, the stopping con-dition of the integration process occurs if the error function reaches the minimum value, i.e.dui
dτ=0.
3. EXPERIMENTAL SECTION
To determine experimentally the relationship between the transverse relaxation time and interaction of poly(ethylene oxide) (PEO) and sodium nitroprusside (NP) inD2O, samples containing different compositions of mixtures of these three components were prepared according to Table 1.
The poly(ethylene oxide), PEO (average molecular mass of 1500, 4000 and 35000 g mol−1), were ob-tained from Sigma (USA). The Merck (Germany) salt,
Na2[Fe(CN)5(NO)] (99.0%) was of analytical grade and used without any further purification. Aqueous solutions of the polymer and nitroprusside (NP) were prepared in the con-centrations of 10 %(w/w) in polymer and in the range of 0.00 to 0.75% (w/w) in NP. The samples were kept at 20◦C for 3 days before the measurements. The spin echo experimental data were obtained on a Bruker 400 MHz NMR spectrometer with the CPMG sequence pulse.
4. RESULTS AND DISCUSSION
The assumption of transverse relaxation time distribution as a property to characterize the PEO-NP interaction is made in the present work. An specific enthalpic interaction among poly(ethylene oxide) segments and [Fe(CN)5NO]2− anion has been demonstrated, using FTIR measurements and phase partitioning behavior in Aqueous Two Phase Systems. [26] The initial dipole-dipole interaction between the PEO pro-tons is perturbed by salt addition. Since the NP salt contains Fe (III), the electron-nucleus dipolar interaction is a more effective mechanism, causing a reduction in relaxation time of the PEO protons, as can be seen in equation (9). Thus, changes in transverse relaxation time distributions of PEO protons in aqueous medium and ionic different concentra-tions were verified.
Four sets of experiments were performed with mixtures composed of polymers with different molecular weights (PEO 1500, 4000 and 35000 g mol−1) in fixed concentra-tion of approximately 10.00% w/w and sodium nitroprusside at different concentrations (0.00, 0.25, 0.50 and 0.75% w/w), as described in Table 1.
The relaxation time distribution is obtained by numerical integration of activated neuron states, equation (15), which requires an initial condition to be solved. In this work, In-verse Laplace Transform (ILT) [21] is used as initial guess for the neural network inputs. Although the ILT is used in a routine way to invert NMR echo data, its results can be considerable improved. As shown in references [6,7,21] the neural network has the property of reduce the residual error in an optimization problem. Therefore, one may use the ILT as a first approximation to obtain better results, with lower residual errors. This will provide additional and more accu-rate results for the experimentalists.
To check the consistency of the computational method, simulated data is given to the network together with an exact initial guess; in this case activated neuron states is constant in the learning time, showing the methodology is appropri-ate to invert the data. Stability of the Hopfield neural network method was tested against errors in the simulated data. For errors up to 30% this approach was able to return results in fair agreement with the original data, showing the robustness of this inversion process to handle experimental error.
TABLE 2: Transverse relaxation time and area under the distribution function for the samples.
Samples Neural Network T2 (s)
Area under
peak / 10-3 Simplex T2 (s) Experimental T2 (s) S11 0.6095 1.185 0.5932 0.5937 S12 0.5867 1.227 0.5730 0.5730 S13 0.5714 1.270 0.5547 0.5544 S14 0.5479 1.300 0.5417 0.5415
S21 0.6027 1.201 0.5839 0.6004 S22 0.5867 1.221 0.5709 0.5716 S23 0.5633 1.258 0.5521 0.5532 S24 0.5432 1.313 0.5299 0.5084
S31 0.6027 1.187 0.5648 0.5670 S32 0.5714 1.251 0.5620 0.5626 S33 0.5469 1.321 0.5503 0.5506 S34 0.5120 1.356 0.5185 0.5193
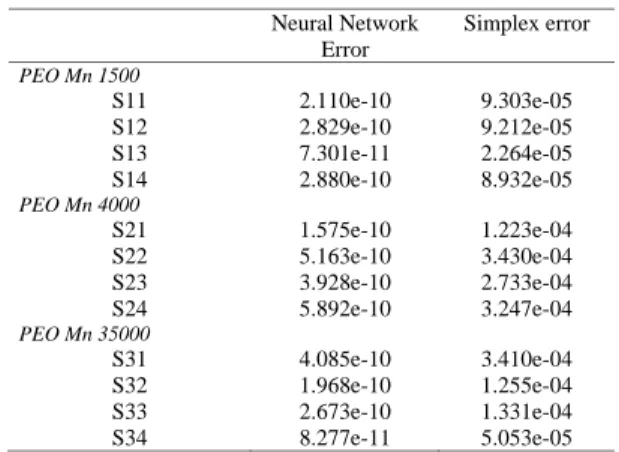
TABLE 3: Neural network and Simplex error comparison for spin echo decay adjustment.
Neural Network Error
Simplex error
PEO Mn 1500
S11 2.110e-10 9.303e-05
S12 2.829e-10 9.212e-05
S13 7.301e-11 2.264e-05
S14 2.880e-10 8.932e-05
PEO Mn 4000
S21 1.575e-10 1.223e-04
S22 5.163e-10 3.430e-04
S23 3.928e-10 2.733e-04
S24 5.892e-10 3.247e-04
PEO Mn 35000
S31 4.085e-10 3.410e-04
S32 1.968e-10 1.255e-04
S33 2.673e-10 1.331e-04
S34 8.277e-11 5.053e-05
TABLE 4: Linear correlation index in: (a) Relaxation time versus NP concentration curves and (b) Area under the distribution curves
versus NP concentration.
Sample Set r (a) r (b)
S1 0.9977 0.9962
S2 0.9970 0.9796
S3 0.9979 0.9919
Distribution functions calculated by the neural network for the PEO 1500 system with 0%, 0.2566%, 0.4999% and 0.7595% NP is presented in Figure 2. Peak distributions are appropriately described by a set of 32 neurons, which cor-responds also the base size. Residual error is smaller if a multiple components ofT2 is adopted, as can be confirmed in Table 3. This also indicates equation (12) is appropriate to describe this problem, contrary to individual analysis of the components.
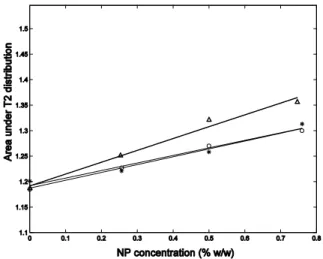
Integrals over the distributions are proportional to the number of spins in similar dynamic behavior [21,27]. In Ta-ble 2 it is also presented the area under the distributions of all systems. One can verify the area is directly proportional to NP concentration. This can be attributed to the extension of the ion-polymer interaction, once larger NP concentration affects an equally larger number of PEO protons. Figures 3 and 4 show linear correlations among NP mass concentration andT2 parameter and the area under the distribution func-tions, respectively. Table 4 shows the correlation index to this assumption.
According to Brereton et.al. [2,3], the problem
formu-FIG. 2: Neural network transverse relaxation time distribution for PEO 1500: (+) 0% NP, (o) 0.2566% NP, (*) 0.4999% NP and (∆) 0.7595% NP.
FIG. 3: Transversal relaxation time and NP concentration (%w/w) linear correlation. The symbols are for the set of samples: (o) s1, (*) s2 and (∆) s3.
lation with Polyethylene melts at low molecular weights (<1700 g mol−1) is relatively simple since the spin echo de-cay curve shows a single-exponential behavior from which T2can be assigned. At higher molecular weights the NMR decay curve is non exponential and clearly reflects a more complex dynamics. The present study confirms that the re-fined treatment could reflect not only the polydispersity ef-fects but also the differential dipolar interaction resulting from the anisotropic motion of the polymer chains on the NMR time scale.
interaction extension.
The experimental echo decay curves were also analyzed by the simplex optimization method. This method is ana-logue to one usually adopted by the NMR equipments, which treats the problem as an adjustment of the experimental data by one exponential curve [28,29]. The experimental and sim-plex results obtained are shown in Table 2. At this point one can also note the better residual error results of the neural network methodology in comparison with the simplex algo-rithm, as presented in Table 3.
FIG. 4: Area under the T2 distribution and NP concentration (%w/w) linear correlation. The symbols are the same as in figure 2.
5. CONCLUSION
The combination of the inverse problem methodology and intermolecular forces analysis was applied to ion-polymer interaction estimation using experimental NMR spin echo data. The adopted model systems consist of aqueous solu-tions of poly (ethylene oxide) and sodium nitroprusside (NP) at different concentrations.
This inversion methodology provides T2 distributions of the components, which reflects the several spin relaxation processes occurring inside the matter. Under these theoret-ical considerations, the obtained results show smaller resid-ual errors in comparison with the simplex optimization pro-cedure and experimental NMR equipment software. This fact is important to confirm the effectiveness of the proposed methodology.
The system responses also allow a linear correlation among the nitroprusside concentration and the transverse re-laxation time, together with the PEO protons amount in the similar dynamic behavior. This linear correlation is proposed here as a quantitative approach for ion-polymer interaction estimation in aqueous solutions. Finally, the PEO molecu-lar weight dependence in the transverse relaxation time and the area under the distribution curves shows the angular cor-relation is an individual characteristic of each material, as verified for the response of all sample sets.
Acknowledgement
This work was supported by PRPq, Fapemig and CNPq.
[1] S. Ghosh, K.M. Keener, Y. Pan. J. Magn. Reson.191, 226 (2008).
[2] M. G. Brereton. Macromolecules23, 1119 (1990).
[3] M. G. Brereton, I. M. Ward, N. Boden, P. Wright. Macro-molecules24, 2068 (1991).
[4] R.I. Chelcea,; R. Fechete, E. Culea, D.E. Demco, B.Blmich. J. Magn. Reson.196, 178 (2009).
[5] Hadamard, J.; Le probleme de Cauchy et les equations aux derivees partielles lineaires hyperboliques, Hermann: Citypla-ceParis, 1932.
[6] Hopfield, J.J.;Proc. Natl. Acad. Sci.81-10, 3088 (1984). [7] Hopfield, J.J.; Tank, D.W.;Biol. Cybern.52, 141 (1985). [8] R.C.O. Sebasti˜ao, C.N. Pacheco, J.P.Braga, D.Pil-Veloso. J.
Magn. Reson.182, 22 (2006).
[9] R.C.O. Sebasti˜ao, J.P.Braga, C.N. Pacheco. Ann. Magn. Re-son.4, 1-2, 17 (2005).
[10] K.P. Withall. J. Magn. Reson.84,134 (1999).
[11] S. J. Huang, T. A. Seery, G.Swift. J. Macromol. Sci. Pure A
7, 36 (1999).
[12] J. H. Guo, G. W. Skinner, W. W. Harcum, P. E. Barnum. Pharm. Sci. Technol. Today6, 254 (1998).
[13] F. Lo, J. Petchonka, J. Hanly. J. Chem. Eng. Prog.55, 7 (1993). [14] N.H.T. Lemes, E. Borges, J.P. Braga, Chemom. Intell. Lab.
Syst.96, 84 (2009).
[15] L.S. Virtuoso, R. C. O.Sebasti˜ao, J.P. Braga, L.H.M. Da Silva.
Int. J. Quant. Chem.1062731 (2006).
[16] R.C.O. Sebasti˜ao, N.H.T. Lemes, L.S. Virtuoso, J.P. Braga. Chem. Phys. Lett.378,406 (2003).
[17] E. Borges, N.H.T.Lemes, J.P. Braga. Chem. Phys. Lett.423,
357 (2006).
[18] I. Solomon. Phys. Rev.99-2, 559 (1955).
[19] A. Abragam, The principles of nuclear magnetism, Oxford Press, Oxford, 2004.
[20] E.L. Hahn. Phys.Rev.80-4,580 (1950)
[21] R.C.O. Sebasti˜ao, J.P. Braga. J. Magn. Reson. 177-1, 146 (2005).
[22] K.P. Withall. J. Magn. Reson.93,221 (1991). [23] R.J.S. Brown. J. Magn. Reson.132,65 (1998).
[24] Vemuri, V.; Jang, G. S.; J. Franklin Inst. 329, 241(1992). [25] Forsythe, G.E.; Malcolm, M.A.; Moler, C.B.; Computer
Methods for Mathematical Computations, Englewood Clifs: New Jersey, 1977.
[26] L.H.M. Da Silva, M.C.H. Silva, K.R. Francisco, M.V.C. Car-doso, L.A. Minim, J.S.R. Coimbra. J. Phys. Chem. B 112, 11669 (2008).
[27] V.C. Viterbo, R.C.O. Sebasti˜ao, J.P. Braga, W. F. Magalh˜aes. J. Braz. Chem. Soc.16, 93 (2005).