Analysis of fluctuation conductivity of polycrystalline
Er
1−xPr
xBa
2Cu
3O
7−δsuperconductors
A.R. Jurelo, R. Menegotto Costa,∗ A.V.C. de Andrade, P.R. J´unior,
G.K. da Cruz, C.S. Lopes, M. dos Santos, and W.T.B. de Sousa Departamento de F´ısica, Universidade Estadual de Ponta Grossa, Av. Gen. Carlos Cavalcanti 4748, 84.030-000, Ponta Grossa, Paran´a, Brazil.
(Received on 3 July, 2009)
In this work we report on conductivity fluctuation measurements in polycrystalline samples of the Er1−xPrxBa2Cu3O7−δsuperconductor (x=0.00, 0.05 and 0.10). Samples were prepared by a standard solid-state reaction technique. The results were analyzed in terms of the temperature derivative of the resistivity and of the logarithmic temperature derivative of the conductivity that allowed the identification of power-law diver-gences of the conductivity. The results show that the transition proceeds in two stages: pairing and coherence transition. Also, our results, from the critical exponent analysis, show a two-peak splitting at pairing transition, indicating possibly a phase separation. On approaching the zero resistance state, our results show a power-law behavior that corresponds to a phase transition from paracoherent to a coherent state of the granular array.
Keywords: High-TCSuperconductor, Erbium, Praseodymium, Critical Phenomena.
1. INTRODUCTION
It is well known that rare earth (RE) substitution for Y inY Ba2Cu3O7−δ (Y-123) has little effect on
superconduc-tivity, except for Pr,Ce,T bandPm[1]. Prforms a com-pound that is isostructural withY−123, however it is not a superconductor [2]. On the other hand, Ce and Tb do not form the compound RE-123 [3-5], and Pm is radioactive with a short half life. In particular, RE1−xPrxBa2Cu3O7−δ
compound has become one of the most studied subjects in the field of high temperature superconductivity. From these studies, it has been observed that increasing Pr substitu-tion in RE1−xPrxBa2Cu3O7−δ, causes a monotonically
de-crease in the critical temperature (TC) [6]. Some
mecha-nisms such as hole localization [7,8], hole filling [9], mag-netic pair breaking [10] and percolation [11] have been pro-posed to explain the degradation of superconductivity. Also, it was observed an ion-size effect in experiments on the RE1−xPrxBa2Cu3O7−δ system for RE = Nd, Eu, Gd, Y, Er
and Yb, indicating an approximately linearTCdecrease with
increasing the RE-site ions radius for a fixed dopant amount x[12]. Yet, some ofREBa2Cu3O7−δcompounds (such as for
RE=Nd,Sm,Gd,HoandEr) exhibit antiferromagnetic or-dering belowTC [13], showing that investigations about the
interplay between superconductivity and magnetism can be of particular interest in this system.
Despite the large amount of research on this system, con-siderable controversy still persists over the mechanisms ofTC
suppression by Pr inRE1−xPrxBa2Cu3O7−δ. Careful studies
of the conductivity in the neighborhood of the critical tem-perature can yield information about the nature of the su-perconducting state [14-16] as well as on the influence of the granularity at microscopic and mesoscopic levels on the fluc-tuation regimes [17-19]. In this paper, we report on fluctua-tions conductivity measurements in polycrystalline samples of theEr1−xPrxBa2Cu3O7−δ(0≤x≤0.10) superconductor.
The structural characterization of the samples was obtained through Rietveld analysis of the XRD patterns and the results revealed that all samples were nearly single-phase, without
∗Electronic address:
dependence on the Pr concentration. Also, using the temper-ature derivative of the resistivity,dρ/dT, and the logarithmic temperature derivative of the conductivity, −dln(∆σ)/dT, we observed the evolution of the critical regimes as a func-tion of praseodymium concentrafunc-tion.
2. EXPERIMENTAL DETAILS
Polycrystalline samples of Er1−xPrxBa2Cu3O7−δ
(x =0.00, 0.05 and 0.10) were prepared by solid-state reaction technique, usingEr2O3,Pr6O11,BaCO3, andCuO. Appropriate amounts were mixed and calcinated in air at 850, 880 and 9200C for 24 hours, and then slowly cooled through 7000C. Finally, the samples were heated in flowing oxygen at 4000Cfor 48 hours. The resistivity measurements were performed with a low-frequency-low-current AC technique that employs a lock-in amplifier as a null detector. The measurements current density was up to 600mA/cm2. To provide electrical contact to the sample, four stripes of silver paste were painted onto the surface. The silver paint was fixed to the sample by heating it in flowingO2for 4 h at 4000C. Then, copper wires were attached to the samples with silver paste, resulting in contact resistance of less than 1 ohm. Temperature was measured with a Pt sensor, allowing a resolution better than 1 mK, and the resistivity measurements were performed at a 3 K/h rate or lower.
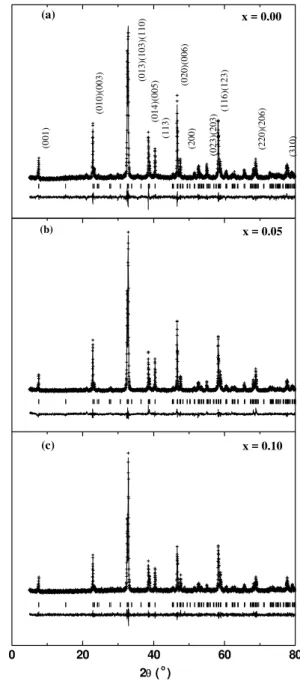
X-ray powder diffraction patterns were collected from 50 to 1000 in the 2θ range with 0.020 step and 4 s counting time. Rietveld refinements of crystal structures were per-formed using the GSAS and EXPGUI software [20,21]. The X-ray powder diffraction patterns ofEr1−xPrxBa2Cu3O7−δ
for x=0.00, x=0.05 and x=0.10 are displayed in Fig. 1. The X-ray pattern almost completely matches the or-thorhombicEr−123 structure (compared with JCPDS files), and belongs to the ErBa2Cu3O7−δ orthorhombic unit cell
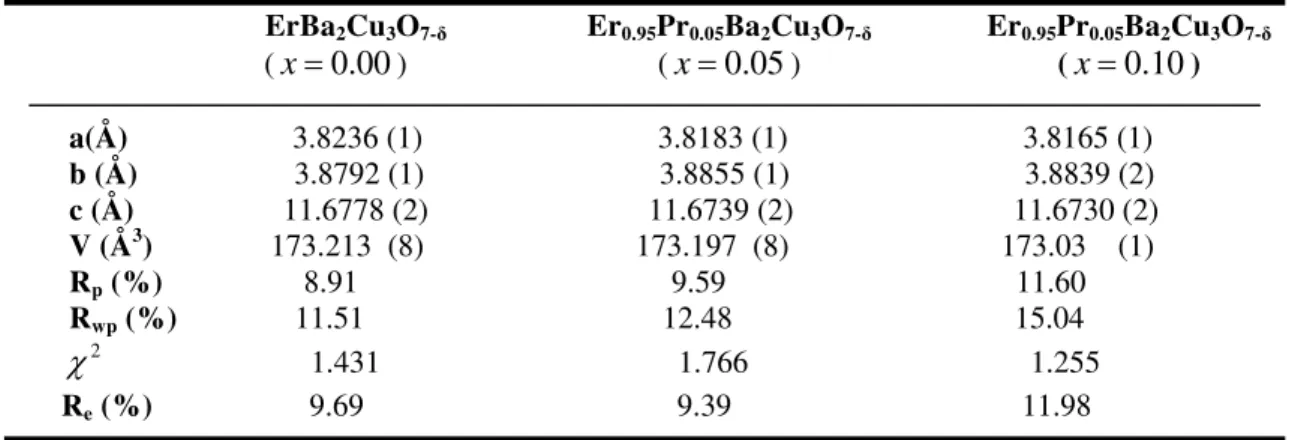
TABLE I: Unit cell parameters, atomic parameters, and agreement factors forEr1−xPrxBa2Cu3O7−δ;x=0.00,x=0.05 andx=0.10; obtained through Rietveld refinements at room temperature.
ErBa2Cu3O7-δ Er0.95Pr0.05Ba2Cu3O7-δ Er0.95Pr0.05Ba2Cu3O7-δ
(
x
=
0.00
) (x
=
0.05
) (x
=
0.10
)a(Å) 3.8236 (1) 3.8183 (1) 3.8165 (1)
b (Å) 3.8792 (1) 3.8855 (1) 3.8839 (2)
c (Å) 11.6778 (2) 11.6739 (2) 11.6730 (2)
V (Å3)
173.213 (8) 173.197 (8) 173.03 (1)
Rp (%) 8.91 9.59 11.60
Rwp (%) 11.51 12.48 15.04
χ
21.431 1.766 1.255
Re (%) 9.69 9.39 11.98
characteristic of Pr-rich samples [22,23].
The unit cell parameters, atomic parameters, and agree-ment factors forEr1−xPrxBa2Cu3O7−δ (x=0.00,x=0.05
andx=0.10) obtained through Rietveld refinements at room temperature are summarized in Table I. The value of the lat-tice parametera decreases from 3.8236 (1) ˚A for x=0.00 to 3.8165 (1) ˚A for x=0.10 while calso decreases from 11.6778 (2) ˚Afor x=0.00 to 11.6730 (2) ˚A for x=0.10. Meanwhile,bincreases from 3.8792 (1) ˚Ato 3.8839 (2) ˚A. Also, the volume decreases from 173.213 (8) ˚A3forx=0.00 to 173.03 (1) ˚A3forx=0.10. In a general manner, the lat-tice parameters and volume derived from least squares re-finement are in agreement with published results obtained in others studies [24,25]. From Table I we can observe thatRP
(R−pattern),Rwp(R−w eighted pattern),Re (R−expected)
andχ2=p
Rwp/Re(goodness-of-fit) systematically increase
with increasingx. However, as theRi factors are small, the
results are reliable [26,27].
3. RESULTS AND DISCUSSION
It is well-known that sintered samples of high tempera-ture superconductors show a pronounced granular character that plays an important role in their resistive transition. As the temperature decreases from the normal state, it is first observed a pairing transition and then a coherence transi-tion. At the pairing transition, the superconductivity is stabi-lized in some small and homogeneous regions of the sample at a temperature which virtually coincides with the critical temperature of the bulk, TC. These superconducting grains
may not necessarily be coincident with the crystallographic grains. At a lower temperature,TCO, the superconductivity
is established among the grains. This is the coherence tran-sition, a long-range superconducting state that is achieved through a percolation-like process which controls the acti-vation of weak links between grains. This behavior is very common in polycrystalline samples and it is associated with disorder at mesoscopic level.
In Fig. 2 we show the superconducting transition for three Er1−xPrxBa2Cu3O7−δ samples: x=0.00 (open
cir-cle), x=0.05 (open square) and x=0.10 (closed circle).
The measurements were performed with current density of J=60mA/cm2and the room-temperature resistivities were ρ(300 K)=3.3mΩcm(x=0.00), 6.0 mΩcm(x=0.05) and 2.4mΩcm(x=0.10). The presented data are normal-ized to unity at 95 K. The results (not shown) also indicate that our samples present a metallic-like behavior at high tem-peratures. The panels (a) and (c) show the resistivity versus temperature plots whereas panels (b) and (d) show the plot ofdρ/dT versus temperature in the corresponding tempera-ture range. The plots ofdρ/dTversus temperature, shown in panels (b) and (d), present two maxima denoted byTP1and TP2. These two peaks are associated with a splitting of the pairing transition. The maximaTP1andTP2correspond ap-proximately to the pairing critical temperaturesTC1andTC2, respectively. TP1is approximately 91.8 K (x=0.00), 93.0 K (x=0.05) and 88.2K(x=0.10) andTP2is about 91.2K (x=0.05) and 85.6K(x=0.10). These results indicate that the superconducting pairing transition occurs in two steps of about 1.8 K apart (x=0.05 sample) and with about 4 K (x=
0.10 sample). It is interesting to note that for low concentra-tion of praseodymium (x=0.05), the value ofTP1is higher than that for the pure system. This effect was also observed for other doped samples [28]. From panels (c) and (d) we can observe that 10 % Pr substitution in the Er sites causes a strong depression of the superconducting transition tempera-ture and a significant enlargement of the width of the resistive transition (10 % to 90 % of the transition) of approximately 2.0K(x=0.00)to 6K(x=0.10). For thex=0.10 sample, the whole transition broadens.
3.1. Method of Analysis
We study the effect of thermal fluctuations to the con-ductivity by using a Kouvel-Fischer-type method [29]. It is assumed that the fluctuation conductivity∆σ diverges as a power-law given by
∆σ=Aε−λ, (1)
where ∆σ = σ−σR, A is the critical amplitude, ε =
(T−TC)/TC is the reduced temperature andλis the critical
0 20 40 60 80 2θ ( o )
x = 0.10 (c)
x = 0.00
(001) (0 10)(003 ) (013 )( 1 0 3)(110 ) (0 14)(005 ) (11 3 ) (020 )( 0 06) (2 00) (3 10) (22 0 )(206) (11 6 )(123) (023)(20 3 ) (a) I nte ns it y (A rb . U ni ts )
x = 0.05 (b)
FIG. 1: Room temperature XRD patterns of polycrystalline samples ofEr1−xPrxBa2Cu3O7−δ: (a)x=0.00, (b)x=0.05 and (c)x= 0.10. The lower curve is the difference between the observed and the calculated intensities.
the conductivity σ=1
ρ. σR, the regular conductivity, is
obtained by linear extrapolation of the resistivity data in the range from 2TCto room temperature.
To obtain the values forλeTC, we determine numerically
the logarithmic derivative of∆σfrom experimental data and define
χσ=−
d
dTln∆σ. (2)
Combining eqs. (1) and (2) we obtain
1 χσ =
1
λ(T−TC). (3)
86 89 92
90 92 94
0.0 0.5 1.0 1.5 0.0 0.4 0.8
x = 0.00 x = 0.00
x = 0.10
(a) Temperature (K) (b) TP2 TP1 d ρ /d T ( m Ω
cm / K)
(d) TP1 TP2 ρ / ρ ( 95 K )
x = 0.05
(c)
FIG. 2: The panels (a) and (c) show the resistivity versus tempera-ture plot while the panels (b) and (d) show the temperatempera-ture deriva-tive of the resistivity versus temperature, around of the critical tem-perature, for threeEr1−xPrxBa2Cu3O7−δsamples:x=0.00 (open circle),x=0.05 (open square) andx=0.10 (closed circle). The temperatureTPcorresponds approximately to the intragrain pairing transition. The current density was 60mA/cm2.
90 92 940 3 6 9
90 91 92 93 0
3 6 9
90.6 91.2 91.8
0.0 0.2 0.4
89.4 90.0 90.6
0.0 0.3 0.6 0 1 0 1 2
s = 2.9
λb P1 = 0.15
λa P1= 0.35
Temperature (K)
(d) TP1
λa P1 = 0.34
λP2 = 0.35
s = 2.9 T P2 TCO χ -1 σ (K ) TP1
s = 2.9
TP1
TCO
s = 2.9
λb
P1 =0.16
(b) ErBa
2Cu3O7-δ
d ρ / dT ( m Ω cm / K )
Er0.95Pr0.05Ba2Cu3O
7-δ
(a)
TP1 TP2
(c)
83
84
85
86
87
88
89
90
0
1
2
3
4
5
λaP1= 0.32
Temperature ( K )
χ
−1
(K
σ)
Er
0.90Pr
0.10Ba
2Cu
3O
7-δs = 2.7
λGP2= 1.3
TP1
T
P2
FIG. 4: The inverse of the logarithmic derivative of the con-ductivity χ−σ1 as a function of T obtained for a sample of Er0.90Pr0.10Ba2Cu3O7−δ(J=60mA/cm2).
89 90 91 92 93 94
0 1 2 3 4 5
89 90 91
0.0 0.3 0.6 0.9
J = 60 mA/cm2 J = 600 mA/cm2
χ
−1 σ
(K
)
Temperature (K)
λb
P1=0.13
λP2 = 0.35
Er0.95Pr0.05Ba2Cu3O7-δ
FIG. 5: The inverse of the logarithmic derivative of the con-ductivity χ−1
σ as a function of T obtained for a sample of Er0.95Pr0.05Ba2Cu3O7withJ=60mA/cm2andJ=600mA/cm2. The respective exponents are quoted. The insert shows an expanded view close toR=0 state.
Then, it is possible to determine simultaneouslyTC andλby
plottingχ−1
σ versusT[14]. Performing averages over several
measurements, we obtained the mean values of the critical exponents.
3.2. Critical Fluctuation Regimes
In Fig. 3 we compare the resistive transitions of ErBa2Cu3O7−δ (x = 0.00) and Er0.95Pr0.05Ba2Cu3O7−δ
(x=0.05) measured with current density ofJ=60mA/cm2. In panels (a) and (c),dρ/dT x Tis plotted. In panels (b) and (d), the transition is shown asχ−1
σ x T in the corresponding
temperature interval. The figure allows the identification of the asymptotic regime of the coherence critical region (be-tweenTCOandTP1forx=0.00 sample and betweenTCOand
TP2 for x=0.05 sample) and of the pairing critical region (aboveTP1 for x=0.00 sample and aboveTP2 for x=0.05 sample). The pairing critical region has an internal struc-ture [16], and two power-law regimes are observed in se-quence whenTapproachesTC1from above corresponding to λa
P1≈0.34 andλbP1≈0.15.
From panel 3(b) we can observe, aboveTP1, a full dy-namic regime dominated by genuine critical flucutations la-beled by the exponent λa
P1=0.35±0.03. The value of the exponent λa
P1is consistent with the predictions for the 3D-XY universality class [14]. Still closer toTC1, it is ob-served a fluctuation regime beyond 3D-XY with an exponent λb
P1=0.16±0.03. This scaling might represent a crossover to an ultimate weakly first-order character of the normal su-perconducting transition of high temperature cuprates [16]. This critical regime was previously observed in polycrys-talline and single-crystal samples [16,30]. Yet, from panel 3(b), we can observe near the zero resistance state (TCO) that
the fluctuation conductivity can be described by an another power law, given by the equation∆σ ∝(T−TCO)−s, with
ex-ponents=2.9±0.3. The insert shows an expanded view of the asymptotic regime of the coherence critical regime. This regime is interpreted as being intrinsically related to super-conducting granularity at mesoscopic level. When the dis-order at mesoscopic level dominates, the fluctuation conduc-tivity near the zero-resistance state must diverge with an ex-ponent quite large (s∼=3.0) [31]. The values∼2.9 observed for this sample is according to the expected value for criti-cal conductivity fluctuations in artificially prepared granular arrays,s∼=3 [32]. The same exponent was also observed to characterize the resistive paracoherence-coherence transition of Y-123 ceramics [14,33].
In panel 3(d), it is observed in sequence, again, two power-law regimes whenT approachesTC1from above correspond-ing toλa
P1=0.34±0.03 andλbP1=0.15±0.02. The value λa
P1=0.34 reveals the effects of genuine fluctuations which belong to the 3D-XY univesarlity class. In the immediate vicinity aboveTP1 we identify a genuinely critical fluctua-tion regime described by the exponent λb
P1=0.15, which is precursor of a weakly first-order transition [16]. An-other genuinely critical regime represented by the exponent λP2=0.35±0.03 is also visible belowTP1, in the immediate vicinity aboveTP2. This regime, that was not observed in the x=0.00 sample, is in agreement with the predictions of the full dynamic 3D-XY model [14]. The splitting of the pairing transition, verified by observation of critical regimesλa
P1and λb
in-duces a superconducting phase with higher critical tempera-ture (∼93.1K). A genuine critical fluctuation regime in the temperature range between TP2 andTP1 was first observed by Barroset al. inY1−xPrxBa2Cu3O7−δ single crystals and
polycrystalline samples [19,30], and it was associated with a peculiar phase separation related with oxygen doping. Panel 3(d) also shows that, betweenTP2andTC0, the variation of χ−1
σ as a function of temperature is well described by a power
law regime with corresponding exponents=2.9±0.3. The insert shows an expanded view of the paracoherence temper-ature region. This value is the same observed in the pure system and is interpreted as an indication of a paracoherent-coherent transition of the granular array [14,30].
Fig. 4 displays representative plots of χ−1
σ x T for
the Er0.90Pr0.10Ba2Cu3O7−δ (x=0.10) sample for J=60
mA/cm2. Above TP1, the results show the occurrence of a genuine critical regime, with exponentλa
P1=0.32±0.01 that is consistent with the predictions for the 3D−XY univer-sality class. It is important to point out that, in this case, a scaling beyond 3D−XY precursory of a weakly first-order transition [16] was not observed, as noticed for the Y0.95Pr0.05Ba2Cu3O7−δand pure samples. BetweenTP2and TP1we can clearly observe another fluctuation regime with exponent λG
P2=1.3±0.2. This exponent does not corre-spond to an integer dimensionality. In this case we supose that the flucutations develop in a space having fractal topol-ogy. According to Char and Kapitulnik [34], the conduc-tivity exponent should be written asλ=2−d2˜ where ˜d is the fractal dimension of the flucutation network. Our ex-ponent λG
P2≈1.3 is consistent with ˜d ≈ 43, which is the weel-known fractal dimensionality of the percolation net-work [35] that corresponds to a crossover regime between 1D and 2D geometry. A similar exponent was also observed in Bi based cuprates [14, 36]. We expected the presence of the 3D−XYscaling closer to TP2 in thex=0.10 sam-ple, as observed for thex=0.00 andx=0.05 samples. The disappearance of this regime is cleary related with the in-crease in Pr doping. The observation of the Gaussian regime is related with its robustness against the Pr doping.Again, in approaching the zero resistance state, our results show a power-law behavior with critical exponents=2.7±0.1 that corresponds to a phase transition from a paracoherent to a coherent state of the granular array [31]. These results indi-cate that an increasing Pr concentration destroys the pairing critical regimes. On the other hand, 10% of Pr substitution does not affect the coherent transition.
Fig. 5 compares representative plots ofχ−1
σ x T for the
x=0.05 sample for two different currents density, J=60 mA/cm2 and J= 600 mA/cm2. We can observe that the regimesλb
P1andλP2are stable againstJwithin the studied range. This behavior is consistent with the interpretation that the observedλP2regime is related with a pairing (intragrain) transition. BelowTP2, and down to the zero-resistance state, the resistivity is current dependent. The figure shows that
the higher current intensity shiftsTCOto lower temperatures.
Thus, the enlargement of the resistive transition induced by current in our samples is an effect directly related to granular-ity. Indeed, the self-field is expected to enhance the granular character of the samples by weakening the junctions between grains. The effect of increasing current for thex=0.10 sam-ple (not shown) is similar to that observed for thex=0.05 sample.
The comparison of the results obtained in the pure and doped systems shows that the Pr doping (until 10 %) alters significantly the critical behavior of the Er1−xPrxBa2Cu3O7−δ compound aboveTP2. Two possible Pr doping effects can be inferred from our experiments and analysis. The first one is a phase separation, showed in Figs. 3, 4 and 5, and that is indicated by the presence of two gen-uinely critical regimes aboveTP2. These critical regimes are not affected by the studied currents. The second effect is the weakness of the superconductivity, which can be observed by the suppression of the pairing critical regimes. The regime beyond 3D−XY(λ≈0.13), observed aboveTP1forx=0.00 andx=0.05 samples, was not observed for the x=0.10 sample. At the same time, the critical regime 3D−XY (λ≈
0.33) observed betweenTP1andTP2for thex=0.05 sam-ple, was also suppressed in the x=0.10 sample. On the other hand, belowTP2, in the paracoherent regime, it was not observed any influence of the Pr doping on the critical ex-ponents. These results indicate that Pr doping induces struc-tural disorder at a microscopic level in the studied system.
4. CONCLUSIONS
In conclusion, our conductivity experiments on granular Er1−xPrxBa2Cu3O7−δ (0≤x≤0.10) samples show that the
superconducting transition proceeds in two stages: pairing and coherence transition. From the temperature derivative and power-law divergences of the conductivity, our results show a two-peak splitting at pairing transition, indicating possibly a peculiar phase separation associated with Pr dop-ing. Another Pr doping effect is the weakness of the super-conductivity, which can be observed through the suppression of genuine critical regimes. On approaching the zero resis-tance state, our results show a power-law behavior that corre-sponds to a phase transition from paracoherent to a coherent state of the granular array with exponents that are doping in-dependent.
Acknowledgements
This work was partially financed by the CNPq Brazilian Agency under contract n0475347/01-3.
[1] H. B. Radousky, J. Mater. Res.7, 1917 (1992).
[2] L. Soderholm, K. Zhang, D. G. Hinks, M. A. Beno, J. D. Jorgenson, C. U. Segre and I. K. Schuller, Nature328, 604
(1987).
[4] S. Tsurumi, M. Hikita, T. Iwata, K. Semba and S. Kurithara, Jpn. J. Appl. Phys.26, L856 (1987).
[5] T. Tamegai, A. Watanabe, I. Oguro and Y. Iye, Jpn. J. Appl. Phys.26, L1304 (1987).
[6] Y. Dalichaouch, M. S. Torikachvili, E. A. Early, B. W. Lee, C. L. Seaman, K. N. Yang, H. Zhou and M. B. Maple, Solid State Commun.65, 1001 (1988).
[7] R. Fehrenbacher and T. M. Rice, Phys. Rev. Lett.70, 3471 (1993).
[8] A. I. Liechtenstein and I. I. Mazin, Phys. Rev. Lett.74, 1000 (1995).
[9] J. L. Peng, P. Klavins, R. N. Shelton, H. B. Radousky, P. A. Hahn and L. Bernardez, Phys. Rev. B40, 4517 (1989). [10] J. J. Neumeier, T. Bjornholm, M. B. Maple and I. K. Schuller,
Phys. Rev. Lett.63, 2516 (1989).
[11] C. Infante, M. K. El Mously, R. Dayal, M. Husain, S. A. Sid-diqi and P. Ganguly, Physica C167, 640 (1990).
[12] Y. Xu and W. Guan, Phys. Rev. B45, 3176 (1992).
[13] B. W. Lee, J. M. Ferreira, S. Ghamaty, K. N. Yang and M. B. Maple, inOxygen Disorder Effects in High-TC Supercon-ductors,ed. J. L. Moran-Lopez and Ivan K. Schuller, Plenum Press, New York and London, 1990.
[14] P. Pureur, R. M. Costa, P. Rodrigues Jr., J. Schaf and J. V. Kunzler, Phys. Rev. B47, 11420 (1993).
[15] R. M. Costa, P. Pureur, L. Ghivelder, J. A. Camp and I. Rasines, Phys. Rev. B56, 10836 (1997).
[16] R. M. Costa, P. Pureur, M. Gusmo, S. Senoussi and K. Behnia, Solid State Commun.113, 23 (2000).
[17] A. R. Jurelo, J. V. Kunzler, J. Schaf, P. Pureur and J. Rosen-blatt, Phys. Rev. B56, 14815 (1997).
[18] J. Roa-Rojas, R. M. Costa, P. Pureur and P. Prieto, Phys. Rev. B61, 12457(2000).
[19] F. M. Barros, F. W. Fabris, P. Pureur, J. Schaf, V. N. Vieira, A. R. Jurelo and M. P. Canto, Phys. Rev. B73, 94515 (2006). [20] A. C. Larson and R. B. Von Dreele,General Structure
Anal-ysis System (GSAS), Los Alamos National Laboratory Report LAUR 86-748 (1994).
[21] B. H. Toby, J. Appl. Cryst.34, 210 (2001).
[22] M. Kariminezhad and M. Akhavan, Physica C 423, 163 (2005).
[23] Z. Yamani and M. Akhavan, Solid State Commun.107, 197 (1998).
[24] J. R. O’Brien and H. Oesterreicher, Journal of Alloy and Com-pounds267, 70 (1998).
[25] S. A. Antony, K. S. Nagaraja, S. Sahasranaman and O. M. Sreedhran, Physica C323, 115 (1999).
[26] M. R. Mohammadizadeh, H. Khosroabadi and M. Akhavan, Physica B321, 301 (2002).
[27] H. M. Luo, B. N. Lin, Y. H. Lin, H. C. Chiang, Y. Y. Hsu, T. I. Hsu, T. J. Lee, H. C. Ku, C. H. Lin, H. –C. I. Kao, J. B. Shi, J. C. Ho, C. H. Chang, S. R. Hwang and W. –H. Li, Phys. Rev. B61, 14825 (2000).
[28] A. R. Jurelo, P. Rodrigues Jr. and R. M. Costa, Modern Physics Letters B 23, 1367 (2009). Accepted paper “Fluc-tuation conductivity and phase separation in polycrystalline Y1−xCexBa2Cu3O7−δ” in the J Supercond Nov Magn. [29] J. S. Kouvel and M. E. Fischer, Phys. Rev.136, A1616 (1964). [30] A. R. Jurelo, P. Rodrigues Jr. and J. Flemming, Physica C349,
75 (2001).
[31] A. R. Jurelo, I. A. Castillo, J. Roa-Rojas, L. M. Ferreira, L. Ghivelder, P. Pureur and P. Rodrigues Jr., Physica C311, 133 (1999).
[32] J. Rosenblatt, inPercolation, Localization and Superconduc-tivity,Vol. 109of NATO Advanced Study Institute, Series B-Physics, edited by A. M. Goldman and S. A. Wolf (Plenum, New York, 1984), P. 431.
[33] P. Peyral, C. Lebeau, J. Rosenblatt, A. Raboutou, C. Perrin, O. Pena and M. Sergent, J. Less-Common Met.151, 49 (1989). [34] K. Char and A. Kapitulnik, Z. Phys. B72, 253 (1988). [35] S. Alexander and R. Orbach, J. Phys. Lett (Paris)43, L625
(1982).