Experimental Evidence of an Optical Shutter in Cholesteric Phase of a Double Hydrogen Bonded
Liquid Crystal
V.N. Vijayakumar and M.L.N. Madhu Mohan∗
Liquid Crystal Research Laboratory (LCRL), Bannari Amman Institute of Technology, Sathyamangalam 638 401, India
(Received on 14 August, 2009)
A novel series of double hydrogen bonded liquid crystals have been isolated. Hydrogen bond was formed be-tween non mesogen chiral ingredient levo tartaric acid (LTA) and mesogenic undecyloxy benzoic acids (11BA) Thermal and electrical properties exhibited by levo tartaric acid and undecyloxy benzoic acid (LTA+11BA) were discussed. Interesting feature of the present investigation was observation of an optical shuttering action in LTA+11BA hydrogen bonded complex on application of a stipulated applied dc bias voltage. By enhancement of the dc bias voltage the mesogen behaves like an optical shutter, thus this hydrogen bonded complex mesogen acts as an effective light modulator. It was noticed that this action of shuttering was reversible, in the sense that when applied bias voltage was removed the original texture was restored. Experimental results relating to textures, optical tilt, dielectric studies and optical shuttering action were presented. This optical shutter property of the mesogen can be exploited for commercial and display device applications.
Keywords: Hydrogen bonded liquid crystal, LTA+11BA, Optical shutter, Light modulator
Introduction
‘Liquid Crystal’ (LC) materials refer to the fourth state of matter that posses dual property of crystals and liquids. Their anisotropic physical properties (characteristic of its crystalline nature) and the inherent surface alignment (to the substrate) tendency (characteristic of its fluidity) are exten-sively exploited [1-3] to design LC based Electro-Optic de-vices. Their overall shape [4] being cylindrical, renders them readily viable for surface alignment. In the field of supra-molecular LCs, especially in the field of hydrogen bonded LCs, the influence of soft-covalent interaction for the thermal stability of phases of device interest is widely [2-14] studied. The configuration and spread of the hydrogen bonding in-teraction with regard to the long molecular dipole moment in the calamitic LCs along with the corresponding molecu-lar dipole models are argued [5,7,8] to originate the distinct properties in the family of hydrogen bonded liquid crystals (HBLC). However, as an integrated overview, for the micro-scopic interactions among molecular dipoles as contributed by the underlying chemical moieties configured on the molec-ular body (or frame) would be of immense utility in devices. The field of ‘Systematic Studies’ in the area of LCs is ex-pected to further reveal the truth of microscopic interactions. The growth of order (and crystalline nature) is logically ex-pected to increase with decreasing temperature in these LC materials in their condensed version of matter.
In the case of HBLCs the molecular frame possesses [10, 18-22] additional soft-covalent interaction. Further, in case of non-ferroelectric and ferroelectric HBLCs, the observed [13, 21] variation in device relevant properties like thermal stability, spontaneous polarization, tilt angle, switching times etc., are addressed through dipolar and refined dipolar models to vouch the fact that soft-covalent interaction extends rather inclined to the long molecular dipole moment. Further, the presence of additional interaction in the form of anisotropic dipole moment along the molecular body is believed to give origin to the orientational disorder leading to tilted phases.
∗Electronic address:[email protected]
With our previous experience [23-30], in designing, syn-thesizing and characterizing various types of liquid crystals, a successful attempt has been made in characterizing a novel series of inter hydrogen bonded liquid crystal exhibiting opti-cal shutter activity in cholesteric phase of LTA+11BA hydro-gen bonded complex.
In the present communication a homologous series of HBLC is designed in such a way that the molecule pos-sesses double hydrogen bonding with chiral ingredient levo tartaric acid moiety. Thermal and electrical characterizations of undecyloxy benzoic acid and levo tartaric acid complex (LTA+11BA) pertaining to the present series are discussed in detail.
Experimental
Optical textural observations are made with a Nikon po-larizing microscope equipped with Nikon digital CCD cam-era system with 5 mega pixels and 2560*1920 pixel reso-lutions. The liquid crystalline textures are processed, ana-lyzed and stored with the aid of ACT-2U imaging software system. The temperature control of the liquid crystal cell is equipped by Instec HCS402-STC 200 temperature controller (Instec, USA) to a temperature resolution of ±0.1
Synthesis of HBLC
The present intermolecular hydrogen bonded mesogen is synthesized by the addition of two moles of undecyloxy ben-zoic acids (11BA) with one mole of levo tartaric acid (LTA) in N,N-Dimethyl formamide (DMF) respectively. Further it has been subjected to constant stirring for 10 hours at am-bient temperature of 30oC till a white precipitate in a dense solution is formed. The white crystalline crude complexes so obtained by removing excess DMF are then recrystallized with Dimethyl Sulfoxide (DMSO) and the yield varied from 85% to 95%. The general molecular structure of the present homologous series of p-n-alkoxy benzoic acids with levo tar-taric acid is depicted in the figure 1, where n represents the alkoxy carbon number.
H
2n+1CnO C
C C C C C
OH--- O
O --- HO
* *
OH --- O
O --- HO H
H OH
OCnH
2n+1
OH
FIG. 1: General molecular diagram of LTA+nBA homologous series
Results and Discussion
Levo tartaric acid and undecyloxy benzoic acid complex (LTA+11BA) isolated are white crystalline solids and are sta-ble at room temperature. It is insolusta-ble in water and spar-ingly soluble in common organic solvents such as methanol, ethanol, and benzene and dicholoro methane. However it shows a high degree of solubility in coordinating solvents like dimethyl sulfoxide (DMSO) and pyridine. It melts at specific temperatures below 140oC. Further it shows high thermal and chemical stability when subjected to repeated thermal scans performed during polarizing microscopic studies (POM) and differential scanning calorimetric (DSC) studies.
Infrared Spectroscopy (FTIR)
IR spectra of free p-n-alkoxy benzoic acid, levo tartaric acid and their intermolecular hydrogen bonded complexes are recorded in the solid state (KBr) at room temperature. Figure 2 illustrates the FTIR spectra of the hydrogen bonded com-plex of LTA+11BA in solid state at room temperature. The solid state spectra of free alkoxy benzoic acid is reported [21] to have two sharp bands at 1685 cm−1 and 1695 cm−1due to the frequencyν(C=O) mode. The doubling feature of this stretching mode confirms the dimeric nature of alkoxy ben-zoic acid at room temperature [21]. Further in the present LTA+11BA hydrogen bonded complex a band appearing at 2924 cm−1is assigned toν(O-H) mode of the carboxylic acid group.
The doubling nature of ν(C=O) mode may be attributed to the dimeric nature of acid group at room temperature [21] Corresponding spectrum of solution state (chloroform) show a strong intense band suggesting the existence of monomeric
FIG. 2: FTIR spectrum of LTA+11BA hydrogen bonded complex
form of benzoic acid. A noteworthy feature in the spectra of LTA+11BA complex is the appearance of a broad band at 1674 cm−1and non appearance of the doubling nature of ν(C=O) mode of benzoic acid moiety. This clearly suggests that the dimeric nature of the benzoic acid dissociates and prefers to exist in a monomeric form upon complexation.
Phase Identification
The observed phase variants, transition temperatures and corresponding enthalpy values obtained by DSC in cooling and heating cycles for the LTA+11BA complex are presented in table 1.
Complex Phase
variance Technique
Crystal
Melt Ch C
* G* Crystal
DSC (h)
97.84
(47.68) 140.21
(2.33) 129.37
(2.47) #
DSC ( c)
136.78
(2.96) 125.5
(2.12) 84.84
(8.55) 72.54
(12.81)
POM ( c) 137.1 126.2 85.3 72.9
10 KHz 134.9 128.2 87.3 69.0 LTA+11BA ChC*G*
Dielectric
Studies ( c) 100 KHz 135 128.4 87.3 68.9
# Monotropic transition (c ) cooling run (h ) heating run
TABLE 1: Comparison of transition temperatures obtained by different techniques
LTA+nBA Homologous Series
The levo tartaric acid and alkoxy benzoic acid homologous complex is found to exhibit characteristic textures [31], viz., Cholesteric (finger print texture), Smectic C* (schlieren tex-ture) and Smectic G* (multi colored mosaic textex-ture) respec-tively. The phase sequence of the levo tartaric acid and unde-cyloxy benzoic acid (LTA+11BA) hydrogen bonded complex in the cooling run can be shown as:
DSC Studies
DSC thermo grams are recorded in heating and cooling cy-cles. The liquid crystal sample is crimped in an aluminum cell and heated with a scan rate of 10oC/min and hold at its isotropic temperature for one minute so as to attain thermal stability. The cooling run is performed with an identical scan rate of 10oC/min. DSC thermo gram of LTA+11BA is illus-trated as figure 3. The respective equilibrium transition tem-peratures and corresponding enthalpy values of the mesogens are listed separately in table 1. POM studies are good agree-ment with the DSC results.
FIG. 3: DSC thermo gram of LTA+11BA complex recorded with a scan rate of 100C/min
Phase diagrams
The phase diagrams of pure p-n-alkoxy benzoic acids and the present homologous series (nBA+LTA) are constructed and reported [30] through optical polarizing microscopic studies by the phase transition temperatures observed in the cooling run of the mesogens of the present homologous se-ries. The phase diagram of pure p-n-alkoxy benzoic acids is reported [24] to exhibit three phases namely, Nematic, smec-tic C*and smectic G*.
Optical Tilt Angle Studies
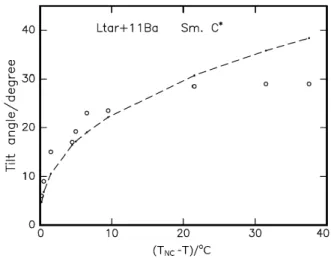
For the hydrogen bonded LTA+11BA complex, optical tilt angle has been experimentally measured by optical extinc-tion method [32] in the smectic C*phases. From the figure 4 it is observed that the tilt angle increases with decreasing temperature and attains a saturation value of 290. The large magnitudes of the tilt angle are attributed [22] to the direction of the soft covalent hydrogen bond interaction which spreads along molecular long axis with finite inclination. Tilt angle is a primary order parameter [32,33] in tilted phases namely smectic C*The temperature variation is estimated by fitting
FIG. 4: Temperature dependence of optical tilt in smectic C* phase. Solid line denotes the fit.
the observed data ofθ(T) to the relation
θ(T)α(T−TC)β (1) The critical exponentβvalue estimated by fitting the data ofθ(T) to the above equation (1) is found to be 0.50 to agree with the Mean Field [34] prediction. The dotted line in the figure 4 depicts the fitted data. Further, the agreement ofβ with Mean Field value infers the long-range interaction of transverse dipole moment for the stabilization of tilted smec-tic C*phase.
Dielectric Studies
Dielectric studies enable to detect a second order transition which goes unobserved in the DSC study. Variation of capac-itance and dielectric loss with temperature is performed for LTA+11BA of the present homologous series. The mesogen filled in a commercially available 4 micron polyamide buffed cell (Instec) and is excited with a frequency of 10 KHz and 100 KHz respectively. Silver leads are drawn from the cell for electrical contacts. Simultaneous textural observations are made to co-relate the phase exhibited by the mesogen to the dielectric data. Thus the textural transition temperatures and dielectric spectrum are studied together. The dielectric spec-trum of undecyloxy benzoic acid complex (LTA+11BA) as depicted in figure 5 is discussed below.
From figure 5 the following points can be inferred.
(a) As the temperature is decreased from isotropic, a small knick is observed at 134.9oC indicating the onset of the cholesteric phase. Cholesteric finger print texture is ob-served indicating the onset of the phase.
FIG. 5: Temperature dependence of capacitance at 10 KHz and 100 KHz
(c) At 128.2oC a small anomaly in the magnitude of the capacitance indicates the onset of smectic C* phase. Schlieren texture is observed with the onset of this phase.
(d) In the entire region of smectic C* phase a linear incre-ment in the magnitude of the capacitance is observed indicating the growth and stabilization of the phase.
(e) Smectic G* phase is observed as a sudden steep fall in the magnitude of capacitance at 87.3oC indicates the tran-sition from smectic C* to smectic G* phase. A multi colored mosaic texture is observed indicating the onset of smectic G* phase
(f) Further decrement in temperature showed an unaltered variation of the capacitance indicating the stabilization of smectic G* phase.
(g) A sudden variation in the magnitude of the capacitance at 69.9oC is attributed to the transition from the meso-genic phase to crystal. The formation of crystal is also evinced through optical textural studies.
Similar variations are observed in dielectric loss spectrum. The transition temperatures obtained by this technique are in good agreement with POM and DSC studies and are tabulated in table 1.
Dielectric relaxations
Dielectric dispersion i.e. frequency variation of dielectric loss exhibited by LTA +11BA is studied at different temper-atures in smectic C* phases in the frequency range of 5 Hz to 13 MHz respectively. An impedance analyzer (HP4192A) is operated with 1VP−Poscillating signal with zero bias field. Relative permittivityε‘r(ω) and dielectric lossε”(ω) are cal-culated by the following equations
*ε‘r(ω) =ε‘r(ω) - jε”(ω)
ε‘r(ω) = [CLC- Cleads]/ [Cempty- Cleads]
*ε‘r(ω) = Tanδ(ω)*εr(ω)
To detect the possible relaxation in the HBFLC complex, the mesogen is scanned in the frequency range of 5 Hz to 13 MHz at different temperatures corresponding to smectic C* phases. LTA+11BA mesogen exhibits a relaxation mech-anism namely Goldstone Mode (GM).
Goldstone mode
Goldstone mode in smectic C* phase of LTA+11BA com-plex is studied and analyzed. As reported [22] in HBFLC, Goldstone mode is observed at lower frequencies namely at around 950 Hz in LTA+11BA complex. The variation of the capacitance with corresponding dielectric loss at various tem-perature which are referred as Cole-Cole plots, in smectic C* for the LTA+11BA are shown in figure 6 and is interpreted as due to collective response originated due to the excitation of the coupled transverse dipole moment situated around the chiral centers over the layers in the form of polarization he-lix. This relaxation is identified [35] as Goldstone mode. The order of fr relevant to the GM in the present compounds are found to be comparable to that reported [36,22] in other FLCs and HBFLC compounds. It is further observed that GM relax-ation is suppressed under different applied fields as depicted in figure 7, thus this experimental evidence conforms that GM is originated from the helix spread over the smectic layers of respective phase.
FIG. 6: Cole-Cole plots in smectic C* phase at various temperatures
Field Induced transition (FiT)
FIG. 7: Suppression of the helix under various applied external bias in the Goldstone mode of smectic C* phase
Optical shutter action in LTA+11BA
LTA+11BA compound in its cholesteric phase when an ap-plied dc bias voltage exceeds a particular threshold value, the phase of the compound is observed to prefer homeotropic like alignment with light being optically extinct which is referred as optical shutter. Plates 1 to 4 depict the cholesteric tex-ture under the influence of various applied fields, further, it is interesting to note that immediately after withdrawing the bias voltage from any of the induced transition the original texture of the cholesteric phase is retained. Thus this pro-cess is reversible with bias voltage. In the entire thermal span of cholesteric phase (∼136oC to∼125oC) this is ob-served. While in the other phases preceding and succeeding cholesteric phase no such transition is found. Thus the filed induced transitions can be represented as
E0→Optical shutter (E1)
A quantitative approach has been made to study the effect of applied electric field on hydrogen bonded LTA+11BA with optical textural studies and dielectric studies. The cholesteric phase with a bias voltage (both polarities) less than or equal to
±3.75 volts/micron is referred as E0where there is no change in the texture of the phase as depicted in plate 1. As the volt-age is increased in steps of 1.25 volts/micron the intensity of the light from the texture drops as can be seen from plates 2 and 3.
An important observation is that when a dc bias voltage of±5.0 volts/micron is applied, the optical extinction is ob-served with the optical texture of the compound suddenly dis-appears, this new phase is designated as optical shutter (E1) which is depicted as plate 4. One of the possible reasons for this interesting phenomenon may be the realignment of the molecules to form a homeotropic like alignment.
To substantiate the above results dielectric studies are per-formed. The variation of capacitance with respect to various external bias voltages is studied in cholesteric phase. Such a variation for LTA+11BA compound is shown in figure 8. The plot depicts a symmetric variation of the capacitance with
respect to both positive and negative applied bias voltages. From the above figure 8, it can be inferred that
a) Capacitance variation is identical for both the polarities inferring no influence of polarity.
b) Field induced transition i.e. E0−E1(optical shutter), are not sudden and abrupt but smooth and uniform.
c) Frequency has no influence on the threshold values of the FiT.
d) Equilibrium states for the low and the high field are found to be distinct.
FIG. 8: Field dependence of capacitance in the cholesteric phase of LTA+11BA. Optical Shutter is denoted as OS
FIG. 9: Intensity profile of the cholesteric phase under various ap-plied external bias voltages
Intensity profile of the optical texture in FiT
con-tact. The intensity profile in various phases has been experi-mentally analyzed by applying external bias voltage of both polarities drawn from impedance analyzer (HP 4192A) and the intensity of the light from the liquid crystal sample is mea-sured by a photo diode (TSL 252). As the external bias volt-age is incremented in small steps, this in turn induced various FiT at different magnitudes of the applied voltage. The vari-ation of the intensity of the texture is noted at each step of the applied bias voltage and plotted as shown in figure 9. It is not surprising to note that the magnitude of the light is almost unaltered in any of the induced transitions except in E0, and E1respectively. During the transition from E0and E1there is a steep sudden decrement of the intensity of light manifest-ing the distortion of the helix. In the this phase of FiT, which is referred as optical shutter, the optical profile is completely vanished. Thus the liquid crystal behaved as an optical shut-ter (plates 1- 4). Hence this HBLC may be used as a light modulator.
PLATE 1: Cholesteric phase with applied external bias voltage of 1.25 volts/micron
PLATE 2: Cholesteric phase with applied external bias voltage of 2.50 volts/micron
Molecular modeling of field induced transitions
A qualitative approach for the observed optical shutter phe-nomenon is described below. In the literature it is reported [44-48] the distortion and unwinding of the helicoidal
struc-PLATE 3: Cholesteric phase with applied external bias voltage of 3.75 volts/micron
PLATE 4: Cholesteric phase with applied external bias voltage of 5.00 volts/micron
ture with applied field in the liquid crystal mesogen. The un-twisting of the helical structure of a hydrogen bonded liquid crystal (HBLC) in a thin plane layer exposed to an external action (temperature or field) and its dependence on the molec-ular adhesive forces at the layer boundaries are responsible for field induced transitions. If the helical pitch is not infi-nite a non zero average polarization exists locally. When sub-jected to a weak electric fields the helix distorts [41] giving rise to small change in transmitted light as observed when the cell is placed under crossed polarizer. At much stronger fields there is a sudden transition such that the azimuthal orientation of the director is spatially uniform and all layers polarization is parallel to the applied field.
surface. In other words the liquid crystal behaves as a light modulator. At high fields the extinction of the light is ob-served and this state may be referred as optical shutter. The parameters like helical pitch, anchoring energy and light mod-ulation vary with applied field and govern the utility of the liquid crystal in display applications.
It has been experimentally observed from the helix studies that the magnitude of helical pitch decreases as one proceeds from the E0to E1and finally vanishes in E1phase. Thus it can be concluded that pitch in various field induced phase’s orients depending on the strength of the applied bias. It is no surprise that the molecules prefer an alignment which re-sembles like homeotropic alignment, when the bias strength is increased to a maximum value and thus the molecules in-hibits the light and act as a total optical shutter. The possible
reasons for this field induced transitions can be elicited from the various surface anchoring energy [49] possessed by the liquid crystalline molecules.
Acknowledgements
One of the authors (MLNMM) acknowledges the financial support rendered by All India Council for Technical Educa-tion, Department of Science and Technology, and Defence Research Development Organization, New Delhi. Infrastruc-tural support provided by Bannari Amman Institute of Tech-nology is gratefully acknowledged.
[1] R.B. Meyer, L. Liebert, L. Strezelecki and P. Keller, J. Physique. Lett.30,69 (1975).
[2] T. Kato, (1998) Handbook of liquid crystals. Wiley-VCH: Weinheim.
[3] G.W. Gray , (1962) Molecular structure and properties of liquid crystals, Academic press, London.
[4] H. Kelker and R. Hatz, (1980) Handbook of liquid crystals. Verlag Chemie, Weinheim.
[5] T. Kato and J.M.J. Frechet, J. Am .Chem. Soc.111, 8533 (1989).
[6] L. Yu, Liq. Cryst.14, 1303 (1993).
[7] T. Kato, H. Kihara, T. Uryu, S. Ujiie, K. Iimura, J.M.J. Fr´echet, U. Kumar, Ferroelectrics.148, 161 (1993).
[8] T. Kato, T. Uryu, F. Kaneuchi, C. Jin and J.M.J. Fr´echet, Liq. Cryst.14, 1311 (1993).
[9] D. Demus, H. Demus and H. Zaschke, Flussige Kristalle (1974) Tabellen, VEB Deutcher Verlag fur Grundstoffindustrie; Leipzig.
[10] C.M. Paleos, D. Tsiourvas, Liq. Cryst.28, 1127 (2001). [11] B. Xu,. T .M .Swager, J. Am. Chem. Soc.117, 5011 (1995). [12] S. Malik, P.K. Dhal, R.A Mashelkar.28,2159 (1995). [13] Z. Sideratou, D.Tsiourvas, C.M. Paleos and A. Skoulios, Liq.
Cryst.22,51 (1997).
[14] J.W. Goodby, R. Blinc, N.A Clark, S.T. Lagerwall, S.A. Os-ipov, S.A Pikin, T. Sakurai, Y. Yoshino and B. Zecks, (1991) Ferro Electric Liquid Crystal, Principles, Properties, and Ap-plications. Philadalphia, U.S.A.Gorden and Breech Press. [15] N.A. Clark and S.T. Lagerwall, Appl. Phys. Lett. 36, 899
(1980).
[16] H.R. Brand, P.E. Cladis and H. Pleiner, Macromol. 25, 7223 (1992).
[17] M.P. Petrov and L.V. Tsonev, Liq. Cryst.21, 543 (1996). [18] P.A. Kumar, M. Srinivasulu and V.G.K.M. Pisipati, Liq. Cryst.
26, 859 (1999).
[19] P. Swathi, P.A. Kumar and V.G.K.M. Pisipati , Liq. Cryst.27, 665 (2000).
[20] M. Srinivasulu, P.V.V. Satyanarayana, P.A. Kumar and V.G.K.M. Pisipati, Liq. Cryst.28, 1321 (2001).
[21] P. Swathi, S. Sreehari Sastry, P.A. Kumar, V.G.K.M. Pisipati Mol. Cryst. Liq. Cryst. 365, 523 (2001).
[22] B. Sreedevi, P.V. Chalapathi, M. Srinivasulu, V.G.K.M. Pisipati and D.M. Potukuchi, Liq. Cryst.31, 303 (2004).
[23] T. Chitravel, M.L.N. Madhu Mohan, V. Krishnakumar, Mol Cryst. Liq.Cryst.493, 17 (2008).
[24] V.N. Vijayakumar, K. Murugadass and M.L.N. Madhu Mohan, Mol. Cryst. Liq.Cryst, (2009). (Accepted for Publication). [25] M.L.N. Madhu Mohan, B. Arunachalam, C. Arravindh Sankar
Metal and Mater. Trans. A,39, 1192 (2008). M.L.N Madhu Mohan, B. Arunachalam Z.Naturforch,63a,435 (2008). [26] Madhu Mohan M.L.N and V.G.K.M Pisipati, Liq. Cryst.,26,
1609 (2000).
[27] P.A. Kumar., M.L.N. Madhu Mohan and. V.G.K.M. Pisipati, Liq. Crys,27, 1533 (2000).
[28] M.L.N. Madhu Mohan, P.A. Kumar, B.V.S.Goud and V.G.K.M. Pisipati, Mater. Res. Bull. 34, 2167 (1999). [29] M.L.N. Madhu Mohan, P.A. Kumar and V.G.K.M. Pisipati,
Ferroelectrics.227, 105 (1999).
[30] V.N. Vijayakumar. and M.L.N. Madhu Mohan, Ferroelectrics (2009).accepted for publication.
[31] G.W. Gray and J.W.G. Goodby, Smetic Liquid Crystals – Tex-tures and StrucTex-tures. London, Leonard Hill (1984).
[32] C. Noot, S.P. Perkins, and H.J Coles, Ferroelectrics.244, 331 (2000).
[33] P.G. de Gennes, (1974) The Physics of Liquid Crystals. Oxford Press, London.
[34] H.E. Stanley, (1971) Introduction to phase transition and criti-cal phenomena. Clarendon Press.
[35] S. Kobayashi , S. Ishibashi, Mol. Cryst. Liq. Cryst., 257, 181 (1994).
[36] W. Jong-Guang, C. Shu-Hsia , Jap. J. Appl. Phys., 33, 6249 (1994).
[37] T .Qian, P.L. Taylor, Phys. Rev .E.60, 2978 (1999). [38] G. Napoli , J. Appl. Maths.,71, 34 (2006).
[39] L.J.M. Schlangen, P. Alexandre , and H..J. Cornelissen., J. Appl. Phys.87, 3723 (2000).
[40] A.J. Hurd, S. Fraden, F. Lonberg, R.B. Meyer, J. de Physique,
46, 905 (1985).
[41] S.Zhang, B.Wen, S.S. Keast, M.E. Neubert, P.L. Taylor and C. Rosenblatt , Phys. Rev. Lett.,84, 4140 (2000).
[42] T.A. Rotinyan, E.I. Ryumtsev, S.B. Yazikov, JETP Lett.,46, 417 (1987).
[43] P.E. Cladiss, T. Garel and P. Pieranski, Phys. Rev. Lett., 57, 2841, (1986).
[44] I. Abdulhalim , G. Moddel, Mol. Cryst. Liq. Cryst.200, 79 (1991).
[45] L.A. Judge, E.E. Kriezis, S.J. Elston, Mol. Cryst. Liq. Cryst.,
366, 661 (2001).
[46] P. Schiller and F. Zeitler, Phys. Rev. E.,56, 531 (1997). [47] P. Schiller and F. Zeitler , J. de Physique II,5, 1835 (1995). [48] M. Petit, A.Daoudi M. Ismaili, and J.M. Buisine, Euro. Phys.
J. E.20, 327 (2006).