90
ABSTRACT:Introduction and objective: The global burden of disease (GBD) 2015 project, extends GBD analyses to include Brazilian federative units separately. We take advantage of GBD methodological advances to describe the current burden of diabetes and hyperglycemia in Brazil. Methods: Using standard GBD 2015 methods, we analyzed the burden of diabetes, chronic kidney disease due to diabetes and high fasting plasma glucose in Brazil and its states. Results: The age-standardized rate of disability-adjusted life years (DALYs) which was lost to high fasting plasma glucose, a category which encompasses burdens of diabetes and of lesser hyperglycemia, were 2448.85 (95% UI 2165.96-2778.69) /100000 for males, and 1863.90 (95% UI 1648.18-2123.47) /100000 for females in 2015. This rate was more than twice as great in states with highest burden, these being overwhelmingly in the northeast and north, compared with those with lowest rates. The rate of crude DALYs for high fasting plasma glucose, increased by 35% since 1990, while DALYs due to all non-communicable diseases increased only by 12.7%, and DALYs from all causes declined by 20.5%. Discussion:
The worldwide pandemic of diabetes and hyperglycemia now causes a major and growing disease burden in Brazil, especially in states with greater poverty and a lesser educational level. Conclusion: Diabetes and chronic kidney disease due to diabetes, as well as high fasting plasma glucose in general, currently constitute a major and growing public health problem in Brazil. Actions to date for their prevention and control have been slow considering the magnitude of this burden.
Keywords: Diabetes mellitus. Hyperglycemia. Epidemiology. Brazil.
The burden of diabetes and hyperglycemia
in Brazil and its states: indings from the
Global Burden of Disease Study 2015
A carga de doença devido ao diabetes e à hiperglicemia no Brasil
e seus estados: achados do Global Burden of Disease Study 2015
Bruce Bartholow DuncanI, Elisabeth Barboza FrançaII, Valéria Maria de Azeredo PassosIII,
Ewerton CousinI, Lenice Harumi IshitaniIV, Deborah Carvalho MaltaV, Mohsen NaghaviVI,
Meghan MooneyVI, Maria Inês SchmidtI ORIGINAL ARTICLE / ARTIGO ORIGINAL
IPrograma de Pós-graduação em Epidemiologia e Hospital de Clínicas de Porto Alegre da Universidade Federal do Rio Grande
do Sul –Porto Alegre (RS), Brasil.
IIPrograma de Pós-graduação em Saúde Pública da Universidade Federal de Minas Gerais – Belo Horizonte (MG), Brasil. IIIPrograma de Pós-graduação em Ciências do Adulto da Universidade Federal de Minas Gerais – Belo Horizonte (MG), Brasil. IVSecretaria Municipal de Saúde de Belo Horizonte – Belo Horizonte (MG), Brasil.
VDepartamento de Enfermagem Materno-Infantil e Saúde Pública da Escola de Enfermagem da Universidade Federal de Minas
Gerais – Belo Horizonte (MG), Brasil.
VIInstitute for Health Metrics and Evaluation da University of Washington – Seattle (WA), Estados Unidos.
Corresponding author: Bruce Bartholow Duncan. Postgraduate Program in Epidemiology. Universidade Federal do Rio Grande do Sul. Rua Ramiro Barcelos, 2.600, sala 414, Santana, CEP: 90035-003, Porto Alegre, RS, Brasil. E-mail: [email protected]
91
INTRODUCTION
Over the past several decades, diabetes mellitus has become increasingly prevalent around the world1. Given its major impact in increasing the risk for a series of diseases, including car-diovascular diseases, it has also risen as a leading cause of death and disability. The GBD2015 study estimates that diabetes is now the 11th leading cause of disability adjusted life years (DALYs) in the world, and that high fasting plasma glucose is the ifth leading risk, causing DALYs in women, and seventh leading risk in men.
Brazil is no exception in this regard, and currently is the fourth leading country, in terms of the absolute number of people with diabetes2.
In recent years, the Global Burden of Disease Project has established itself as the world’s leader in the descriptive epidemiology of disease burden. The GBD 2015 project, for the irst time, extends GBD analyses for Brazil beyond the country level to include each Brazilian federative unit separately.
The objective of this report is to take advantage of the methodological advances aforded by GBD 2015, to describe the current burden of diabetes and hyperglycemia in Brazil, expressing not just overall burden, but highlighting the surprisingly large diferences that exist across states.
METHODS
The GBD 2015 includes multiple assessments of disease burden, from 1990 to the pres-ent. Detailed descriptions of methodology and approach of GBD 2015 have been published
RESUMO:Introdução e objetivo: O projeto Global Burden of Disease (GBD) 2015 estendeu suas análises para incluir unidades federativas brasileiras de maneira separada. Aproveitamos os avanços metodológicos do GBD para descrever a carga atual de diabetes e hiperglicemia no Brasil. Métodos: Utilizando os métodos padrão GBD 2015, analisamos a carga de diabetes, de doença renal crônica por diabetes e de glicemia de jejum elevada no Brasil e seus estados. Resultados: A taxa padronizada por idade de anos de vida ajustados por morte ou incapacidade (DALYs) perdidos devido à glicemia de jejum elevadafoi de 2448,85 (95% IU 2165,96-2778,69)/100000 para homens e 1863,90 (95% IU 1648,18-2123,47)/100.000 para as mulheres em 2015. Esta taxa foi mais do que o dobro em estados com maior carga, quase sempre no Nordeste e Norte, em comparação com aqueles com as taxas mais baixas. A taxa bruta de DALYs devido à glicose de jejum elevada aumentou 35% desde 1990, enquanto que a dos DALYs devido a todas as doenças não transmissíveis aumentou apenas 12,7% e a taxa dos DALYs devido a todas as causas diminuiu 20,5%. Discussão: A pandemia mundial de diabetes e hiperglicemia atualmente causa uma grande e crescente carga de doenças no Brasil, especialmente em estados com maior pobreza e menor escolaridade. Conclusão: O diabetes e a doença renal crônica por diabetes, bem como a glicemia de jejum elevada constituem atualmente um grande e crescente problema de saúde pública no Brasil. As ações até o momento para sua prevenção e controle tem sido tímidas considerando a magnitude dessa carga.
92
elsewhere3-6. We generated the estimates presented here with the Institute for Health Metrics and Evaluation GBD 2015 visualizations7.
The GBD 2015 framework recognizes diabetes both as a disease, with its proper outcomes, as a distinct cause of chronic kidney disease, and as one of the multiple causes of a series of other diseases8. This latter expression of its pathology is accounted for within the risk factor category of high fasting plasma glucose, which also encompasses the efects of lower levels of hypergly-cemia. Figure 1 shows this GBD combined burden approach. Within it, part of the burden is ascribed directly to diabetes — deined through ICD codes E10-13, except “.2” codes, related to renal disease — and includes that due to living with diabetes (“uncomplicated diabetes”), to inherent complications such as hypoglycemic and hyperglycemic coma and death, and to its tra-ditional, “microvascular” complications (vision loss, including severe low vision and blindness; neuropathy; and amputation)9. This direct burden is shown in the part of Figure 1 highlighted by the dotted red line3. Chronic kidney disease due to diabetes is treated as a separate item. The rest of the burden, which results from the other recognized complications of both diabe-tes and lesser hyperglycemia10 — ischemic heart disease, ischemic stroke, hemorrhagic stroke, other CKD (hypertensive CKD, glomerulonephritis CKD, and other CKD) and tuberculosis4 — is accounted for through high fasting plasma glucose. In these latter calculations, the theoretical minimum risk exposure level of glucose is taken to be 4.8–5.4 mmol/L or 86.4–97.2 mg/dl11.
The GBD uses four main indicators to calculate disease burden – mortality, years of life lost due to premature mortality (YLLs), years of life lived with disability (YLDs), and the sum of the latter two — disability-adjusted life years (DALYs). In brief, YLLs are calculated multiplying the number of deaths from diabetes or due to high fasting plasma glucose in each age group by the reference life expectancy at the average age of death for those who die in that age group5. YLDs were obtained initially for each diabetes sequelae by multiply-ing its prevalence times, to its disability weight in each age-, sex-, and year-speciic strata, with total YLDs then being aggregated across strata and sequelae10. Disability weights were derived from population-based surveys of the general public12. All results are standardized to the world population5. In addition, in order to take into account diferences in socioeco-nomic level, when comparing disease burden across geographies, the GBD 2015 created its so-called socio demographic index, based on the average income per person, educational qualiications, and total fertility rate5. To describe the degree of conidence in the indicators presented, and given the uncertainty in the initial data and subsequent calculations, the GBD generates 95% uncertainty intervals for its metrics. These estimate and sum up uncertainty across the key steps of estimation frequently, by repeating the estimation step 1,000 times and characterizing the 95% boundaries of the data so generated. The data are presented for Brazil as a whole, and frequently also separately for Brazilian states and the Federal District.
Results are presented overall for Brazil and separately for each of its federative units (states and the Federal District, hereafter called “states”).
Figure 1. Dimensions of assessment of the disease burden of diabetes and high fasting plasma glucose, and burden attributable to its risk factors in the Global Burden of Disease 2015 (GBD 2015) study3.
High body mass index
Low physical activity
Diet low in whole grain
Diet high in processed meat
Diete high in sweetened beverages
Diet high in red meat
Smoking (5 year lag)
Alcohol use
Diabetes Mellitus
Uncomplicated diabetes
Moderate vision loss
Severe vision loss
With treatment
Without treatment
Blindness
Ischemic heart disease
Ischemic stroke
Hemorrhagic stroke
Chronic kidney disease
Tuberculosis High Fasting Plasma
Glucose
Prediabetes
Diabetic foot due to neuropathy
Diabetic neuropathy
Retinopathy
Diabetic neuropathy and amputation
94
RESULTS
Figure 2 shows the crude rate of death in Brazil and its states due to diabetes and to chronic kidney disease due to diabetes. In Brazil, in 2015, the coeicient of mortality due to diabetes was 26.82 (95% UI 25.01–28.55)/100,000 for males, and 33.18 (95% UI 31.06– 35.23)/100,000 for females, and for chronic kidney disease due to diabetes, 11.08 (95% UI 9.86–13.65)/100,000 for males, and 9.65 (95% UI 8.95–10.42)/100,000 for females.
Among the states, considering the two causes jointly, coeicients varied over a wide range, that of Paraiba, for instance, being more than 2.5 times in those of Amapa or the Federal District. In general, in the crude analyses, lesser mortality was seen in the north region and in isolated states, such as São Paulo and Goias, among other regions. Greater mortality was
Figure 2. Crude death rates (per 100,000) for males and females resulting from diabetes (light bars) and chronic kidney disease due to diabetes (dark bars), Brazil and its states, 2015.
Males, All ages, 2015 Females, All ages, 2015
Amapa
Espirito Santo Sao Paulo
Rio Grande do Sul
Roraima
Ceara
Mato Grosso do Sul
Pernambuco
Bahia Distrito Federal
Tocantins Rondonia
Piaui Acre
Brazil
Mato Grosso
Rio Grande do Norte
Rio de Janeiro Amazonas
Minas Gerais
Para
Sergipe
Maranhao
Goias
Parana Santa Catarina
Alagoas
Paraiba
60 60
Deaths per 100,000
95
present generally in the Northeast region and notably in Rio de Janeiro. Considering the individual causes of death, one sees that crude diabetes mortality coeicients were higher in the northeast, and CKD due to diabetes especially high in Rio de Janeiro. When these data are age-standardized, the joint mortality of these two conditions is higher in the states of the northeast, generally followed by states in the north (data not shown).
Figure 3 shows similar data, now for the crude rate of DALYs. Overall, this rate for dia-betes was 998.17 (95% UI 851.77–1171.37)/100,000 for males, and 1031.85 (95% UI 871.17– 1216.03)/100,000 for females, and for chronic kidney disease due to diabetes, it is 282.83 (95% UI 252.41–354.84)/100,000 for males, and 239.29 (95% UI 220.03–258.44)/100,000 for females. The distribution by states was similar to that for crude deaths.
Figure 3. Crude rates of disability adjusted life years lost (per 100,000 person-years) by males and females as a result of diabetes (light bars) and of chronic kidney disease due to diabetes (dark bars), Brazil and its states, 2015.
Males, All ages, 2015 Females, All ages, 2015
Distrito Federal
Ceara Para
Mato Grosso do Sul
Sao Paulo
Espirito Santo Rondonia
Sergipe
Alagoas Amapa
Minas Gerais Goias
Piaui Acre
Rio Grande do Sul Mato Grosso
Pernambuco
Rio de Janeiro Amazonas
Brazil
Santa Catarina
Rio Grande do Norte
Maranhao Roraima
Parana Tocantins
Bahia
Paraiba
1.5k 500
DALYs per 100,000
96
Figure 4 also shows rates of DALYs, now age standardized. For Brazil, the age-stan-dardized rate for diabetes was 1158.02 (95% UI 999.88–1347.11)/100,000 for males, and 1054.43 (95% UI 897.09–1238.27)/100,000 for females, and for chronic kidney disease due to diabetes 331.53 (95% UI 293.31–408.40)/100,000 for males, and 242.06 (95% UI 222.84– 260.89)/100,000 for females. As can be seen when comparing this igure with the previous one, controlling for the age structure in state populations produces important diferences in the relative ranking of states. DALY rates, similar to those seen for age-standardized mor-tality, are generally higher in the northeast, and lower in the wealthier and more socioeco-nomically developed states, such as São Paulo, the Federal District, and those of the south-ern region and Minas Gerais.
Figure 4. Age-standardized rates of disability-adjusted life years lost (per 100,000 person-years) by males and females as a result of diabetes (light bars) and of chronic kidney disease due to diabetes (dark bars), Brazil and its states, 2015.
Males, Age-standardized, 2015 Females, Age-standardized, 2015
2k 1.5k 500
DALYs per 100,000
DALYs per 100,0001k 500 0 0 1k 1.5k 2k
Sao Paulo
Amapa Parana
Tocantins
Rio Grande do Sul
Acre Ceara
Pernambuco
Paraiba Distrito Federal
Rio de Janeiro
Brazil
Rio Grande do Norte Minas Gerais
Rondonia
Mato Grosso
Bahia
Alagoas Santa Catarina
Amazonas Espirito Santo
Piaui
Sergipe
Goias
Para
Mato Grosso do Sul
Roraima
97
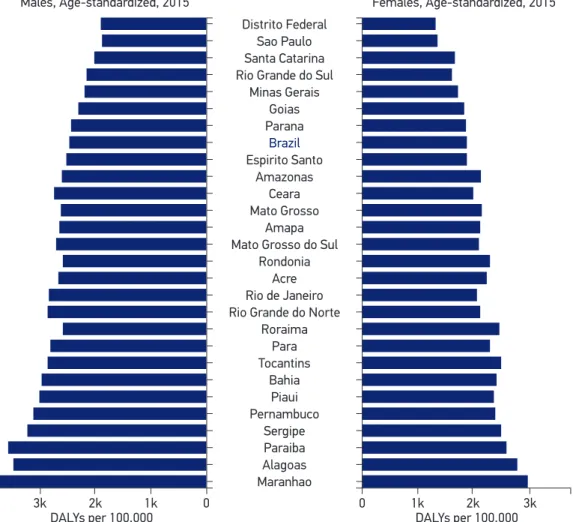
Figure 5 shows age-standardized DALYs for high fasting plasma glucose. As shown in Figure 1, this approach captures the burden shown in the previous igure, and additionally the large burden of diabetes expressed via cardiovascular disease, the moderate-sized burden of diabetes expressed via other causes of CKD and the much smaller burden expressed via tuberculosis. Overall, the age-standardized rate for high fasting plasma glucose was 2448.85 (95% UI 2165.96–2778.69)/100,000 for males, and 1863.90 (95% UI 1648.18–2123.47)/100,000 for females, the overall burden being 64.4% and 43.8% respectively, which is greater when one considers only deaths and sequelae directly due to diabetes, and to CKD due to diabe-tes. In terms of rank, all of the top 10 and none of the lowest 9 Brazilian states are located in the northeast or the north. In 1990 (data not shown), the risk was more equally distrib-uted across Brazil’s regions, with 7 of the top 10 ranked states and 7 of the 9 lowest ranked states being located in the northeast and the north.
Figure 5.Age-standardized rates of disability adjusted life years lost (per 100,000 person-years) by males and females as a result of high fasting plasma glucose, Brazil and its states, 2015.
Males, Age-standardized, 2015 Females, Age-standardized, 2015
Distrito Federal
Amapa Parana
Roraima
Rio Grande do Sul
Acre Amazonas
Bahia
Paraiba Sao Paulo
Mato Grosso do Sul
Brazil
Para
Minas Gerais
Rio de Janeiro Ceara
Piaui
Alagoas Santa Catarina
Rondonia Espirito Santo
Tocantins
Sergipe
Goias
Rio Grande do Norte Mato Grosso
Pernambuco
Maranhao
3k 1k
DALYs per 100,000
98
These age-standardized DALYs, for Brazil, were virtually unchanged from 1990 (2,089/100,000) to 2015 (2,091/100,000). However, with the aging of the population over this period, the overall crude rate of DALYs due to high fasting plasma glucose in Brazil increased to 35.2%, from 1,441/100,000 in 1990, to 1,948/100,000 in 2015. This compares to a smaller increase, 12.7%, in DALYs due to all NCDs, and contrasts markedly with the 20.5% decrease in crude DALYs from all causes over this same period.
To place the Brazilian burden of high fasting plasma glucose in an international con-text, it is 11% and 8% lower for males and females, respectively, than the average among socio-demographically similar countries (having a middle level socio-demographic index), 22% and 35% higher, respectively, than in the GBD-deined southern Latin American coun-tries – Chile, Argentina and Uruguay; and 42% and 52% lower, respectively, than in the GBD-deined Central American countries, which span from Mexico to Columbia and Venezuela.
DISCUSSION
The data presented here show a large and unevenly distributed burden of diabetes and high fasting plasma glucose in Brazil. For every 100 person-years lived, almost a potentially additional 2 years of high-quality life is lost to death and complications of diabetes and lesser states of hyperglycemia. With the population which is aging, the crude burden is growing at a rate greater than that of NCDs overall and in marked contrast to that of the crude over-all burden from over-all diseases, which is fover-alling. The disease burden of diabetes and hypergly-cemia, vary markedly across Brazilian states.
These indings in Brazil are a consequence of the worldwide pandemics of diabetes and of its main biologic risk factor – obesity. Considering all nations, from1990 to 2015, high body mass index has risen from the world’s 13th to its 4th leading risk factor, in terms of DALYs, and high fasting plasma glucose from the world’s 10th to the 3rd leading risk factor4.
Diabetes, which, from an international public health standpoint, was a curiosity 40 years ago, presenting high prevalence only in select native American and Paciic islander populations, has grown to be a major and ever escalating concern. Although the increased prevalence of diabetes in the United States has frequently been cited, a considerably higher prevalence of diabetes is now seen throughout most of the Middle East and Central Asia, Mexico and some countries in the Caribbean, and in several other countries in Asia1. It is now estimated that between 30% and 70% of adults living in the United States, Canada, Australia, Mexico and Denmark will develop diabetes during their lifetime13-17. Preliminary data form the ELSA-Brasil cohort, which show a high prevalence above 60 years of age, and suggest that at least a third of Brazilian adults will develop diabetes during their lifetime18.
99
gradient across educational levels, with those having less than a complete elementary school education and having a 59% greater prevalence of diabetes, after adjustment of age, sex, body mass index, and ethnicity18. One might speculate that this rise in burden in the north-east is in part due to the greater risk of diabetes in those sufering under nutrition in fetal and early life and who are now exposed to the nutritional inadequacies and caloric excess of an unhealthy food environment19. Might this shift have been blunted if greater attention to the risks of obesity and diabetes and greater public health measures to prevent them had been coupled with anti-poverty eforts implemented principally in these regions over recent decades?
Perhaps due to the slow rise over decades in the prevalence of obesity and of diabetes, these diseases have received less attention than they merit, considering the burden they cur-rently exert. In this regard, our data are an additional demonstration of the urgent need for the Brazilian Ministry of Health, the health sector, and the Brazilian society in general to efectively confront the problem. Although stimulating lifestyle change in high risk individ-uals has been shown to be efective in preventing diabetes20,21, this clinical strategy, in and of itself, will be inadequate, given that much of the “prevented” disease is in fact merely delayed, many will be unwilling to undertake the changes necessary within the current social context, and an important fraction of diabetes develops in individuals who would not have been identiied as at high risk only a few years earlier22. In addition, as most importantly, the limitations of the so-called high risk strategy become even clearer within the vision of diabetes as a life course disease, that is to say, a disease that develops slowly over the full lifespan of an individual23,24. In consonance with this reality, preventive measures should span the life course, beginning with actions related to an individual’s fetal experience, e.g. guaranteeing a healthy birth weight. Others must occur during infancy, e.g. stimulation of exclusive breastfeeding and avoidance of sweet foods, and in childhood and adolescence, when lifelong dietary and physical activity habits are developed. Avoiding weight gain and obesity in childhood and early adulthood are further steps in this process. Finally, early iden-tiication of high-risk individuals, mainly in mid- and late adulthood, and adequate orienta-tion and support for lifestyle change are necessary. Aside from all of this, adequate health care prevision for the prevention of complications once diabetes developed will be required.
However, as most of the above-mentioned actions deal with healthy individuals, they fall mainly within the realm of population-based rather than clinical interventions, involv-ing makinvolv-ing healthy choices easier, and more prevalent in terms of nutrition and physical activity, among others. In addition, if present concerns of a role for environmental pollut-ants in the etiology of diabetes are conirmed25,26, public health actions of another nature will also be necessary.
100
only a self-reported diagnosis, and diferential access to medical care alter the probability that diabetes will be detected when present. As the quality of reporting and access to medical care are worse in the north region, estimates for states of this region are subject to greater error. Of inal note, these estimates of the disease burden of diabetes and hyperglycemia are likely to be seriously underestimated, as about 40% of deaths due to diabetes are currently believed to result from non-vascular complications, most of which are not taken into consideration in GBD 2015 calculations. These complications include many types of cancer, chronic obstruc-tive pulmonary disease, pneumonia, and other infections. Although they also include CKD, this category represents a relatively small fraction of total non-vascular deaths27.
CONCLUSION
Diabetes, chronic kidney disease due to diabetes, as well as high fasting plasma glucose in general, cause a large and growing burden of disease in Brazil. Public health and clinical actions to date for the prevention and control of diabetes and obesity, its main risk factor, have been slow considering the current and growing disease burden presented in this report.
REFERENCES
1. NCD Risk Factor Collaboration (NCD-RisC). Worldwide trends in diabetes since 1980: a pooled analysis of 751 population-based studies with 4·4 million participants. The Lancet2016 Apr 9;387(10027):1513-30. 2. International Diabetes Federation. IDF Diabetes
Atlas. 8ª ed. Brussels: IDF; 2016.
3. Moradi-Lakeh M, Forouzanfar MH, El Bcheraoui C, Daoud F, Afshin A, Hanson SW, et al. High Fasting Plasma Glucose, Diabetes, and Its Risk Factors in the Eastern Mediterranean Region, 1990–2013: Findings From the Global Burden of Disease Study 2013. Diabetes Care 2016 Oct 26;40(1): 22-9.
4. Forouzanfar MH, Afshin A, Alexander LT, Anderson HR, Bhutta ZA, Biryukov S, et al. Global, regional, and national comparative risk assessment of 79 behavioural, environmental and occupational, and metabolic risks or clusters of risks, 1990–2015: a systematic analysis for the Global Burden of Disease Study 2015. The Lancet 2016 Oct 8;388(10053): 1659-724.
5. Wang H, Naghavi M, Allen C, Barber RM, Bhutta ZA, Carter A, et al. Global, regional, and national life expectancy, all-cause mortality, and cause-specific mortality for 249 causes of death, 1980– 2015: a systematic analysis for the Global Burden of
Disease Study 2015. The Lancet 2016Oct 8;388(10053): 1459-544.
6. Kassebaum NJ, Arora M, Barber RM, Bhutta ZA, Brown J, Carter A, et al. Global, regional, and national disability-adjusted life-years (DALYs) for 315 diseases and injuries and healthy life expectancy (HALE), 1990–2015: a systematic analysis for the Global Burden of Disease Study 2015. The Lancet 2016 Oct 8;388(10053):1603-58.
7. GBD Compare | IHME Viz Hub.Disponível em: http://vizhub.healthdata.org/gbd-compare (Acessado em: 1.º de dezembro de 2016).
8. Collaboration TERF. Diabetes Mellitus, Fasting Glucose, and Risk of Cause-Speciic Death. N Engl J Med 2011 Mar 3;364(9):829-41.
9. Salomon JA, Haagsma JA, Davis A, Noordhout CM, Polinder S, Havelaar AH, et al. Disability weights for the Global Burden of Disease 2013 study. Lancet Glob Health2015 Nov1;3(11):e712-23.
101
11. Singh GM, Danaei G, Farzadfar F, Stevens GA, Woodward M, Wormser D, et al. The age-speciic quantitative effects of metabolic risk factors on cardiovascular diseases and diabetes: a pooled analysis. PLoS One 2013;8(7):e65174.
12. Salomon JA, Haagsma JA, Davis A, de Noordhout CM, Polinder S, Havelaar AH, et al. Disability weights for the Global Burden of Disease 2013 study. Lancet Glob Health 2015 Nov;3(11):e712-23.
13. Gregg EW, Zhuo X, Cheng YJ, Albright AL, Narayan KMV, Thompson TJ. Trends in lifetime risk and years of life lost due to diabetes in the USA, 1985–2011: a modelling study. Lancet Diabetes Endocrinol 2014 Nov 1;2(11):867-74.
14. Magliano DJ, Shaw JE, Shortreed SM, Nusselder WJ, Liew D, Barr ELM, et al. Lifetime risk and projected population prevalence of diabetes. Diabetologia 2008 Dec;51(12):2179-86.
15. Meza R, Barrientos-Gutierrez T, Rojas-Martinez R, Reynoso-Noverón N, Palacio-Mejia LS, Lazcano-Ponce E, et al. Burden of type 2 diabetes in Mexico: past, current and future prevalence and incidence rates. Prev Med 2015Dec;81:445-50.
16. Turin TC, Saad N, Jun M, Tonelli M, Ma Z, Barnabe CCM, et al. Lifetime risk of diabetes among First Nations and non-First Nations people. Can Med Assoc J 2016 Sep 19;188(16):1147-53.
17. Carstensen B, Kristensen JK, Ottosen P, Borch-Johnsen K, Steering Group of the National Diabetes Register. The Danish National Diabetes Register: trends in incidence, prevalence and mortality. Diabetologia 2008Dec;51(12):2187-96.
18. Schmidt M, Hofmann JF, Diniz MFS, Lotufo PA, Griep R, Bensenor IM, et al. High prevalence of diabetes and intermediate hyperglycemia — The Brazilian Longitudinal Study of Adult Health (ELSA-Brasil). Diabetol Metab Syndr 2014;6(1):123.
19. Yarmolinsky J, Mueller NT, Duncan BB, Chor D, Bensenor IM, Griep RH, et al. Sex-speciic associations
of low birth weight with adult-onset diabetes and measures of glucose homeostasis: Brazilian Longitudinal Study of Adult Health. Sci Rep 2016 Nov 15;6:37032.
20. Tuomilehto J, Schwarz P, Lindström J. Long-Term Benefits From Lifestyle Interventions for Type 2 Diabetes Prevention. Diabetes Care 2011 May 1;34(Suppl.2):S210-4.
21. Diabetes Prevention Program Research Group. 10-year follow-up of diabetes incidence and weight loss in the Diabetes Prevention Program Outcomes Study. The Lancet 2009 Nov;374(9702):1677-86.
22. Schmidt MI, Duncan BB, Bang H, Pankow JS, Ballantyne CM, Golden SH, et al. Identifying individuals at high risk for diabetes: the Atherosclerosis Risk in Communities study. Diabetes Care 2005 Aug;28(8):2013-8. 23. Darnton-Hill I, Nishida C, James WPT. A life course
approach to diet, nutrition and the prevention of chronic diseases. Public Health Nutr 2004Feb;7(1A):101-21. 24. Delisle H. Programming of chronic disease by impaired
fetal nutrition: evidence and implications for policy and intervention strategies. Geneva: WHO; 2001. Disponível em: http://www.who.int/nutrition/publications/ obesity/WHO_NHD_02.3/en/ (Acessado em: 12 de janeiro de 2016).
25. Magliano DJ, Loh VHY, Harding JL, Botton J, Shaw JE. Persistent organic pollutants and diabetes: A review of the epidemiological evidence. Diabetes Metab 2014 Feb;40(1):1-14.
26. Lee D-H, Porta M, Jacobs DR, Vandenberg LN. Chlorinated persistent organic pollutants, obesity, and type 2 diabetes. Endocr Rev 2014 Aug;35(4):557-601. 27. Collaboration TERF. Diabetes Mellitus, Fasting Glucose, and Risk of Cause-Speciic Death. N Engl J Med 2011 Mar 3;364(9):829-41.
Received on: 01/20/2017