www.atmos-chem-phys.net/11/873/2011/ doi:10.5194/acp-11-873-2011
© Author(s) 2011. CC Attribution 3.0 License.
Chemistry
and Physics
An integrated modeling study on the effects of mineral dust and sea
salt particles on clouds and precipitation
S. Solomos1, G. Kallos1, J. Kushta1, M. Astitha1,2, C. Tremback3, A. Nenes4,5, and Z. Levin6
1University of Athens, School of Physics, University of Athens Campus, Bldg. Phys-5, 15784 Athens, Greece 2Energy, Environment and Water Research Centre, The Cyprus Institute, Nicosia, Cyprus, Greece
3ATMET LLC P.O. Box 19195, Boulder, CO 80308-2195, USA
4School of Chemical and Biomolecular Engineering, Georgia Institute of Technology, USA 5School of Earth and Atmospheric Sciences, Georgia Institute of Technology, USA 6Dept. of Geophysics and Planetary Sciences, Tel Aviv University, Tel Aviv, Israel
Received: 24 August 2010 – Published in Atmos. Chem. Phys. Discuss.: 14 October 2010 Revised: 23 December 2010 – Accepted: 24 January 2011 – Published: 31 January 2011
Abstract. This report addresses the effects of pollution on the development of precipitation in clean (“pristine”) and polluted (“hazy”) environments in the Eastern Mediterranean by using the Integrated Community Limited Area Modeling System (ICLAMS) (an extended version of the Regional At-mospheric Modeling System, RAMS). The use of this model allows one to investigate the interactions of the aerosols with cloud development. The simulations show that the on-set of precipitation in hazy clouds is delayed compared to pristine conditions. Adding small concentrations of GCCN to polluted clouds promotes early-stage rain. The addition of GCCN to pristine clouds has no effect on precipitation amounts. Topography was found to be more important for the distribution of precipitation than aerosol properties. In-creasing by 15% the concentration of hygroscopic dust par-ticles for a case study over the Eastern Mediterranean re-sulted in more vigorous convection and more intense up-drafts. The clouds that were formed extended about three kilometers higher, delaying the initiation of precipitation by one hour. Prognostic treatment of the aerosol concentrations in the explicit cloud droplet nucleation scheme of the model, improved the model performance for the twenty-four hour accumulated precipitation. The spatial distribution and the amounts of precipitation were found to vary greatly between the different aerosol scenarios. These results indicate the large uncertainty that remains and the need for more accu-rate description of aerosol feedbacks in atmospheric models and climate change predictions.
Correspondence to:G. Kallos (kallos@mg.uoa.gr)
1 Introduction
874 S. Solomos et al.: An integrated modeling study on the effects of mineral dust and sea salt particles Mineral dust and sea salt are major components of
par-ticulate matter in the atmosphere. Desert dust accounts for more than 50% of the global aerosol load (Andreae et al., 1986; Zender et al., 2004) and the long range trans-port of dust particles can influence the composition and dy-namic state of the atmosphere thousands of kilometers down-wind of their source region (Kallos et al., 2007). Under favourable conditions, dust particles originating from North-ern and Central Africa may be elevated and travel towards the Atlantic and Caribbean (Karyampudi, 1979; Karyampudi et al., 1999; Prospero et al., 2005; Kallos et al., 2006) or cross the Mediterranean towards Europe affecting both air quality and meteorology in Southern Europe (Mitsakou et al., 2008; Querol et al., 2009). Also Saharan dust radiative effects have a significant impact on the Asian monsoon (Lau et al., 2006; Lau and Kim, 2006) and on the West African monsoon and Atlantic climate (Lau et al., 2009; Sun et al., 2009). Dust particles are known to be efficient ice nuclei (IN) and con-tribute to the formation of ice crystals in high clouds (De-Mott et al., 2003a; Teller and Levin, 2006). During their transport in the atmosphere the dust particles interact with sea salt or anthropogenic pollutants, mainly sulfates and ni-trates, and form internally mixed particles, consisting of a core of mineral dust with coatings of soluble material (Levin et al., 1996). The soluble coating on the dust particles con-verts them into efficient CCN while maintaining their ability as IN (Levin et al., 2006; Astitha and Kallos, 2008; Astitha et al., 2010). Sea- salt particles are also very efficient CCN and is the dominant source of particulate matter in the marine boundary layer (Gong at al., 2002; Pierce and Adams, 2006). The amount of particles that can act as CCN and nucle-ate cloud droplets depends on the concentration of available particles, their size distribution and their chemical composi-tion (e.g., K¨ohler, 1936; Charlson et al., 2001; Nenes et al., 2002). Additionally, absorption of solar radiation by dust, results in heating of the dust layer and subsequently in modi-fication of the thermodynamic and dynamical structure of the atmosphere, thus leading to suppression or enhancement of precipitation depending on the type of the clouds (Yin and Chen, 2007; Lau et al., 2009; Wilcox et al., 2010). The in-terplay between cloud dynamics and the composition of the atmosphere may delay the initiation of precipitation or steer a storm towards a different location and precipitation amounts will vary accordingly (Lynn et al., 2005b; van den Heever and Cotton, 2007; Rosenfeld at al., 2007; Zhang et al., 2007; Cotton et al., 2007).
By modifying the microphysical, optical and radiative properties of clouds, dust and salt particles contribute to the indirect aerosol effect and introduce significant uncertainty in assessing the anthropogenic impact on climate change (Charlson et al., 1990; Lohmann and Feichter, 2005; IPCC, 2007; Andreae and Rosenfeld, 2008). The effects of dust and sea salt on regional climate depend also on the local topog-raphy, soil characteristics (e.g., Junkermann et al., 2009) and cloud type (Seifert and Beheng, 2006). Therefore, the effects
of atmospheric composition on clouds and precipitation are not monotonic and may differ from one area to another.
The complexity of the above processes and the possible in-teractions and feedbacks across all scales in the climate sys-tem, indicate the need for an integrated approach (Stevens and Feingold, 2009). The main objectives of the paper are to : (1) Describe the new RAMS/ICLAMS model develop-ment, (2) Perform sensitivity and evaluation tests for various model elements, (3) Perform a full model analysis of a case study where adequate data sets were available, (4) Test the ef-fects of natural aerosols on clouds and precipitation. A brief description of the new model developments is presented in Sect. 2. Section 3 includes idealized sensitivity tests as well as the analysis of an experimental case. Finally the main re-sults are summarized in Sect. 4.
2 Description of ICLAMS
The Regional Atmospheric Modeling System (RAMSv6) (Pielke et al., 1992; Cotton et al., 2003) was the basis for developing the Integrated Community Limited Area Mod-eling System (ICLAMS) used in this study. This new ver-sion of the model has been designed for air pollution and climate research applications and includes several new ca-pabilities related to physical and chemical processes in the atmosphere. The model components are summarised in Ta-ble 1; new developments include an interactive desert-dust and sea-salt module, biogenic and anthropogenic pollutants parameterization, gas/cloud/aerosol chemistry, explicit cloud droplet nucleation scheme and an improved radiative transfer scheme. Each process is in modular form, and each compo-nent can be activated/deactivated during a simulation. The two-way interactive nesting capabilities of the model allow the use of regional scale domains together with several high resolution nested domains. This feature is important for the purpose of the present work since it allows for simultaneous description of long range transport phenomena and aerosol-cloud interactions at aerosol-cloud resolving scales. The explicit two-moment cloud microphysics scheme of the model is used to describe the aerosol-cloud interactions. For clarity, the dust and sea salt cycles parameterization together with the deposi-tion schemes are described in Appendix A. Radiative transfer and cloud droplet nucleation modules of the model are briefly described in the following sections.
2.1 Radiation parameterization
The basic options for shortwave/longwave radiative transfer in RAMS include the Chen and Cotton (1983) and the Har-rington (1997) schemes. The former treats all hydromete-ors as liquid-phase; the latter scheme includes three short-wave and five infrared bands interacting with ice and liq-uid condensates and with model gases. Radiation transfer
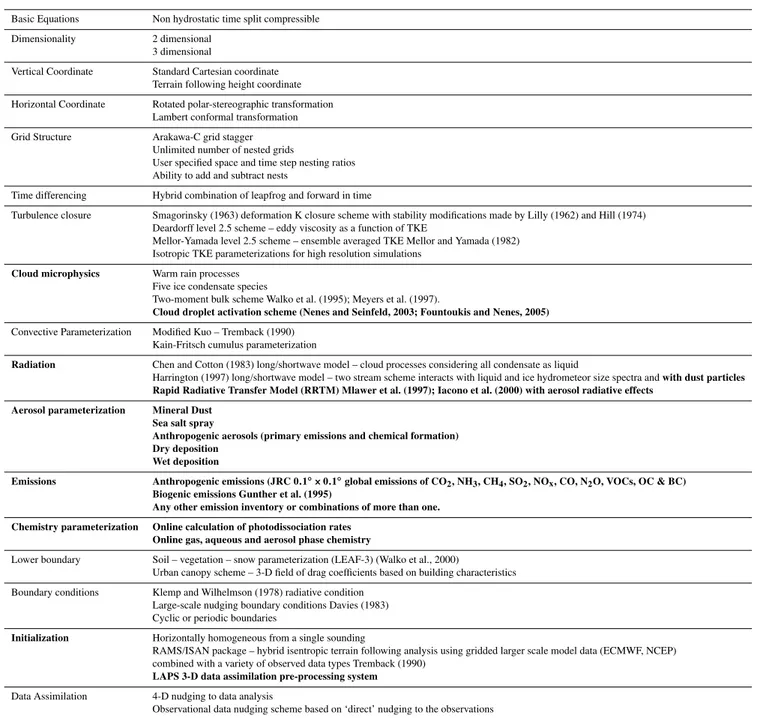
Table 1.ICLAMS configuration options. New capabilities (compared to RAMS) are shown in bold.
Basic Equations Non hydrostatic time split compressible
Dimensionality 2 dimensional 3 dimensional
Vertical Coordinate Standard Cartesian coordinate Terrain following height coordinate
Horizontal Coordinate Rotated polar-stereographic transformation Lambert conformal transformation
Grid Structure Arakawa-C grid stagger Unlimited number of nested grids
User specified space and time step nesting ratios Ability to add and subtract nests
Time differencing Hybrid combination of leapfrog and forward in time
Turbulence closure Smagorinsky (1963) deformation K closure scheme with stability modifications made by Lilly (1962) and Hill (1974) Deardorff level 2.5 scheme – eddy viscosity as a function of TKE
Mellor-Yamada level 2.5 scheme – ensemble averaged TKE Mellor and Yamada (1982) Isotropic TKE parameterizations for high resolution simulations
Cloud microphysics Warm rain processes Five ice condensate species
Two-moment bulk scheme Walko et al. (1995); Meyers et al. (1997).
Cloud droplet activation scheme (Nenes and Seinfeld, 2003; Fountoukis and Nenes, 2005) Convective Parameterization Modified Kuo – Tremback (1990)
Kain-Fritsch cumulus parameterization
Radiation Chen and Cotton (1983) long/shortwave model – cloud processes considering all condensate as liquid
Harrington (1997) long/shortwave model – two stream scheme interacts with liquid and ice hydrometeor size spectra andwith dust particles Rapid Radiative Transfer Model (RRTM) Mlawer et al. (1997); Iacono et al. (2000) with aerosol radiative effects
Aerosol parameterization Mineral Dust Sea salt spray
Anthropogenic aerosols (primary emissions and chemical formation) Dry deposition
Wet deposition
Emissions Anthropogenic emissions (JRC 0.1◦×0.1◦global emissions of CO2, NH3, CH4, SO2, NOx, CO, N2O, VOCs, OC & BC)
Biogenic emissions Gunther et al. (1995)
Any other emission inventory or combinations of more than one. Chemistry parameterization Online calculation of photodissociation rates
Online gas, aqueous and aerosol phase chemistry
Lower boundary Soil – vegetation – snow parameterization (LEAF-3) (Walko et al., 2000)
Urban canopy scheme – 3-D field of drag coefficients based on building characteristics
Boundary conditions Klemp and Wilhelmson (1978) radiative condition Large-scale nudging boundary conditions Davies (1983) Cyclic or periodic boundaries
Initialization Horizontally homogeneous from a single sounding
RAMS/ISAN package – hybrid isentropic terrain following analysis using gridded larger scale model data (ECMWF, NCEP) combined with a variety of observed data types Tremback (1990)
LAPS 3-D data assimilation pre-processing system Data Assimilation 4-D nudging to data analysis
Observational data nudging scheme based on ‘direct’ nudging to the observations
calculations options in ICLAMS have been extended with the implementation of the Rapid Radiative Transfer Model (RRTM) for both SW and LW bands (Mlawer et al., 1997; Ia-cono et al., 2000). RRTM is a spectral-band radiative transfer scheme based on the correlated−kmethod (Lacis and Oinas, 1991; Fu and Liou, 1992). Pre-calculated look-up tables are used to simulate the impact of clouds and the impact of var-ious atmospheric gases and aerosols in the distribution of the radiation along the atmosphere. For both Harrington and RRTM radiation options, the aerosol optical depth of
prog-nostic dust has been added to the calculation of the total op-tical depth to account for its direct radiative forcing and pho-tochemical impacts.
2.2 Cloud droplet nucleation parameterization
876 S. Solomos et al.: An integrated modeling study on the effects of mineral dust and sea salt particles et al., 2007; Zhang et al., 2007 among others). The model is
able to explicitly resolve a complete set of atmospheric pro-cesses at resolutions ranging from tens of kilometers down to a few meters. The nesting capabilities of the model allow for sufficient representation of microphysical processes at cloud scales. The microphysics scheme of RAMS includes seven condensate species (cloud droplets, rain droplets, pristine ice, snow, aggregates, graupel and hail) and vapor. The two-moment microphysics parameterization scheme treats both the mixing ratio and number concentration of each hydrom-eteor (Meyers et al., 1997). Prediction of cloud droplet num-ber concentration is originally based on air temperature, ver-tical wind component and on a constant amount of available CCN. A lookup table has been constructed offline from a de-tailed bin-parcel model and the number of activated CCN is calculated from this table. The size and chemical proper-ties of the CCN are not taken into consideration. This ap-proach has been altered in the new version of the model by adding an explicit cloud droplet nucleation parameterization scheme (Nenes and Seinfeld, 2003; Fountoukis and Nenes, 2005). This scheme (referred to as FNS), provides a com-prehensive microphysical link between aerosols and clouds. FNS computes droplet number based on the parcel frame-work, and solves for the maximum supersaturation,smax, that
develops given a set of cloud-scale dynamics (temperature, pressure and vertical wind component) and aerosol proper-ties (number concentration, size distribution and chemical composition). The droplet number is then equal to the num-ber of CCN with critical supersaturation less or equal tosmax
(Nenes and Seinfeld, 2003). The water vapour uptake coef-ficient, used in calculating the mass transfer coefficient of water vapour to growing droplets (Fountoukis and Nenes, 2005), is set to 0.06 based on in-situ cloud droplet closure ex-periments (Meskhidze et al., 2005; Fountoukis et al., 2007).
Soil dust, sea salt spray and secondary pollutants con-tribute to the CCN population. Dust particles are assumed to follow a lognormal size distribution at source regions. The properties of these distributions (number mean diameter and geometric dispersion) are expected to change through-out their atmospheric lifetime. These properties are explic-itly calculated at every model step based on the predicted dust concentration (Schulz et al., 1998). CCN concentrations are expressed as a function of supersaturation using K¨ohler theory (K¨ohler, 1936; Nenes and Seinfeld, 2003). Freshly-emitted mineral dust particles have long been known to act as effective ice nuclei (Pruppacher and Klett, 1997; DeMott et al., 2003; Levin et al., 2005). Ice production is generally fa-cilitated over regions with high mineral dust concentrations, such as over the Atlantic Ocean during African dust trans-portation episodes (Astitha et al., 2010). In ICLAMS, the insoluble fraction of dust contributes to the prognostic ice-forming nuclei (IFN) following the formulation of Meyers et al. (1992).
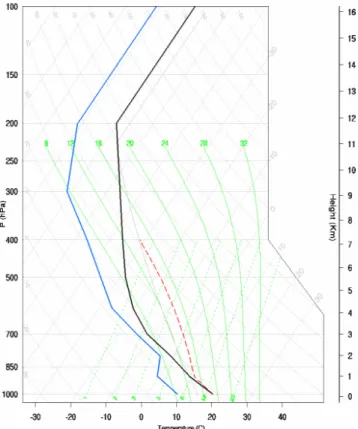
Fig. 1.Initial conditions for the thermodynamic profile of the atmosphere.
3 Clouds and precipitation in an environment with natural particles
3.1 Idealized simulations
In order to examine the sensitivity of the new cloud nucle-ation scheme to aerosol properties, we performed a set of “idealized” simulations for a convective cloud system over flat terrain. The model was configured on a two-dimensional domain with horizontal uniform resolution of 300 m and 35 vertical levels, starting from 50 m spacing near the ground and extending up to 18 km with a geometric stretching ra-tio of 1.2. The horizontal dimension of the domain was 24 km. The model was initialized from a convectively un-stable sounding (Fig. 1) that is considered as representative of winter convective clouds for the Eastern Mediterranean region (Yin et al., 2002; Levin et al., 2005). Initial wind con-ditions of 3 m s−1wind speed and a westerly wind direction were applied homogeneously over the domain. The FNS pa-rameterization was invoked in every time step and grid point and the number of activated droplets was calculated from grid-cell aerosol,P,T, and updraft velocity. All tests were performed with exactly the same configuration except for the aerosol properties. Each run started at 12:00 UTC and lasted for six hours.
Table 2.Hourly accumulated precipitation over all the domain and maximum values for the number concentration and mixing ratio of cloud, rain and pristine-ice condensates, for two air mass type scenarios.
Time after Aerosol Total accumulated Cloud No Cloud Rain No Rain mixing Pristine-ice Pristine-ice
model start scenario precipitation concentration mixing ratio concentration ratio No concentration mixing ratio
(h) (mm) [cm−3] [g kg−1] [L−1] [g kg−1] [L−1] [g kg−1]
2 PRISTINE 84 130 0.76 27.65 0.47 207 0.13
HAZY 26 2133 0.48 2.20 0.37 444 0.19
3 PRISTINE 74 99 0.08 3.19 0.22 89 0.05
HAZY 101 1363 0.39 2.47 0.33 115 0.05
4 PRISTINE 98 22 0.05 1.28 0.14 88 0.05
HAZY 67 592 0.13 2.98 0.09 97 0.06
5 PRISTINE 23 111 0.08 1.85 0.12 81 0.05
HAZY 20 377 0.44 2.24 0.09 94 0.05
6 PRISTINE 7 97 0.31 2.97 0.08 109 0.06
HAZY 3 231 0.12 2.04 0.03 74 0.04
Fig. 2.Distribution of the available aerosol particles.
3.1.1 Cloud processes for a pristine and a hazy environment
Two scenarios were considered for the initial distribution of aerosol concentration, namely the “pristine” and the “hazy” scenario as illustrated in Fig. 2. The “pristine” scenario is representative of a remote area with a relatively clean at-mosphere of total particle concentration 100 cm−3, while the
“hazy” scenario assumes a total concentration of 1500 cm−3
similar to Teller and Levin (2006). Such high aerosol concen-trations can be found near urban areas or industrial zones and are also typical during intense dust episodes. The size distri-bution of the particles was considered to follow a bimodal lognormal distribution that does not change shape between scenarios. The geometric standard deviation equals two for both modes, while the number median diameter was set at 0.2 µm for the first mode and at 2 µm for the second mode.
The chemical composition for the soluble fraction of the par-ticles was assumed to be ammonium sulfate and the aerosol field was applied homogeneously throughout the model do-main. Further development of the cloud system and the fi-nal amount of precipitation depend on the cloud microphys-ical structure and on the interplay with ambient dynamics. Both runs started developing a similar cloud structure after 80 min of simulation time and, as seen in Fig. 3, two distinc-tive convecdistinc-tive areas were identified within a horizontal dis-tance of about 15 km. However, after the initial development, the cloud properties varied significantly between the “pris-tine” and “hazy” scenarios. These changes are reflected in the hourly accumulated precipitation over the entire domain and in the maximum values of mixing ratios and number con-centrations for cloud droplets, rain droplets and pristine ice particles that are summarized in Table 2 for each model run. In the “pristine” simulation, the cloud droplets num-ber concentration remained low (maximum of 130 cm−3) throughout the simulation. Fewer CCN had to compete for the same amount of water. So, large cloud and rain droplets were allowed to develop and the collection effi-ciency was enhanced. This allowed for increased autocon-version rates of cloud to rain droplets and early initiation of warm rain process. Intense precipitation started 100 min into the simulation, with precipitation rates reaching as high as 15 mm h−1 (Fig. 4). The high rain mixing ratio peak
value (0.47 g kg−1)and corresponding rain drop number
con-centration of 27.65 l−1indicate the dominance of
collision-coalescence during the early stages of the cloud.
878 S. Solomos et al.: An integrated modeling study on the effects of mineral dust and sea salt particles
PRISTINE HAZY
0.1 0.3 0.5 0.7 0.9 1.1 1.3 1.5 1.7 1.9 2.1 2.3 2.5 2.7 2.9 3.1 (g kg -1)
After 80 min run After 80 min run
After 100 min run After 100 min run
After 170 min run After 170 min run
Fig. 3.Total condensates mixing ratio (g kg−1)for the “pristine” (left column) and the “hazy” (right column) scenarios.
and precipitation was inhibited. Maximum precipitation rate at this stage was only 4 mm h−1which is about 4 times less
than the “pristine” scenario. However, the ice particles were almost double that of the “pristine” cloud and rain droplets coming from the melting of ice condensates produced a sig-nificant amount of rain between 150 and 210 min model time as seen also in Fig. 4a. The accumulated precipitation over the entire domain was 286 mm for the “pristine” and 215 mm for the “hazy” case. Most of this difference can be attributed
to the inhibition of precipitation during the early stages of cloud development as illustrated in Fig. 4a. Cloud structure was also very different between the two simulations. This is clearly shown in Fig. 3. Two separate cloud systems were still distinct after 170 min of simulation for the “pristine” case while during the “hazy” case the two clouds had merged to one cell and an anvil was formed at the upper cloud layers. Both systems continued precipitating with lower rates until the end of the simulation.
3.1.2 Effects of GCCN on clouds and precipitation
The impact of giant cloud condensation nuclei (GCCN) is also important for cloud processes and precipitation (Teller and Levin, 2006; van den Heever et al., 2006). When aerosol sizes are comparable to cloud droplet size – which is often the case for dust and sea-salt, kinetic limitations are imposed on cloud nucleation processes (Barahona et al., 2010). Ne-glecting such effects may result in significant overestimation of activated cloud droplet number and in reduction of pre-cipitation rates. Nucleation of GCCN is parameterized in the model using the approach of Barahona et al. (2010). In order to examine the impact of GCCN on precipitation, we added a third coarser mode to the aerosol distribution. The third mode was assumed to have a median diameter of 10 µm a standard deviation of 2 and a total concentration of 5 cm−3.
Adding GCCN to a hazy environment limited the number of cloud droplets that nucleated and as seen in Fig. 4b the rainfall during the early stages of cloud development was increased. On the other hand, GCCN did not change sig-nificantly the warm stage precipitation for the pristine envi-ronment (Fig. 4c). Precipitation rate was mainly affected by the number of activated cloud droplets. During the “pris-tine” case the clouds contained limited number of droplets which allowed them to grow fast to rain droplets. Adding a few GCCN for this case did not significantly change the cloud droplet spectrum in the model and so rainfall was not affected.
3.1.3 Effects of topography on the distribution of precipitation
The simplistic approach to the interactions between airborne particles and clouds that is described in the previous sec-tions is not always representative of real atmospheric con-ditions. For example, by adding topographic effects in a 3-D model configuration that is equivalent to the 2-D “pristine” and “hazy” model simulations resulted in substantially dif-ferent spatial distribution of precipitation as shown in Fig. 5. During these simulations, all model parameters remained unchanged except the surface features (topography in this case). The same initial conditions as in previous runs were used (Fig. 1) and a westerly flow with initial wind speed of 3 ms−1was considered for all runs. The impact of topogra-phy on precipitation was investigated for three cases, namely “flat terrain”, “idealized hill” and “complex hilly area”. The first case (flat terrain) considers no topographic features and uniform landscape (soil and vegetation classes). In this case, atmospheric stability and cloud microphysics are the govern-ing factors for the evolution of the cloud system. As seen in Fig. 5 a, b, most of the precipitation was distributed over the western side of the domain for both “pristine” and “hazy” clouds but with different maxima (“pristine” case gave more precipitation). For the second run (“the idealized hill”) the landscape remains the same as in the previous case but a
b
a
c
Fig. 4.Maximum precipitation rate (mm h−1)for:(a)the “pristine” and “hazy” aerosol scenarios. (b)the “hazy” and “hazy + GCCN” aerosol scenarios.(c)the “pristine” and “pristine + GCCN” aerosol scenarios.
880 S. Solomos et al.: An integrated modeling study on the effects of mineral dust and sea salt particles
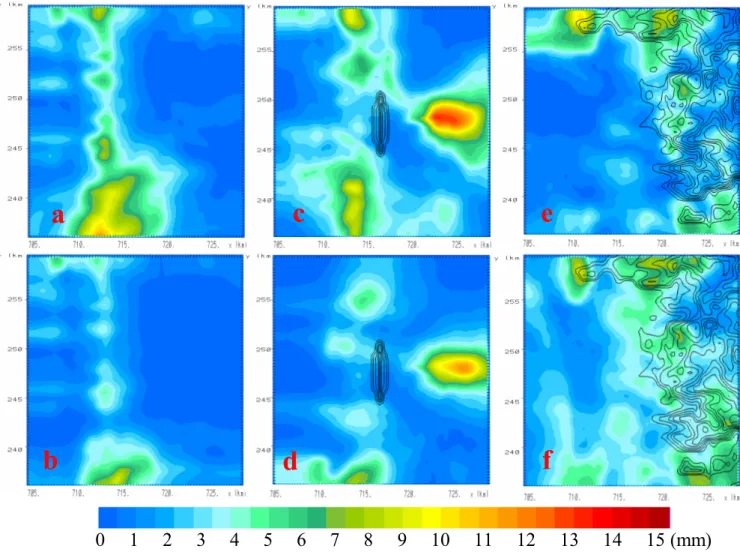
0 1 2 3 4 5 6 7 8 9 10 11 12 13 14 15 (mm)
a
c
e
b
d
f
Fig. 5.Four hour accumulated precipitation (colour palette in mm) and 50 m topographic line contours. 1st row(a, c, e): “pristine” aerosol. 2nd row(b, d, f): “hazy” aerosol. 1st column: No topography (flat terrain). 2nd column: artificial obstacle vertical to the general flow. 3rd column: complex topography. The domain total precipitation for each case is:(a)12.28 m,(b)7.21 m,(c)16.77 m(d)11.01 m,(e)12.97, (f)17.86.
the synergetic effects between the microphysical and macro-physical parameters that contribute in cloud and precipitation processes should be taken into account in relevant modeling studies on a combined way. Otherwise, the results may be misleading when compared to real atmospheric conditions. For example, the “pristine” cases produced more accumu-lated precipitation than the “hazy” ones for the “flat terrain” and “idealized hill” cases. On the other hand, the accumu-lated precipitation over the “complex terrain” was increased during the “hazy” run. The distribution of precipitation was found to be much more sensitive to terrain variability than to any of the variations in aerosol properties.
3.2 Case study
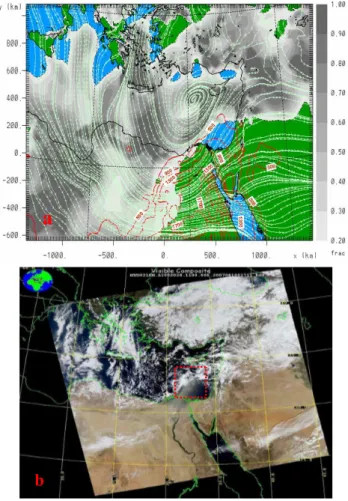
We focus on a case study that combines a low pressure system and a dust storm over the eastern Mediterranean. On 28 January 2003, the centre of the low moved from Crete through Cyprus accompanied by a cold front. Also, prevailing south-westerly winds over North-eastern Africa transported dust particles towards the coast of Israel and Lebanon. As illustrated in Fig. 6, deep convective clouds were developed along the frontal line. These clouds moved north-eastward and on 29 January 2003, heavy rain and hail amounts were reported over the East Mediterranean coast-line and a few kilometres inland. Flood events and agricul-tural disasters were also recorded. A detailed analysis and airborne measurements of this episode were obtained dur-ing the Mediterranean Israeli Dust Experiment (MEIDEX) as described in Levin et al. (2005). Several runs have been
a
b
Fig. 6. (a) Cloud cover percentage (greyscale), streamlines at first model layer (green contours), dust – load (red contours in mg m−2) and (b) MODIS-Aqua visible channel, on 28 Jan-uary 2003 11:00 UTC. Dust transportation is obvious over the Southeastern part of Mediterranean. The red dashed rectangular indicates the location of convective clouds due to frontal uplift.
performed for this case. Special attention was given to the amount of available airborne particles that could act as CCN and GCCN for each particular case, examining both the fects on the precipitation reaching the ground and also the ef-fects on the microphysical structure inside the clouds. Mod-elling results are compared to ground and aircraft observa-tions and some of the findings are discussed here.
3.2.1 Model configuration
The model was configured with three nested grids (15 km, 3 km and 750 m) as seen in Fig. 7 and with 32 vertical lev-els starting from 5 0m above ground and stretching up to 18 km with a geometric ratio of 1.2. For the initial and boundary conditions, a high resolution reanalysis dataset was used. This dataset has been prepared with the Local Analysis and Prediction System (LAPS) (Albers, 1995; Albers et al., 1996). LAPS uses an effective analysis scheme to harmonize
data of different temporal and spatial resolutions on a regu-lar grid. The prepared dataset includes 24 years of reanalysis (1986–2009) with a grid resolution of 15×15 km and tempo-ral intervals of 3 h. It is based on the ECMWF operational analysis dataset (with resolution of 0.5×0.5◦as initial guess
fields and the utilization of all available surface and upper air measurements. The sea surface temperature (SST) used is the NCEP 0.5◦×0.5◦analysis. The model was run for a two days period (26–27 January 2003) prior to the actual event to allow the establishment of an aerosol background. The test case run started at 28 January 00:00 UTC and lasted for 48 h. During these simulations only dust and sea salt particles were included as aerosols in the model. The main dust sources were located in North East Libya and North West Egypt as illustrated in Fig. 7. Sea salt particles were assumed to be completely soluble and contributed to the CCN population. The chemical properties of dust particles are in general as-sociated with the chemical transformations that occur during their atmospheric lifetime. Aged dust clouds include par-ticles that are coated with sea-salt or sulfates (Levin et al., 1996; Bougiatioti et al., 2009). Dust and sea salt particles are treated separately for transportation and deposition pro-cesses and there is no explicit interaction between them in the model. However, salt-coated dust particles are also efficient CCN. This behavior is implicitly parameterized in the model by assuming fixed percentages of soluble dust particles for each particular case. These values are used to describe the partitioning between hygroscopic and non-hygroscopic dust particles and represent average conditions for the area.
3.2.2 Aerosol properties and comparison with aircraft measurements
Consistent with Levin et al. (2005), the aerosol particles within the lowest two kilometers of the atmosphere were a mixture of dust and sea-salt. The south-to-north and west-to-east vertical cross sections of Fig. 8 indicate that the dust particles did not elevate higher than two kilometers in the at-mosphere and coexisted with sea salt spray particles along their transportation path. The increased aerosol concentra-tion near the cloud base affected the formaconcentra-tion of clouds in this area.
882 S. Solomos et al.: An integrated modeling study on the effects of mineral dust and sea salt particles
W
E
N
S
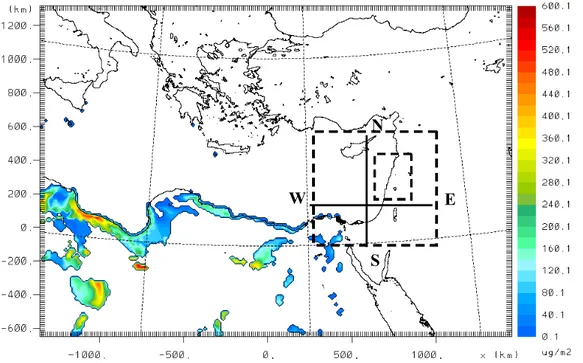
Fig. 7. Dust flux in µg m−2on 27 January 2003 09:00 UTC. Dashed rectangles indicate the location of the nested domains. Solid lines indicate the locations of the cross sections of Fig. 8.
.
μg m-3
z (km)
3
2
1
0
S - N
a
W - E
b
Fig. 8. (a) Vertical cross sections of dust concentration (black line contours in µg m−3) and (b) sea salt concentration (color palette in µg m−3).
in diameter flayer are in satisfactory. Measurements were performed in an irregular manner along the aircraft path and each sampling period lasted for five minutes. For the current work, the average concentration of natural particles for each measurement point is compared towards the corresponding model results. In order to co-locate the aircraft
measure-ments with the appropriate model grid point we considered the mean geographic location of the aircraft for each sam-pling period. The simulated dust and salt concentrations for the corresponding location in the model is then calculated as the weighted average from the eight nearest model grid points. The concentrations of modelled particles inside the
Fig. 9. Comparison of aircraft measurements of natural particles with modeled dust and salt concentrations inside the dust layer (be-low 2 km). The red line indicates the linear regression line while the dotted line indicates they=xline.
dust layer are in satisfactory agreement with airborne mea-surements as illustrated in Fig. 9, with a correlation coeffi-cientR=0.89. These results indicate that the model is able to quantitatively reproduce the horizontal and vertical struc-ture of the dust storm. The ability of the model to capstruc-ture these features is important for the next steps of the exper-iment, since the estimated particles contribute to the cloud droplet nucleation mechanism. As seen in Fig. 10, the dust storm is approaching the coast of East Mediterranean from south-west during the morning of 28 January 2008. The clouds that were formed in this area were affected by the dust storm and also by the increased sea salt production due to the relatively strong winds and wind shear. The coexistence of salt and dust particles at heights below cloud base provided significant amounts of highly hygroscopic mixed particles. These clouds contained increased numbers of cloud droplets and moved north-northeast towards the Israel and Lebanon coast. Most of the precipitation from these clouds fell after they reached land and the peak rain rates were reported on the morning of 29 January 2003 around Haifa and North Israel.
Three different scenarios related to the properties of the aerosol particles during the model runs are discussed here. All model parameters were held constant except the percent-age of dust particles containing soluble material, thus becom-ing effective CCN. In experiment 1 (EXP1), 5% of dust par-ticles were hygroscopic while for experiment 2 (EXP2), this percentage was increased to 20%. DeMott et al. (2003a), found that during intense dust episodes, the concentration of ice nuclei (IN) was increased by 20–100 times compared to non-dust environment. Following this approach, EXP3 in-corporated 5% hygroscopic dust while the concentration of
CYPRUS
MEDITERRANEAN SEA
LEBANON
ISRAEL
Fig. 10. Modeled dust number concentration (cm−3) at 538 m height on 28 January 2003, 09:20 UTC. Dots indicate the locations of the aircraft measurements.
IN in the model was multiplied by a factor of ten in the pres-ence of mineral dust. The hygroscopic dust particles were assumed to contain 33% sodium chloride. The aerosol spec-trum was fitted in a 3-modal lognormal distribution. The first mode corresponds to particles of mineral dust origin while the other two correspond to sea-salt accumulation and coarse modes, respectively. The median diameter and standard de-viation for the accumulated salt mode is 0.36 µm and 1.8, respectively. For the coarse salt mode the median diameter is 2.85 µm and the standard deviation is 1.9. However, dust particles may range from small submicron diameters (away from the sources and at high atmospheric levels) up to GCCN sizes (near sources and at low atmospheric levels). In order to represent this kind of inhomogeneous spatial distribution, the median diameter and standard deviation for the dust mode are estimated from the relative prognostic concentrations of the eight dust bins according to Schulz et al. (1998).
884 S. Solomos et al.: An integrated modeling study on the effects of mineral dust and sea salt particles
a b c
Fig. 11.West to East cross-section of rain mixing ratio (color palette in g kg−1)and ice mixing ratio (red line contours in g kg−1)at the time of highest cloud top over Haifa. (a)09:00 UTC 29 January 2003 assuming 5% hygroscopic dust (EXP1). (b)10:00 UTC 29 January 2003 assuming 20% hygroscopic dust (EXP2).(c)09:00 UTC 29 January 2003 assuming 5% hygroscopic dust and IN×10 (EXP3).
Table 3.Model characteristics for nine aerosol scenarios.
Aerosol Cases Aerosol-cloud Aerosol-radiation
interaction interaction
Case1 (control run) NO NO
Case2 (only radiation interaction) NO YES
Case3 (constant aerosol – “pristine”) YES NO
Case4 (constant aerosol – “hazy”) YES NO
Case5 (prognostic aerosol – 1% hygroscopic dust) YES YES
Case6 (prognostic aerosol – 5% hygroscopic dust) YES YES
Case7 (prognostic aerosol – 10% hygroscopic dust) YES YES
Case8 (prognostic aerosol – 30% hygroscopic dust) YES YES
Case9 (prognostic aerosol – 5% hygroscopic dust + IN×10) YES YES
case, there was significant convective activity over Haifa at 08:20 UTC on 29 January and the convective available poten-tial energy (CAPE) was 1027 J. When CAPE is large enough, significant amounts of liquid condensates may thrust into the upper levels of a cloud (Fig. 12b) and eventually freeze at higher altitudes. The released latent heat invigorates convec-tion at higher levels, resulting in increase of the equivalent potential temperature (see Fig. 12c with an arrow pointing to the area of increased equivalent potential temperature). After 10 min, strong updrafts reached up to 8 km height and trans-ferred condensates to the upper cloud layers as illustrated in Fig. 12d. These condensates interact with the available IN in this region of the cloud, forming ice particles through het-erogeneous nucleation. Thus, increasing the percentage of hygroscopic mineral dust or increasing the IN by an order of magnitude resulted in enhancement of ice particles formation
and the release of latent heat at higher levels. These interac-tions between aerosols and cloud dynamics produce clouds with stronger updrafts that reach higher tops and finally pro-duce heavier rainfall.
3.2.3 Effects of natural particles on precipitation
In order to examine the sensitivity of accumulated precip-itation to aerosol properties, we performed a total of nine scenarios with the same model configuration but chang-ing the chemical composition of airborne particles. The physio-chemical characteristics used on each run are shown in Table 3. The first run was performed with the original RAMS model and we call it “control run”. For Case2, only particles-radiation interaction was enabled. For cases three and four, the FNS cloud nucleation parameterization was
a
CAPE =1027 J
b
d
c
Fig. 12. (a)Modelled thermodynamic profile of the atmosphere over Haifa at 08:20 UTC, 29 January 2003 and W-E cross sections over Haifa for:(b)Liquid water mixing ratio (colour palette in g kg−1) and ambient temperature (red contours in C◦) at 08:20 UTC.(c)Equivalent potential temperature (colour palette in K) at 08:20 UTC. The arrow points at the area of increasedθe.(d)Equivalent potential temperature (colour palette in K) and updrafts (black contours in m s−1) at 08:30 UTC. The plots refer to EXP2.
enabled using the prescribed “pristine” and “hazy” air mass types as in Sect. 3.1. For the next four runs, particle concen-tration was a prognostic variable and the cloud nucleation scheme was used in an explicit way. The percentage of
886 S. Solomos et al.: An integrated modeling study on the effects of mineral dust and sea salt particles
0 0.2 0.4 0.6 0.8 1 1.2 1.4 1.6
0 4 8 12 16 20 24 28 32 36 40 44 48 52 56
Precipitation Tresholds (mm)
Bi
as
Case 1 (0.83) Case 2 (0.82) Case 3 (0.81) Case 4 (0.76) Case 5 (0.84) Case 6 (0.84) Case 7 (0.96) Case 8 (0.71) Case 9 (0.94)
Fig. 13. Bias of the 24 h accumulated precipitation for 86 stations and for nine scenarios of aerosol composition. The average bias for each scenario is specified in parenthesis after the legend labels. The number of available stations for each threshold is also denoted in parenthesis after the precipitation heights: 0.5 (86), 2 (86), 4 (86), 6 (86), 10 (84), 16 (81), 24 (57), 36 (34), 54 (14).
Levin et al. (2006). The modelled 24-hour accumulated pre-cipitation on 29 January 2003 for all nine cases was tested against ground measurements from 86 measuring stations over North Israel.
The model bias score (see Appendix B) was calculated for nine thresholds of accumulated precipitation, namely 0.5 mm, 2 mm, 4 mm, 6 mm, 10 mm, 16 mm, 24 mm, 36 mm and 54 mm. The results for each case and each precipitation threshold are shown in Fig. 13. Biases equal to one mean that the particular precipitation threshold was simulated as often as observed. Bias below unity indicates model under-prediction and bias over one indicates over-under-prediction. The limited time period of the study and the relevant small num-ber of measuring stations (especially at high thresholds) does not allow extracting robust statistical results. However, as seen in Fig. 13, the accumulated precipitation was found to be very sensitive to variations of the percentage of dust par-ticles that can be activated as CCN and IN. These results in-dicate the need for a proper treatment of the links and feed-backs between cloud and aerosol processes. Model results with prognostic aerosol treatment were in general closer to the observations than those considering constant prescribed aerosol properties and the model bias for these cases was im-proved especially at medium and high precipitation heights. For example, at the 16 mm threshold, the bias ranged from 0.61 (Case 3) to 0.87 (Case 5). Similarly, for the 24 mm threshold the bias score ranged from 0.63 (Case 4) to 0.88 (Case 5) and for the 36 mm the bias was 0.1 for Case 8, 0.47 for the control run (Case 1) and 0.79 for Cases 7 and 9. The average bias for all thresholds was calculated for each one of the nine cases (see Appendix B for definition) and is also shown in Fig. 13. The variability in model bias was up to 80% for some thresholds which is indicative of the role of aerosol in atmospheric processes. During the eighth case, the
accumulated precipitation field was clearly underestimated due to the increased concentration of hygroscopic particles for this case. Increasing the number of CCN delayed the ini-tiation of precipitation and resulted in the enhancement of ice concentrations. These ice crystals did not grow much be-cause of the lack of water drops at higher levels (in agreement with the results of Teller and Levin, 2006). Most of these clouds evaporated before they managed to precipitate and the accumulated precipitation was underestimated. These find-ings imply that a more detailed representation of the atmo-spheric composition and of the aerosol-cloud-radiation feed-backs can provide some insight into the processes involved in the formation of clouds and precipitation and also improve the model performance.
4 Concluding remarks
Several sensitivity tests were performed with an integrated atmospheric model that includes online parameterization of aerosol processes, aerosol-radiation interaction, explicit cloud droplet activation scheme and a complete microphysics package. Two- dimensional tests for an idealized case of cloud development indicated a significant response of cloud processes and precipitation to the variations of aerosol num-ber concentration and also to the size distribution of the particles. “Hazy” aerosol conditions delayed precipitation while the clouds that were formed in a “pristine” environ-ment precipitated faster and produced more rain, in agree-ment with earlier publications. However, in order to simulate the aerosol effects in an approach that is closer to realistic at-mospheric conditions, it is also necessary to take into account the synergetic effects between the various microphysical and macrophysical processes. For example, the distribution of accumulated precipitation was found to be much more sen-sitive to topographic variations than to aerosol number con-centration and/or composition.
Model simulations for a specific event of dust transport and convective activity over Eastern Mediterranean, illus-trated that this kind of regional modeling approach can be very useful in reproducing many of the important features of aerosol and cloud processes. These findings can be summa-rized as follows:
1. The meteorological conditions during this particular event and the aerosol field properties were reproduced in the model in satisfactory agreement with observa-tions. This is also indicated by the correlation factor of 0.89 between modelled aerosol concentrations and airborne measurements.
2. An increase of 15% in the concentration of soluble dust particles produced clouds that extended about three kilometres higher and the initiation of precipitation was delayed by almost one hour.
3. Variations between 1–30% in the amount of dust parti-cles that were assumed to contain soluble material re-sulted in significant changes in cloud properties. The associated variations in the precipitation bias score were up to 80% for some thresholds.
4. In general, online treatment of dust and salt particles as prognostic CCN, GCCN and IN improved the bias score for the 24 h accumulated precipitation in comparison to the runs considering a uniform atmospheric composi-tion all over the domain.
These results illustrate the highly non-linear response of precipitation to aerosol properties and indicate that a large portion of uncertainty remains unresolved. This study fo-cuses mostly on investigating the mechanisms that are asso-ciated with the aerosol cloud interactions for a specific event. Therefore it is not possible to extract generic results. Never-theless, this work represents one of the first limited area mod-elling studies for aerosol-cloud-radiation effects at the area of Eastern Mediterranean and could be used as a basis for future improvements and longer term studies. More intense combined modeling and observational surveys on the inter-actions between airborne particles and cloud processes at re-gional and local scale are necessary in order to improve our knowledge on the interactions between atmospheric chem-istry and meteorology.
Appendix A Mineral Dust
The dust-cycle simulation adopts the approach of the SK-IRON/Dust model (Spyrou et al., 2010) and is based on the “saltation and bombardment” mechanism (Marticorena and Bergametti, 1995; Lu and Shao, 1999; Alfaro and Gomez, 2001; Grini et al., 2002). Based on this approach, the verti-cal dust flux is distributed into three lognormal source modes with different shapes and mass fractions (D’Almeida, 1987; Zender et al., 2003). The transport mode is represented in-side the model with eight discrete size bins as in P´erez et al. (2006) and Spyrou et al. (2010) with effective radii of 0.15, 0.25, 0.45, 0.78, 1.3, 2.2, 3.8, and 7.1 µm respectively. Each dust bin is treated as a scalar variable for advection and diffusion purposes. Partitioning of the dust spectrum and separate treatment of each size mode is important for the de-scription of size dependent processes such as dry and wet deposition, CCN activation and radiative transfer.
A1 Sea salt spray
The most prominent mechanism for the generation of sea salt aerosols is the bursting of entrained air bubbles during white-cap formation due to surface wind. The method follows the open sea white-cap formation as described in Monahan et
al. (1986) which gives a continuous particle-size distribution at a specific relative humidity (RH), usually 80%.
dFN−Open
dr80
=1.373·u310.41·r80−A·
1+0.057r803.45
·101.607e−B
2
(A1) A=4.7·(1+2r80)−0.017r
−1.44
80 ,2=30 (A2)
B=(0.433−logr80)0.433 (A3)
whereu10is the wind speed at 10 m height, andr80is the
par-ticle radius at 80% RH as described in Zhang et al. (2005). This semi-empirical formulation is based on laboratory mea-surements for particles with radius 0.8–8 µm. The size range of the sea salt source function has been extended to below 0.1 µm in radius based on the parameterization proposed by Gong (2003). Additionally, in order to take into account the hygroscopic nature of sea salt, the size distribution of the par-ticles is calculated as a function of local RH following Zhang et al. (2005). This method accounts for the hygroscopic up-take of water from sea salt particles for RH values between 45% and 99%. Coastline sea salt flux is also parameterized in the model following the work of Leeuw et al. (2000) and Gong et al. (2002).
Sea salt particle spectrum is represented with a bimodal lognormal distribution assuming a mean diameter of 0.36 µm for the first (accumulated) mode and a mean diameter of 2.85 µm for the second (coarse) mode. Geometric dispersion is 1.80 and 1.90 for the two modes respectively.
A2 Dry deposition
Dry deposition for dust and salt particles is treated as a first order removal process, equal to the concentration multiplied by a mass transfer coefficient,Vd(termed “deposition
veloc-ity”; Seinfeld and Pandis, 1998; Slinn and Slinn, 1980). Vd
accounts for the effects of reactivity, hygroscopic water up-take, size distribution of particles, meteorological conditions and surface characteristics. Wesely (1989) proposed a resis-tance model to account for all the elements described above; dry deposition fluxes are controlled by gravitational settling, turbulent mixing, and Brownian diffusion across two virtual layers. In the layer adjacent to the surface, Brownian diffu-sion (for small particles) and gravitational settling (for large particles) are the main deposition processes. In the second layer, called the “constant flux layer”, turbulent mixing and gravitational settling dominate deposition. Vd of a particle
with a given diameter is then parameterized using a set of mass transfer resistances associated with the combined ef-fects of these processes in both layers (Wesely, 1989; Sein-feld and Pandis, 1998):
ra=
1 ku∗
ln
1 z0
−φh
888 S. Solomos et al.: An integrated modeling study on the effects of mineral dust and sea salt particles
rb=
1 u∗
Sc−2/3+10−3/St
(A5)
Vd=Vsed+
1 ra+rb+rarbVsed
(A6)
wherera is the aerodynamic resistance, rb is the boundary
resistance,k is the von Karman constant, zo is the surface
roughness length, φh a stability correction term, Sc is the
Schmidt number, St is the Stokes number and Vsed is the
gravitational settling velocity.
A3 Wet deposition
Proper treatment of the wet removal process is essential for a realistic aerosol simulation, since it is the predominant removal process for atmospheric particles away from their sources. The amount of particles removed at each model time step from in-cloud and below-cloud scavenging is expressed as:
∂C
∂t = −3C (A7)
where3is the “scavenging coefficient” of the aerosols. For in-cloud removal, 3 is calculated from the droplet-aerosol collection efficiency (E), the precipitation rate (P )and the radius of the scavenging droplet (rd)following the
formula-tion of Seinfeld and Pandis (1998):
3=3
4 EP
rd
(A8) The collection efficiency(E)for a particle of radius (rp)is
calculated from the contribution of Brownian diffusion, tur-bulent diffusion, interception, inertial impaction and electric forces (Slinn, 1984; Seinfeld and Pandis, 1998):
E(rp)=
4 ReSc
1+0.4Re1/2Sc1/3+0.16Re1/2Sc1/2
+4φ
µ
µw
+φ1+Re1/2
+
S
t−S∗
St−S∗+2/3
3/2 (A9) whereReis the droplet Reynolds number,Sc is the particle
Schmidt number,rdis the droplet radius,φ=rrp
d,µ,µware the kinematic viscosities of the air and liquid water, respec-tively,Stis the particle Stokes number and
S∗=1.2+ln(1+Re)/12
1+ln(1+Re) (A10)
Appendix B
For each model scenario (Cases 1–9) and for each precipita-tion threshold a contingency table is constructed as follows (Wilks, 2006):
21
APPENDIX B
616
For each model scenario (Cases 1-9) and for each precipitation threshold a contingency
617
table is constructed as follows (Wilks 2006):
618
619
620
621
622
623
624
625
The
a
model-observation pairs mean that both model and observation are over the specific
626
threshold and are usually called hits. Similarly,
b
pairs mean that the model is over the
627
threshold but observation is below it and are called false alarms;
c
pairs mean that the
628
observation is over the threshold but the model is below it and are called misses and
d
629
pairs mean that both model and observation are below the threshold for a station and are
630
called correct rejections.
631
632
The total number of hits (
a
), false alarms (
b
) and misses (
c
) for each threshold are then
633
used to calculate the MODEL BIAS (B):
634
c
a
b
a
B
635
636
Unbiased forecasts exhibit bias=1, while bias greater than one indicates overprediction
637
and bias less than one indicates underprediction.
638
639
The AVERAGE BIAS (
B
) for all precipitation thresholds is calculated as:
640
1
1B
(
i
)
N
B
iiN,
641
Where
B(i)
is the bias for each specific threshold and N is is the total number of
642
precipitation thresholds.
643
Observed
Yes
No
Yes
a
b
M
ode
le
d
No
c
d
Thea model-observation pairs mean that both model and observation are over the specific threshold and are usually called hits. Similarly, b pairs mean that the model is over the threshold but observation is below it and are called false alarms;cpairs mean that the observation is over the thresh-old but the model is below it and are called misses and d pairs mean that both model and observation are below the threshold for a station and are called correct rejections.
The total number of hits (a), false alarms (b)and misses (c)for each threshold are then used to calculate the MODEL BIAS(B):
B=a+b
a+c
Unbiased forecasts exhibit bias = 1, while bias greater than one indicates overprediction and bias less than one indicates underprediction.
The AVERAGE BIAS (B)¯ for all precipitation thresholds is calculated as:
¯
B= 1
N Xi=N
i=1B(i),
WhereB(i)is the bias for each specific threshold andNis is the total number of precipitation thresholds.
Acknowledgements. This work has been supported by the Eu-ropean Union 6th Framework Program CIRCE IP, contract# 036961 and EUROCONTROL Research Studentship Agreement no CO6/22048ST.
Edited by: M. Kanakidou
References
Albers, S. C.: The LAPS wind analysis, Weather Forecast., 10, 342– 352, 1995.
Albers, S., McGinley, J. A., Birkenheuer, D., and Smart, J. R: The Local Analysis and Prediction System (LAPS): Analysis of clouds, precipitation, and temperature, Weather Forecast., 11, 273–287, 1996.
Albrecht, B. A.: Aerosols, cloud microphysics, and fractional cloudiness, Science 245, 1227–1230, 1989.
Alfaro, S. C. and Gomes, L.: Modeling mineral aerosol production by wind erosion: emission intensities and aerosol size distribu-tions in source areas, J. Geophys. Res., 106(D16), 18075–18084, 2001.
Andreae, M. O., Charlson, R. J., Bruynseels, F., Storms, H., van Grieken, R., and Maenhaut, W.: Internal mixtures of sea salt, sil-icates and excess sulfate in marine aerosols, Science, 232, 1620– 1623, 1986.
Andreae, M. O. and Rosenfeld, D.: Aerosol-cloud-precipitation interactions, Part 1, The nature and sources of cloud-active aerosols, Earth Sci. Rev., 89, 13–41, 2008.
Astitha, M. and Kallos, G.: Gas-phase and aerosol chemistry inter-actions in South Europe and the Mediterranean Region, Env. Fl. Mech., 9(1), 3–22, doi:10.1007/s10652-008-91107, 2008. Astitha, M., Kallos, G., Spyrou, C., O’Hirok, W., Lelieveld, J.,
and Denier van der Gon, H. A. C.: Chemically aged and mixed aerosols over the Central Atlantic Ocean – potential impacts, Atmos. Chem. Phys. 10, 5797–5822, 1020 doi:10.5194/acp-10-5797,2010.
Barahona, D., West, R. E. L., Stier, P., Romakkaniemi, S., Kokkola, H., and Nenes, A.: Comprehensively accounting for the effect of giant CCN in cloud activation parameterizations, Atmos. Chem. Phys., 10, 2467–2473, doi:10.5194/acp-10-2467-2010, 2010. Bougiatioti, A., Fountoukis, C., Kalivitis, N., Pandis, S. N., Nenes,
A., and Mihalopoulos, N.: Cloud condensation nuclei measure-ments in the marine boundary layer of the Eastern Mediter-ranean: CCN closure and droplet growth kinetics, Atmos. Chem. Phys., 9, 7053–7066, doi:10.5194/acp-9-7053-2009, 2009. Charlson, R. J., Langner, J., and Rodhe, H.: Sulphate aerosol and
climate, Nature, 348, 94 pp., 1990.
Charlson, R. J., Schwartz, S. E., Hales, J. M., Cess, R. D., Coakley, J. A., Hansen, J. E., and D. J., Hofmann: Climate forcing by anthropogenic aerosols, Science, 255, 423–430, 1992.
Charlson, R. J., Seinfeld, J. H., Nenes, A., Kulmala, M., Laakso-nen, A., and Facchini, M. C.: Reshaping the Theory of Cloud Formation, Science, 292, 2025–2026, 2001.
Chen, C. and Cotton, W. R.: A one-dimensional simulation of the stratocumulus-capped mixed layer, Bound.-Lay Meteor., 25, 289–321, 1983.
Chung, S. H. and Seinfeld, J. H.: Global distribution and climate forcing of carbonaceous aerosols, J. Geophys. Res., 107(D19), 4407, doi:10.1029/2001JD001397, 2002.
Cotton, W. R., Pielke Sr., R. A., Walko, R. L., Liston, G. E., Tremback, C. J., Jiang, H., McAnelly, R. L., Harrington, J. Y., Nicholls, M. E., Carrio, G. G., and Mc Fadden, J. P.: RAMS 2001: Current status and future directions, Meteorol. Atmos. Phys., 82, 5–29, 2003.
Cotton, W. R., Zhang, H., McFarquhar, G. M., and Saleeby, S. M.: Should we consider polluting hurricanes to reduce their inten-sity?, J. Wea. Mod., 39, 70–73, 2007.
D’Almeida, G. A.: On the variability of desert aerosol radiative characteristics, J. Geophys. Res., 92(D3), 3017–3026, 1987 Davies, H. C.: Limitations of some common lateral boundary
schemes used in regional NWP models, Mon. Weater Rev., 111, 1002–1012, 1983.
DeMott, P. J., Sassen, K., Poellet, M. R., Baumgardner, D., Rogers, D. C., Brooks, S. D., Prenni, A. J. and Kreidenweis, S. M.: African dust aerosols as atmospheric ice nuclei, Geophys. Res. Lett., 30, 1732, doi:10.1029/2003GL017410, 2003. Dockery, D. W. and Pope, C. A.: Acute respiratory effects of
partic-ulate air pollution, Annu. Rev. Publ. Health, 15, 107–132, 1994. Fountoukis, C. and Nenes, A.: Continued Development of a Cloud Droplet Formation Parameterization for Global Climate
Mod-els, J. Geophys. Res., 110, D11212, doi:10.1029/2004JD005591, 2005.
Fountoukis, C., Nenes, A., Meskhidze, N., Bahreini,, R., Conant, W. C., Jonsson, H., Murphy, S., Sorooshian, A., Varutbangkul, V., Brechtel, F., Flagan, R. C., and Seinfeld, J. H.: Aerosol – cloud drop concentration closure for clouds sampled during the International Consortium for Atmospheric Research on Trans-port and Transformation 2004 campaign, J. Geophys. Res., 112, D10S30, doi:10.1029/2006JD007272, 2007.
Fu, Q. and Liou, K. N: On the correlated k-distribution method for radiative transfer nonhomogeneous atmosphere, J. Atmos. Sci., 49, 2139–2156, 1992.
Gong, S. L.: A parameterization of sea-salt aerosol source function for sub- and super-micron particles, Global Biogeochem. Cy., 17, 1097, doi:10.1029/2003GB002079, 2003.
Gong, S. L., Barrie, L. A., and Lazare, M.: Canadian Aerosol Mod-ule (CAM): a size-segregated simulation of atmospheric aerosol processes for climate and air quality models. 2. Global sea-salt aerosol and its budgets, J. Geophys. Res., 107(D24), 4779, doi:10.1029/2001JD002004, 2002.
Grini, A., Zender, C. S., and Colarco, P. R.: Saltation sandblasting behavior during mineral dust aerosol production, Geophys. Res. Lett., 29, 1868, doi:10.1029/2002GL015248, 2002.
Harrington, J. Y.: The Effects of Radiative and Microphysical Pro-cesses on Simulated Warm and Transition Season Arctic Stra-tus., Ph.D. Thesis, Colorado State University, Ft. Collins, CO, 298 pp., 1997.
Herut, B., Collier, R., and Krom, M. D.: The role of dust in sup-plying nitrogen and phosphorus to the Southeast Mediterranean, Limnol. Oceanogr., 47, 870–878, 2002.
Hill, G. E.: Factors controlling the size and spacing of cumulus clouds as revealed by numerical experiments, J. Atmos. Sci., 31, 646–673, 1974.
Iacono, M. J., Mlawer, E. J., Clough, S. A., and Morcrette, J. J.: Impact of an improved longwave radiation model, RRTM, on the energy budget and thermodynamic properties of the NCAR Com-munity Climate Model, CCM3, J. Geophys. Res., 105, 14873– 14890, 2000.
IPCC: Changes in atmospheric constituents and radiative forcing: Climate change 2007: the physical science basis, Cambridge University Press, New York, USA, and Cambridge, UK, 2007. Jacobson, M. Z.: Global direct radiative forcing due to
multicompo-nent anthropogenic and natural aerosols, J. Geophys. Res., 106, 1551–1568, 2001.
Junkermann, W., Hacker, J., Lyons, T., and Nair, U.: Land use change suppresses precipitation, Atmos. Chem. Phys., 9, 6531– 6539, doi:10.5194/acp-9-6531-2009, 2009.
Kallos, G., Papadopoulos, A., Katsafados, P., and
Nick-ovic, S.: Trans-Atlantic Saharan dust transport: Model
simulation and results, J. Geophys. Res., 111, D09204, doi:10.1029/2005JD006207, 2006.
Kallos, G., Astitha, M., Katsafados, P., and Spyrou, C.: Long-Range Transport of Anthropogenically and Naturally Produced particulate matter in the Mediterranean and North Atlantic: Cur-rent State of Knowledge, J. Appl. Meteorol. Clim., 46, 1230– 1251, doi:10.1175/JAM2530.1, 2007.
Ex-890 S. Solomos et al.: An integrated modeling study on the effects of mineral dust and sea salt particles
periment, M. S. thesis, Department of Meteorology, The Penn-sylvania State University, 136 pp., 1979.
Karyampudi, V. M., Palm, S. P., Reagen, J. A., Fang, H., Grant, W. B., Hoff, R. M., Moulin, C., Pierce, H. F., Torres, O., Browell, E. V., and Melfi, S. H.: Validation of the Saharan dust plume conceptual model using lidar, Meteosat, and ECMWF data, B. Am. Meteor. Soc., 80, 1045–1075, 1999.
Krichak, S. O. and Levin, Z.: On the cloud microphysical processes during the 2 November 1994, hazardous storm in the southeast-ern Mediterranean as simulated with mesoscale model, Atmos. Res., 53, 63–89, 2000.
Klemp, J. B. and Wilhelmson, R. B.: The simulation of threedi-mensional convective storm dynamics, J. Atmos. Sci., 35, 1070– 1096, 1978.
K¨ohler, H.: The nucleus in and the growth of hygroscopic droplets, Trans. Faraday Soc., 32, 1151–161, 1936.
Lacis, A. A. and Oinas, V.: A description of the correlated k distributed method for modeling nongray gaseous absorption, thermal emission, and multiple scattering in vertically inho-mogeneous atmospheres, J. Geophys. Res., 96, 9027–9063, doi:10.1029/90JD01945, 1991.
Lau, K. M., Kim, M. K., and Kim, K. M.: Aerosol induced anoma-lies in the Asian summer monsoon: The role of the Tibetan Plateau, Clim. Dynam., 26(7–8), 855–864, doi:10.1007/s00382-0 doi:10.1007/s00382-06-doi:10.1007/s00382-0114-z, 2doi:10.1007/s00382-0doi:10.1007/s00382-06.
Lau, K. M. and Kim, K. M.: Observational relationships between aerosol and Asian monsoon rainfall, and circulation, Geophys. Res. Lett., 33, L21810, doi:10.1029/2006GL027546, 2006. Lau, K. M., Kim, K. M., Sud, Y. C., and Walker, G. K.: A GCM
study of the response of the atmospheric water cycle of West Africa and the Atlantic to Saharan dust radiative forcing, Ann. Geophys., 27, 4023–4037, doi:10.51941Angeo-27-4023-2009, 2009.
Leeuw, G., Neele, F. P., Hill, M., Smith, M. H., and Vignali, E.: Pro-duction of sea spray aerosol in the surf zone, J. Geophys. Res.-Atmos., 105, 29397–29409, 2000.
Levin, Z. and Cotton, W. R.: Aerosol Pollution Impact on
Precipitation-A Scientific Review, Springer, 386 pp., ISBN:978-1-4020-8689-2, 2009.
Levin, Z., Ganor, E., and Gladstein, V.: The effects of desert parti-cles coated with sulfate on rain formation in the eastern Mediter-ranean, J. Appl. Meteorol., 35, 1511–1523, 1996.
Levin, Z., Teller, A., Ganor, E., and Yin, Y.: On the interac-tions of mineral dust, sea-salt particles and clouds: A mea-surement and modeling study from the Mediterranean Israeli Dust Experiment campaign, J. Geophys. Res., 110, D20202, doi:10.1029/2005JD005810, 2005.
Lilly, D. K.: On the numerical simulation of buoyant convection, Tellus XIV, 148–172, 1962.
Lohmann, U. and Feichter, J.: Global indirect aerosol effects: a re-view, Atmos. Chem. Phys., 5, 715–737, doi:10.5194/acp-5-715-2005, 2005.
Lu, H. and Shao, Y.: A new dust model for dust emission by salta-tion bombardment, J. Geophys. Res., 104, 16827–16841, 1999. Lynn, B., Khain, A., Dudhia, J., Rosenfeld, D., Pokrovsky, A.,
and Seifert, A.: Spectral (bin) microphysics coupled with a mesoscale model (MM5). Part 2: Simulation of a CaPe rain event with squall line, Mon. Weather Rev., 133, 59–71, 2005b. Mahowald, N., Jickells, T. D., Baker, A. R., Artaxo, P.,
Benitez-Nelson, C. R., Bergametti, G., Bond, T. C., Chen, Y., Cohen, D. D., Herut, B., Kubilay, N., Losno, R., Maenhaut, C. L. W., McGee, K. A., Okin, G. S., Siefert, R. L., and Tsukuda, S.: Global distribution of atmospheric phosphorus sources, concen-trations and deposition rates, and anthropogenic impacts, Global Biogeochem. Cy., 22, GB4026, doi:10.1029/2008GB003240, 2008.
Marticorena, B. and Bergametti, G.: Modeling the atmospheric dust cycle: 1. Design of a soil derived dust emission scheme, J. Geo-phys. Res., 100(D8), 16415–16430, 1995.
Mavromatidis, E. and Kallos, G.: An investigation of cold cloud formation with a 3-D model with explicit microphysics, J. Geo-phys. Res., 108(D14), 4420, doi:2002JD0027111, 2003. Mavromatidis, E., Lekas, T., and Kallos, G.: Analysis of a two-layer
cloud system with RAMS model and comparison to airborne ob-servations, Env. Fluid Mech., 7, 537–568, doi:10.1007/s10652-007-9043-6, 2007.
Mellor, G. L. and Yamada, T.: Development of a turbulence clo-sure model for geophysical fluid problems, Rev. Geophys. Space. Phys., 20, 851–875, 1982.
Meskhidze, N. and Nenes, A.: Phytoplankton and Cloudiness in the Southern Ocean, Science, 314, 1419–1423, 2006.
Meskhidze, N., Chameides, W. L., Nenes, A., and Chen, G.: Iron mobilization in mineral dust: Can anthropogenic SO2 emissions affect ocean productivity?, Geophys. Res. Lett., 30(21), 2085, doi:10.1029/2003GL018035, 2003.
Meskhidze, N., Chameides, W. L., and Nenes, A.: Dust and pol-lution: A recipe for enhanced ocean fertilization?, J. Geophys. Res., 110, D03301, doi:10.1029/2004JD005082, 2005.
Meyers, M. P., DeMott, P. J., and Cotton, W. R.: New primary ice nucleation parameterizations in an explicit cloud model, J. Appl. Meteor., 31, 708–721, 1992.
Meyers, M. P., Walko, R. L., Harrington, J. Y., and Cotton, W. R.: New RAMS cloud microphysics parameterization, Part II: The two-moment scheme, Atmos. Res., 45, 3–39, 1997.
Mitsakou, C., Kallos, G., Papantoniou, N., Spyrou, C., Solomos, S., Astitha, M., and Housiadas, C.: Saharan dust levels in Greece and received inhalation doses, Atmos. Chem. Phys., 8, 7181– 7192, doi:10.5194/acp-8-7181-2008, 2008.
Mlawer, E. J., Taubman, S. J., Brown, P. D., Iacono, M. J., and Clough, S. A.: Radiative transfer for inhomogeneous at-mospheres: RRTM, a validated correlated-k model for the long-wave, J. Geophys. Res., 102(D14), 16663–16682, 1997. Monahan, E. C., Spiel, D. E., and Davidson, K. L.: A model of
marine aerosol generation via whitecaps and wave disruption, in: Oceanic Whitecaps, edited by: Monahan, E. C. and Mac Nio-caill, G., D. Reidel, 167–174, 1986.
Myhre, G., Grini, A., Haywood, J. M., Stordal, F., Chatenet, B., Tanr, D., Sundet, J. K. and Isaksen, I. S. A.: Modelling the ra-diative impact of mineral dust aerosol during the Saharan Dust Experiment (SHADE) campaign, J. Geophys. Res., 108(D18), 8579, doi:10.1029/2002JD002566, 2003.
Nenes, A. and Seinfeld, J. H.: Parameterization of cloud droplet formation in global climate models, J. Geophys. Res., 108, 4415, doi:10.1029/2002JD002911, 2003.
Nenes, A., Charlson, R. J., Facchini, M. C., Kulmala, M., Laakso-nen, A., Seinfeld, J.H.: Can Chemical Effects on Cloud Droplet Number Rival the First Indirect Effect?, Geoph.Res.Lett, 29 (17), 1848, doi: 10.1029/2002GL015295, 2002.