ISSN 1546-9239
© 2010Science Publications
Corresponding Author: A.R. Ismail, Faculty of Mechanical Engineering, University Malaysia Pahang, 26600 UMP Pekan, Pahang, Malaysia
360
Optimization of Temperature Level to Enhance Worker Performance
in Automotive Industry
1A.R. Ismail, 2M.Y.M. Yusof, 2N.K. Makhtar, 2B.M. Deros and 3M.R.A.Rani 1Faculty of Mechanical Engineering, University Malaysia Pahang,
26600 Pekan, Pahang, Malaysia
2Department of Mechanical and Materials Engineering, Faculty of Engineering and Built Environment,
University Kebangsaan Malaysia, 43600 UKM Bangi, Malaysia
3Department of Manufacturing Industrial Engineering, Faculty of Mechanical Engineering,
University Technology Malaysia, 81310 UTM Skudai, Malaysia
Abstract: Problem statement: Production of automotive parts is among the largest contributor to economic earnings in Malaysia. The dominant work involve in producing automotive part were manual assembly process. Where it is definitely used a manpower capability. Thus the quality of the product heavily depends on worker’s comfort in the working condition. Temperature is one of the environmental factors that give significant effect on the worker performance. Approach: Temperature level and productivity rate were observed in automotive factory. An automotive manufacturing firm was chosen to observe the temperature level and worker’s productivity rate. The data were analyzed using Artificial Neural Network’s analysis (ANN). ANN analysis technique is usual analysis method used to form the best linear relationship from the collected data. Results: It is apparent from the linear relationship, that the optimum value of production (value≈1) attained when temperature value (WBGT) is 24.5°C. Conclusion: Optimum value production rate (value≈1) for one manual production line in that particular company is successfully achieved. Through ANN method, the optimum temperature level for the optimum manual workers’ performance manage to be predicted.
Key words: Artificial Neural Network (ANN), optimum, productivity, temperature
INTRODUCTION
Automotive Industry in Malaysia contributes large profit and investment. According to the released automotive data by Malaysia Automotive Associations (MAA) in 2007, 441 678 vehicles were installed in manufacturing plants within Malaysia where 403 245 are passenger vehicles and 38 433 are commercial vehicles. This number increase every year. Due to that, demand of vehicle components (car/lorry/bus) rising, therefore productivity of the component should be increase. More than 30% of these components are fitted and done manually. For components which require observation and human touch such as installation engine car must be done manually. It uses a manpower capability. Thus, the quality of the product heavily depends on worker’s comfort in the working environment. One major issue in early Shikdar and Sawaqed(2003) research concerned is about industries are featured with improper workplace design, ill-structured jobs, mismatch between workers’ abilities
and job demands, adverse environment, poor human-machine system design and inappropriate management programs. It means that the comfort level for workers do their job is not been considered in the first place. Tarcan et al.(2004) indentifies irritated, sore eyes and throat, hoarseness, stuffy congested nose, excessive mental fatigue, headache and unusual tiredness were all signs of the negative workplace environmental conditions.
affect the comfort level of the production operators to perform their jobs. When comfort level at workplace increase, the productivity increase too. In 2001, Ettner and Grzywacz (2001) published a paper in which they described that the work environments were associated with perceived effects of work on health. Workplace environmental conditions, such as humidity, indoor air quality and acoustics have significant relationships with workers’ satisfaction and performance(Phadke, 1989; Tarcan et al., 2004). One of the dominant factors that can contribute to the productivity at the body assembly production line is WBGT values inside the factory (Ismail et al., 2009). These factors need to be adjusted to get the best ratio will increase the rate of comfort in workplace. If environmental temperature increase, quality performance production for work shift day will decrease (Bobko et al., 2006). Thermal suitability is factor for worker’s satisfaction and comfort to work in close environment (Budaiwi, 2007). The relationship between thermal comfort and acceptability was investigated by (Budaiwi, 2007). He compared the effect of temperatures that deviate from those of optimum comfort assessed by percent of comfortable (Gagge and Nevins, 2009). Productivity decline as much as 5-7% in high temperature room (Niemela et al., 2002). Without ventilation, a building’s occupants will first be troubled by adores and other possible contaminants and heat (Atmaca et al., 2007). Ventilation system is an important component for controlling environmental temperature and plays a key role in comfort level of working environment.
Productivity may be classified as ratio of some output with some input (Bain, 1982). Productivity is relationship of output in an particular organization with its input (Belcher, 1987). To measure productivity, Eq. 1 can be used:
output result efficiency productivity
input source effectiveness
= = = (1)
Productivity is relationship between goods output or service with employee input or non-human resource in production which will consider employee total working hours, machine total hours operating and other (Buehler and Shetty, 1981). Productivity basically consist of three basis which are the production input, production output and effectiveness of product distribution from inputs to output (Bhattasali and Bhattasali, 1972). Artificial Neural Network (ANN) is a calculation system for sets of data in nonlinear experiment that uses system neurons with ability mapping linear line (Hao et al., 2008). Hayati (2007) defines the Artificial Neural Network as an
interconnection of simple processing element that use simple biological neuron as it functionality.ANN operating similarly like human brain function to resolve problems which involve mathematical calculation (Zhou et al., 2008). ANN consist of input layer, layer hiding and output layer. ANN is a system that can build an accurate input-output experiment system (Leo and Huang, 2008). In this study, World Bulb Globe Temperature (WBGT) index is used to represent room temperature. WBGT index is temperature parameter which consist thermometer global reading (globe thermometer), dry bulb thermometer reading and wet-bulb thermometer reading (Talty, 1998).
Close environmental equation:
WBGT = 0.7Tnwb+0.3Tg (2)
Open environmental equation:
WBGT = 0.7Tnwb+0.2Tg+0.1Ta (3)
Where:
Tnwb = Wet bulb temperature Tg = Global temperature Ta = Air temperature
MATERIALS AND METHODS
A Malaysian based automotive company had been selected as a place of study. The study had been conducted on 5 and 12 January 2009. This study was carried out in a 200 m2 area production set equipped with an air conditioner cooling system. During the study, one operator was chosen as the subject. The operator worked as usual, and the experimental measurement equipments did not restrict the operator in his work. The equipment was mounted near the operator, with a maximum range of 3 meters. All factors were recorded at 10 min time intervals one working shift. This experiment was conducted for two working days (two shift days).
362 After the data were measured and recorded, the data were analyzed using the ANN’s process to obtain a linear regression of the production rate versus the temperature level. This analysis was conducted repeatedly to produce the best reading. After obtaining the best data variation, the optimum value was determined.
In this study, productivity is determined by comparing the real output value with the target output. Based on Eq. 1, productivity will be calculated as the ratio of real output (input) to target output (output). Below is the calculation used for productivity; the productivity will be calculated with the use of Eq. 4. Target output per shift = 1400 units
Time for one shift = 9 h Interval period = 1.15 h Real time work = (9-1.15) h
= 7.45 h
Target output for 10 min = 30.107 units real output
Pr oductivity
30.107
= (4)
Equipments: Temperature level in this study was measured based on wet-bulb temperature global (Wet Bulb Globe Temperature, WBGT). This WBGT was carried out using Quest-Thermal Environment Monitor equipment as shown in Fig. 1. This equipment use Eq. 1 to calculate WBGT level in the study field. For each 10 min, WBGT level and production rate being recorded. To confirm whether the optimum value has achieved an acceptable range, the regression value (R) must be within the range of 0.5-1.
Fig. 1: Quest-thermal environment monitor
Two factors were tested in this study. Firstly, the proportion factor between the production rate values after ANN analysis versus the production rate before ANN analysis was evaluated, and secondly, the proportion factor between the production rate values after ANN analysis versus the WBGT values was investigated.
RESULTS AND DISCUSSION
After the WBGT level and production rates were obtained, the data were evaluated using ANN analysis to determine a linear relationship between the WBGT level and the production rate. In the ANN analysis, the WBGT values were set to be constant, while the dependent variable factor (production rate) was trained and altered. The production rate was manipulated to obtain a significant value.
Experiment day 1: During the experiment parameters such as WBGT level, real production and target production were measured and recorded. By using Eq. 4, the productivity for the 1st day of the experiment can be obtained. The readings were recorded at 10 min intervals, starting from 9:40 am to 4:00 pm There was some idle time in the operation, due to the worker’s break time and machine maintenance.
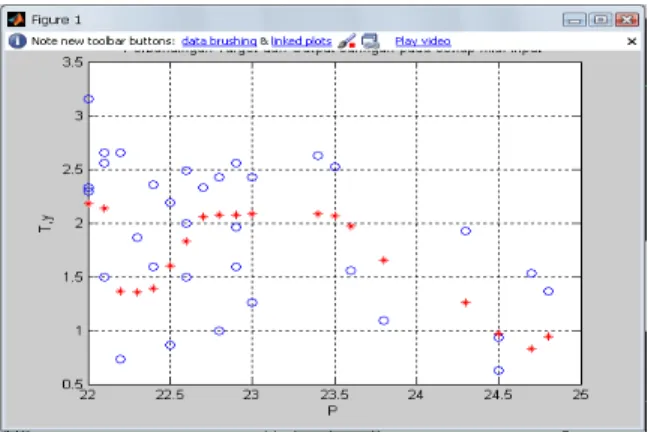
Figure 2 shows the original value of the production rate (shaped ‘o') together with the production rate value obtained after ANN analysis (shaped ‘*') versus the WBGT value for the first day of the experiment. As can be seen in Fig. 2, that original value of production rate scattered randomly versus WBGT value. But after ANN analysis, production rate value scattered below 22.7°C, the graph plotted linearly stable until 23.5°C and reduced linearly after 23.5°C. The data are divided into three parts which are the training part (Fig. 3a), validity part (Fig. 3b) and test part (Fig. 3c).
Fig. 3: Production rate graph before ANN analysis versus production rate after ANN analysis for training department, validity, test and total This three training part will contribute to R value for proportion factor between production rate value after ANN analysis versus production rate before ANN analysis.
For the first day of the experiment, the R value is 0.60526 (Fig. 3d) for the proportion factor between the production rate value after ANN analysis versus the production rate before ANN analysis. This shows that the relationship between the production rates after ANN analysis with the production rate before analysis is strong. Meanwhile, for the proportion factor between the production rate values after ANN analysis versus the WBGT values, the R value is 0.5065. The strength of relationship between production rates after ANN analysis on WBGT is fairly high.
With result of both proportion factor giving R value exceeds 0.5, this observation can conclude that the production rate after ANN analysis versus WBGT is proportional quite linear. Through this relationship, the optimum production value (value≈1) will be achieved when WBGT value is 24.495. Temperature giving comfort level is within 24-27°C (International Organization for Standard, 2005). The optimum temperature value that has been achieved in this study is between that value.
Experiment day 2: The data were recorded at 10 min intervals from 9:40 am to 4:50 pm. There was some idle time in the operation, due to the worker’s break time and machine maintenance.
Fig. 4: Production rate graph verses WBGT value
Fig. 5: Production rate graph before ANN analysis versus production rate after ANN analysis for training department, validity, test and total
364 production rate value after ANN analysis versus production rate before ANN analysis.
For the 2nd day of the experiment, the proportion factor between the production rate values after ANN analysis versus the production rate before ANN analysis has an R value is 0.81055 (Fig. 5d). This shows that the relationship between the production rate after ANN analysis and the production rate before analysis is strong. Meanwhile for the proportion factor between the production rate values after ANN analysis versus the relative humidity values, the R value is 0.7216. The strength of relationship between production rates after ANN analysis versus WBGT is fairly high.
With the result for both proportion factor value, R which exceeded 0.5, this observation can concluded that the production rate after ANN analysis versus WBGT is proportional quite linear. Through this relationship, the optimum value of production (value≈1) can be achievable when the WBGT value is 23.3°C. Temperature that gives best comfort level value is within 24-27°C (International Organization for Standard, 2005). The optimum temperature value that have achieved in this study is between that values.
CONCLUSION
The objective of the study to interpret optimum temperature level to seek optimum value production rate (value≈1) for one manual production line in that particular company is successfully achieved. The predicated optimum values were analyzed by ANN's system with regression value, R within acceptable range and strong. Through ANN's system, optimum environmental temperature level can be predicted. As the result, data of temperature in second day of experiment will be considered as data for this experiment because it has higher regression value. The optimum value of production can be obtained (value≈1) when the temperature value (WBGT) is 24.5°C. For comfortable temperature is within 24-27°C (International Organization for Standard, 2005).
REFERENCES
Atmaca, I., O. Kaynakli and A. Yigit, 2007. Effects of radiant temperature on thermal comfort. Build. Environ., 42: 3210-3220. DOI: 10.1016/j.buildenv.2006.08.009
Bain, D., 1982. The Productivity Prescription. 1st Edn., RR Donnelley and Sons Company, McGraw-Hill, New York, ISBN: 0070032351, pp: 308.
Belcher, J.G., 1987. Productivity Plus: How Today's Best Run Companies are Gaining the Competitive Edge. 1st Edn., Gulf Publishing Company, Houston, Texas, ISBN: 0872014517, pp: 237.
Bhattasali, B.N. and G. Bhattasali, 1972. Productivity and Economic Development. 1st Edn., Asian Productivity Organization, New York, pp: 121. Bobko, N.A., V.I. Chernyuk and Y.Y. Yavorskiy, 2006.
Effects of time-of-day, work strain, noise and air temperature on human-operator performance under time pressure. Posters session 2. Int. J. Psychophysiol., 69: 242-275. DOI: 10.1016/j.ijpsycho.2008.05.142
Budaiwi, I.M., 2007. An approach to investigate and remedy thermal-comfort problems in buildings. Build. Environ., 42: 2124-2131. DOI: 10.1016/j.buildenv.2006.03.010
Buehler, V.M. and Y.K. Shetty, 1981. Productivity Improvement: Case Studies of Proven Practice. 1st Edn., AMACOM, ISBN: 0814457010, pp: 273. Dua, J.K., 1994. Job stressors and their effects on
physical health, emotional health and job satisfaction in a university. J. Educ. Admin., 32: 59-78. DOI: 10.1108/09578239410051853 Ettner, S.L. and J.G. Grzywacz, 2001. Workers’
perceptions of how jobs affect health: A social ecological perspective. J. Occup. Health Psychol., 6: 101-113.
Gagge, A.P. and R.G. Nevins, 2009. Effect of energy conservation guideline, on comfort, acceptability and health. Office of Scientific and Technical Information.
http://www.osti.gov/energycitations/product.biblio. jsp?osti_id=5009419
Hao, W., Z. Hongtao, G. Qianjian, W. Xiushan and Y. Jianguo, 2008. Thermal error optimization modeling and real-time compensation on a CNC turning center. J. Materials Process Technol., 207: 172-179. DOI: 10.1016/j.jmatprotec.2007.12.067 Hayati, M., 2007. Short term load forecasting using
artificial neural network for the West of Iran. J. Applied Sci., 7: 1582-1588.
International Organization for Standard, (ISO), 2005. ISO 7730: 2005 Ergonomics of the thermal environment- Analytical determination and interpretation of thermal comfort using calculation of the PMV and PPD indices and local thermal
comfort criteria. ISO. http://www.iso.org/iso/catalogue_detail.htm?csnum
ber=39155
Ismail, A.R., M.R.A. Rani, Z.K.M. Makhbul, K. Sopian and B.M. Deros, 2009. Thermal comfort assessment and optimization of environmental factors by using Taguchi method. Am. J. Applied Sci., 6: 1731-1741.
Leo, C.K.L. and Y.K. Huang, 2008. Process optimization of sedimentation self-assembly of opal photonic crystals under relative humidity-controlled environments. Expert Syst. Appli., 35: 887-893. DOI: 10.1016/j.eswa.2007.07.051
Niemela, R., M. Hannula, S. Rautio, K. Reijula and J. Railio, 2002. The effect of air temperature on labor productivity in call centers-a case study. Energy Build., 34: 759-764.
Olesen, B.W., 1995. International standards and the ergonomics of the thermal environment. Applied Ergon., 26: 293-302. DOI: 10.1016/0003-6870(95)00033-9
Phadke, M.S., 1989. Quality Engineering Using Robust Design. 1st Edn., Prentice Hall, New Jersey, ISBN: 0-13-745167-9, pp: 333.
Shikdar, A.A. and N.M. Sawaqed, 2003. Worker productivity and occupational health and safety issues in selected industries. Comput. Ind. Eng., 45: 563-572.
Talty, J.T., 1988. Industrial Engineering Recognition: Recognition, Measurement, Evaluation and Control. 2nd Edn., William Andrew Inc., ISBN: 0-8155-1175-2, pp: 831.
Tarcan, E., E.S. Varol and M. Ates, 2004. A qualitative study of facilities and their environmental performance. Manage. Environ. Qual.: Int. J., 15: 154-173. DOI: 10.1108/14777830410523099
Zhou, C.C., G.F. Yin and X.B. Hu, 2008. Multi-objective optimization of material selection for sustainable products: Artificial neural networks and genetic algorithm approach. Mater. Des.,,