ABSTRACT: Design candidates obtained from optimization techniques may have meaningful information, which provides not only the best solution, but also a relationship between object functions and design variables. In particular, trade-off studies for optimum airfoil shape design involving various objectives and design variables require the effective analysis tool to take into account a complexity between objectives and design variables. In this study, for the multiple-conflicting objectives that need to be simultaneously fulfilled, the real-coded Adaptive Range Multi-Objective Genetic Algorithm code, which represents the global and stochastic multi-objective evolutionary algorithm, was developed for an airfoil shape design. Furthermore, the PARSEC method reflecting geometrical properties of airfoil is adopted to generate airfoil shapes. In addition, the Self-Organizing Maps, based on the neural network, are used to visualize trade-offs of a relationship between the objective function space and the design variable space obtained by evolutionary computation. The Self-Organizing Maps that can be considered as data mining of the engineering design generate clusters of object functions and design variables as an essential role of trade-off studies. The aerodynamic data for all candidate airfoils is obtained through Computational Fluid Dynamics. Lastly, the relationship between the maximum lift coefficient and maximum lift-to-drag ratio as object functions and 12 airfoil design parameters based on the PARSEC method is investigated using the Self-Organizing Maps method.
KEYWORDS: Aerodynamics, Adaptive Range Multi-Object Genetic Algorithm, PARSEC, Self-Organizing Map,
Computational Fluid Dynamics.
An Implementation of Self-Organizing
Maps for Airfoil Design Exploration via
Multi-Objective Optimization Technique
SungKi Jung1, Won Choi2, Luiz S. Martins-Filho1, Fernando Madeira1INTRODUCTION
An engineering design needs trade-off studies and corresponding analyses on the relationship between objectives and design variables to simultaneously fulill various goals, since industrial design problems involve multiple conlicting requirements. In particular, the typical aerodynamic design process in aerospace engineering is iterative, being necessary a number of design to achieve the balanced emphasis from the diverse inputs and outputs. Solutions to this problem require a compromise between the diferent objectives.
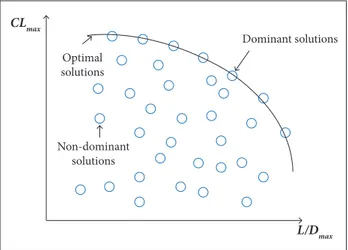
A traditional way to meet the optimum aerodynamic design is classically based on a trade-of study via design variables determined by designers’ intuitions. It requires a time-consuming process in order to classify proper candidates satisfying the multiple objectives from tremendous solutions in a case of high dimensions. Another attractive way is to identify the proper candidates during a trade-of study from a suitable criterion represented as non-dominated solutions, which are more dominant than any other, called Pareto solutions (Fig. 1). hese problems are typically included in the multi-objective (MO) optimization areas to determine the best design which fulills the requirements. For the MO optimization, the Evolutionary Algorithms (EAs), which perform a population-based search evolving the population in a cooperative search towards the Pareto front, may be treated as a standard tool (Deb 2001). Moreover, the MO optimization is not depended on the weight factors applied in cases of single object optimization in order to reduce the
1.Universidade Federal do ABC – Centro de Engenharia, Modelagem e Ciências Sociais Aplicadas – Santo André/SP – Brazil. 2.Hanwha Corporation/Machinery – Aerospace Division – Daejeon – Republic of Korea.
Author for correspondence: SungKi Jung | Universidade Federal do ABC – Centro de Engenharia, Modelagem e Ciências Sociais Aplicadas | Avenida dos Estados, 5.001 – Bangu | CEP: 09.210-580 – Santo André/SP – Brazil | Email: [email protected]
number of object functions. hen, there has been growing interests in the use of global optimization methods in a wide range of design problems, as well as aerodynamic shape optimization. Lian and Liou (2005) and Liang et al. (2011) applied the evolutionary algorithm to the MO optimization of transonic compressor blade. Anderson et al. (2000) applied genetic algorithms (GAs) to the MO optimization of missile aerodynamic shape design. Yang et al. (2010, 2012) adopted the EAs to maximize the range of a canard-controlled missile. In the same way, Jung et al. (2009) and Jung and Kim (2013) employed EAs, but to reduce the shock wave strength on the upper surface of the airfoil in the transonic regime and to maximize the lit coeicient as well as the lit-to-drag ratio. Besides, Choi et al. (2015) developed the multidisciplinary design optimization system to take into account the luid-induced structural deformation for a lexible wing and propose the better design concept for the wing. he system consists of the evolutionary algorithm and surrogate model in order to avoid the time-consuming problem due to the need for a massive computational resource.
Nevertheless, the evolution path for MO optimization is far more unclear than that for single-objective optimization, since the population converges in a cooperative search towards the Pareto front and not to a single optimum. In addition, the design and optimization of engineering systems in aerospace domain involve multiple objectives with large number of design variables and constraints. Consequently, design problems with multiple objectives pose many challenges even beyond optimization. A few of these challenges include visualization of the Pareto set of solutions and contribution to a trade-of
decision. In particular, a visualization model, which represents, in an eicient way, the interactions among the high-dimensional data, is useful to understand the behavior of the system. In this study, the Self-Organized Map (SOM), by Kohonen (1995), is employed to visualize the results of MO optimization for airfoil shape design exploration.
The SOM is one of the neural network models (Hollmen 1996), and the algorithm is based on unsupervised and competitive learning. It provides a topology preserving mapping, which means that nearby points in the input space are mapped to nearby units in the SOM from the high-dimensional space to map units. Map units, or neurons, usually form a 2-D lattice, thus the SOM is a mapping from high dimensions to two dimensions. Therefore, the SOM can serve as a cluster analysis tool for high-dimensional data. The cluster analysis will help to identify design trade-offs. Obayashi and Sasaki (2002, 2003) applied the SOM to analyze 766 Pareto solutions of the supersonic wing obtained from the EAs. Jeong et al. (2005) employed the SOM with the purpose of data mining for an aerodynamic design space. Büche et al. (2002) applied the SOM for Pareto optimization of airfoils. Parashar et al. (2008) utilized the SOM for design selection from the Pareto data obtained via MO design exploration of airfoil.
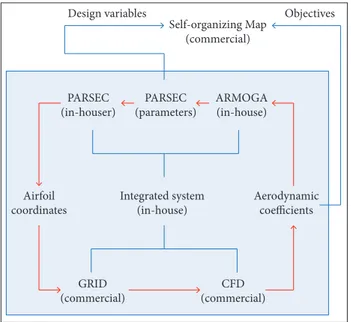
In this study, an aerodynamic airfoil shape design has been conducted to increase the maximum lit coeicient and the maximum lit-to-drag ratio using the Adaptive Range Multi-Object Genetic Algorithm (ARMOGA) proposed by Sasaki and Obayashi (2005) and the PARSEC method (Sobieczky 1999). he PARSEC airfoil generator based on the explicit mathematical functions is used for 2-D curve deinition of airfoils. Furthermore, the Computational Fluid Dynamics (CFD) tools are employed to obtain the aerodynamic characteristics of candidate airfoils. In this study, the ARMOGA and PARSEC codes were developed (Yang et al. 2010, 2012; Jung et al. 2009; Jung and Kim 2013; Choi et al. 2015), and an integrated system code combining the in-house and commercial codes was also developed. Twelve PARSEC parameters were chosen as design variables for each side of the airfoil surfaces. To alleviate an amount of computational time, parallel computing was utilized to simulate the low ield around airfoils. Figure 2 shows the optimization system.
Lastly, the SOM was applied to map entire solutions assessed during the evolution of the optimization. he resulting 160 Pareto solutions were obtained and analyzed to reveal trade-ofs. Dominant solutions
Non-dominant solutions Optimal solutions
L/D
max
CL
max
AN INTEGRATED OPTIMIZATION SYSTEM
FOR AIRFOIL DESIGN EXPLORATIONS
OPTIMIZATION MODULEIn general, EAs are based on the binary system which consists of the values 0 and 1 in order to express the chromosome. In the case of large values of design variables, the binary-based EAs require an amount of digits. Consequently, the computer resources are heavily used. As an alternative of the binary-based EAs, the real-coded ARMOGA (Sasaki and Obayashi 2005) may be attractive, since it allows the use of computer resources by using the real numbers with respect to design variables. h e ARMOGA introduces the range adaptation to change the search region according to the statistics of better solutions. For the range adaptation, Arakawa and Hagiwara (1998) originally proposed a normal distribution representing the design space in binary-coded Adaptive Range Genetic Algorithms (ARGA) for single-objective problem. Oyama et al. (2001) extended the binary-coded to real-coded ARGA for design optimization. h en, the ARGA was extended to MO optimization problems in order to treat multiple solutions and maintain their diversity, unlike single-objective problems.
h e whole process of the real-coded ARMOGA is exactly the same of Multi-Objective Evolutionary Algorithm (MOEA), except for the range adaptation. h e main dif erence between
the ARMOGA and the conventional MOEA is the introduction of the range adaptation. h e key-role of ARMOGA is to adapt the population to promising regions during the optimization process, which enables ei cient and robust search with good precision while keeping the string length small. Moreover, ARMOGA eliminates the need for prior dei nition of search boundaries, since it distributes candidates according to the normal distributions of the design variables in the present population. h e details of ARMOGA can be found in Jung and Kim (2013), Choi et al. (2015) and Sasaki and Obayashi (2005). Figure 3 shows the dif erence among the general GAs, Multi-Objective Genetic Algorithm (MOGA), real-coded ARGA and ARMOGA. h e developed ARMOGA code (Jung and Kim 2013; Choi et al. 2015), as an optimization module, is evaluated by applying it to the MO problems in Eq. 1. h e test problem has the intent to minimize two objective functions as:
Design variables
Self-organizing Map
( commercial)
GRID (commercial)
CFD (commercial) PARSEC
(in-houser)
PARSEC (parameters)
Integrated system (in-house) Airfoil
coordinates
Aerodynamic coefficients ARMOGA (in-house)
Objectives
Initial population
GA MOGA ARGA ARMOGA Evaluation
Pareto solution
Selection
Crossover
Mutation
Reproduction
Range adaptation
Sampling
Yes
Yes No No
End
Final generation? Every N generation?
No
Figure 2. Integrated system for optimization process based on the ARMOGA, PARSEC and CFD methods, as well as post process for an analysis between objectives and design variables based on the SOM.
minimize:
F
= [f
1(
x
), f
2(
x
)],
where: f1
(
x
) = x
1, f
2(
x
) = 1+ x
2/ x
1subjected to: 0.1 ≤ x12
≤ 1, 0 ≤ x
2≤ 5.
Figure 3. Comparisons of l owcharts between the binary-based GA (black solid and dotted lines), MOGA (black and red solid lines) and real-coded ARGA (black solid and dotted lines and blue solid line), ARMOGA (black, blue and red solid lines).
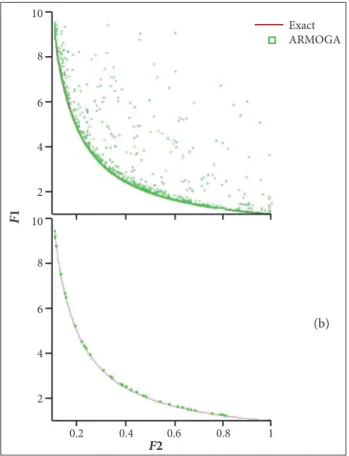
Population sizes and generations are set at 40 and 50, respectively. Also, the tournament selection, uniform crossover, and 4% of mutation are applied to the developed code. he search performance of the developed ARMOGA code is evaluated in terms of closeness, reasonable spread, and many samplings in the Pareto front as shown in Fig. 4. From the comparisons between the exact solutions and the present results, the accuracy and diversities of Pareto solutions of the developed ARMOGA code are guaranteed with many samples of Pareto front.
various optimization problems. Values of the participation coefficients (design variables) are used to determine the contribution of the shape functions.
Sobieczky (1999) chose basic parameters to characterize an airfoil in a 6th-order polynomial function — the PARSEC, which is a very common and highly efective method for airfoil parameterization. It uses 11 basic parameters to completely define the airfoil shape. In addition, the basic parameters include the physical meaning, such as leading edge radius, maximum thickness, and so on. In this study, a modified PARSEC approach was adopted, allowing the independent deinition of the leading edge radius, for both upper and lower surfaces (Arias-Montaño et al. 2012).
hus, a total of 12 variables were used. Figure 5 illustrates the original (a) and modiied (b) PARSEC approaches based on the 11 and 12 basic parameters, respectively. he PARSEC approach adopted here uses a linear combination of shape functions to deine the upper and lower surfaces. hese linear combinations are given by:
1 0
8
Exact ARMOGA
6
4
2
0.2 0.4 0.6 0.8 1
10
8
6
4
2
F2
F
1
Zxxup
Zxxlo
Xlo Z lo
Xup
Zxxlo Xlo Z lo
Xup
Zup
Zxxup
Zup
ZTE ZTE
∆ZTE
∆ZTE
βTE βTE αTE
αTE
rle
rleup
rlelo
Figure 4. The whole Pareto set (a) and non-dominated Pareto front (b) with respect to the test problem (Jung and Kim 2013).
AIRFOIL GENERATION MODULE
In order to generate airfoil shapes, there are types of parametric models to represent wing section geometry in literature. The Bezier curve is one of the most popular parameterization techniques. A Bezier curve is controlled by its deining points in a plane. It passes through initial and inal control points, but it is not necessary for Bezier curve to pass through each intermediate control point which is deining the shape of the airfoil (Derksen and Rogalsky 2010).
Hicks and Henne (1978) proposed the shape functions with small or moderate perturbations of baseline airfoil for solving
upper:
Z
upper=
Σ
a
nx
(n–1/2),
and lower:
Z
lower=
Σ
b
nx
(n – 1/2)where: an and bn are coeicients determined as a function of the 12 described geometric parameters, solving two systems of linear equations.
A main reason for modifying the original PARSEC approach is to obtain the two leading edge radiuses of PARSEC parameter from coordinate data of the digitized reference airfoil, since the
Figure 5. Original (a) and modiied (b) PARSEC methods.
6
6
n = 1
n = 1
(2)
(a)
leading edge radiuses of lower and upper sides of airfoil are not exactly equal to one constant value. he PARSEC coeicients for the upper side of the reference airfoil can be obtained by using Eq. 3, and the x and z coordinate values are presented by a vector form:
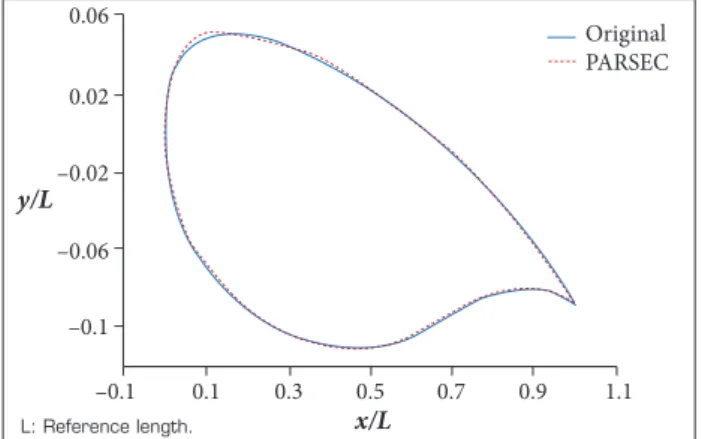
airfoil can be obtained by the same manner using Eqs. 3 to 8. Figure 6 shows a comparison between the originally digitized airfoil shape and the re-generated airfoil shape using the PARSEC parameters. As a result, an applicability of the modiied PARSEC approach is guaranteed. Finally, the values of PARSEC parameters of the reference airfoil become standard values to allocate the minimum-maximum ranges of design variables for airfoil shape designs.
Z
=
AX
where:
he PARSEC coeicients can be obtained by transposing and inverting the matrix X in Eq. 4:
A =
(
X
TX
)
–1(
X
TZ
).
hen, the PARSEC parameters are determined by Eqs. 5 to 8. he value of xup can be deined by the diferential of Eq. 2. Iterative methods, such as the Newton-Raphson, can be utilized to obtain the value of xup from Eq. 5:
he value of zup is determined by substituting the value of xup obtained in Eq. 5 into Eq. 2; then, for a curvature of upper surface, the second diferential of Eq. 2 at the xup is applied to determine the value of zxxup. he leading edge radius, rle, is simply deined by Eq. 6 as:
Finally, a trailing edge shape is determined by α and β:
he PARSEC coeicients for the lower side of the reference
0.06
0.02
Original
PARSEC
–0 .0 2
x/L y/L
–0 .0 6
–0 .1
–0 .1 0 .1 0 .3 0 .5 0 .7 0 .9 1 .1
L: Reference length.
Figure 6. A comparison of originally digitized coordinate values (red line) and regenerated coordinate values (blue line) by PARSEC method.
CFD MODULE
Although a prediction of aerodynamic coeicients can be archived by using various techniques, such as semi-empirical and panel methods, those which can exactly capture the shock waves and flow separations are still included in the CFD domains. In addition, compressible and turbulent lows can be successfully explained by the Navier-Stokes equations. In this study, the classical Reynolds-Averaged Navier-Stokes (RANS) equation is employed as the governing equations. The CFD solver is formulated by a finite volume method and solved using an implicit time marching procedure. For the spatial discretization, Roe’s approximate Riemann solver and Van Leer’s monotone upstream-centred schemes are employed. Van Albada’s limiter is adopted in order to prevent the generation of oscillation and preserve the monotonicity. For the temporal discretization, an implicit scheme is employed to accelerate the convergence. he Spalart-Allmaras turbulent model is chosen 6
1
n = 1
(3)
(7)
(8)
(4)
(5)
(6) , and
dz/dx =
Σ
a
n(
n
– 0.5) x
n – 1.5= 0.
r
le= a
2/ 2.
dz/dx =
Σ
a
n(
n
– 0.5) = tan (
α
–
β
/2),
dz/dx =
Σ
a
n(
n
– 0.5) = tan (
α
+
β
/2).
6n = 1
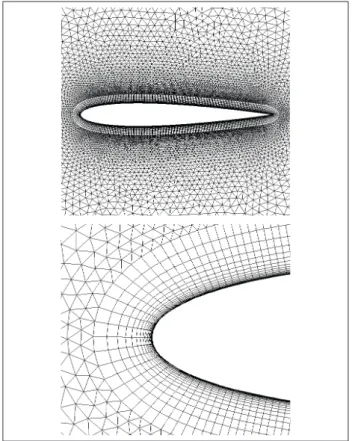
to close the RANS for the turbulence low. Also, no-slip and Riemann invariant conditions are applied on the solid surface and the far ields for the boundary conditions, respectively. An ideal gas equation is employed to close the system of equations. A hybrid grid, which consists of the quadrature (prism layer) and trigonal grid for boundary layers and far ield, is adopted to capture the low separation near the solid surface and eiciently reduce the computation resource and calculation time. For the CFD simulation, the commercial codes FLUENT, GAMBIT, and TGRID are used. Even though the commercial codes are applied to simulate the low ields around airfoils, a validation is essential to guarantee the reliability in the methodologies of the present research. In this study, a NACA 0012 airfoil is chosen to validate the presented approaches. Figure 7 shows the grid topology, which has approximately 45,000 cells with 26 prism layers, around the NACA 0012 airfoil. Figure 8 shows comparisons of the present and experimental data (Abbott and von Doenhof 1959). he grid sensitivity has been fully evaluated controlling the number of prism layers and cells. At the ixed Y+ ~ 1.0 and growth rate, the various numbers of prism layers have been tested with comparisons of the experimental test results at zero angle of attack. As the number of prism layers increased, the drag coeicients decreased. A
variation of drag coeicients due to the total number of prism layers showed a ten-percent deviation between the coarse and ine meshes by the numerical experiments. Finally, the total number of prism layers is ixed as 26, being the height of the irst layer for the viscous low in the boundary layer aligned to Y+ ~ 1.0, and the growth rate of prism layer is 1.2. he present CFD approaches are applied to obtain the aerodynamic coeicients during the airfoil shape design exploration.
1.4 –0.2 0.4 1.0 1.6
1.0
0.6
0.2
0.0000 0.0060 0.0120
20
Present
Experiment
AoA
CD
CL
CL
10 0
AoA: Angle of attack; CD: Drag coeficient; CL: Lift coeficient.
Figure 7. Grid generation around NACA 0012 airfoil.
Figure 8. Validation of the present CFD approaches using the experimental data of NACA 0012 airfoil at Re = 0.9e+07.
SELF-ORGANIZING MAP
he SOM consists of components called nodes or neurons. Each node is directly associated with a weight vector. In addition, the weights between the input vector and the array of neurons are adjusted to represent features of the high-dimensional data on the low-dimensional map. he adjustment depends on the distance between the input vector and the neuron. Based on the distance, the best-matching unit and its neighbors become closer to the input vector. Repeating this learning algorithm, the weight vectors become smooth not only locally but also globally. hus, the sequence of close vectors in the original space results in a sequence of the corresponding neighboring neurons in the 2-D map. Interestingly, the number of map nodes is signiicantly smaller than the number of items in the dataset, and it is not possible to represent every input item from the data space on the map. herefore, the objective of the SOM is to achieve a correlation between the similarity of items in the dataset and the distance of their most alike representatives on the map. In other words, items that are similar in the input space should be mapped to nearby nodes on the grid. he further details of SOM are described in Kohonen (1995) and Hollmen (1996). In this study, the SOMs are generated by using the commercial sotware ViscoveryÒ SOMine (Viscovery 2016).
APPLICATION AND RESULTS
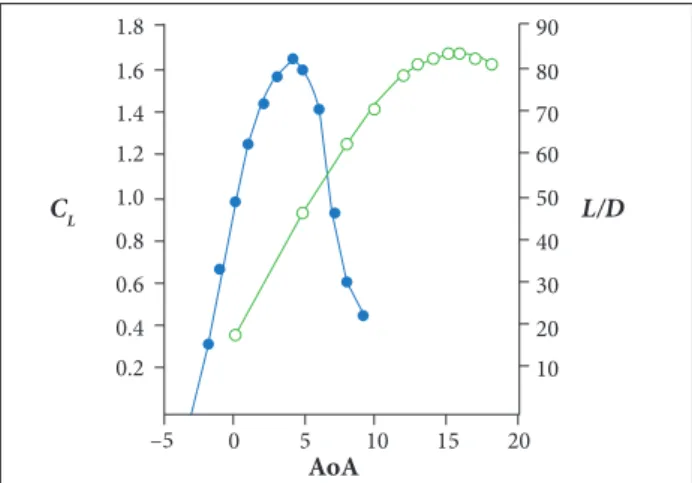
Considering the airfoil shape design for aerodynamic performances better than that of a reference airfoil, one needs to know the aerodynamic characteristics of the reference airfoil in order to eiciently identify and preserve the elite populations in Pareto solutions. Figure 9 shows the aerodynamic characteristics of
a reference airfoil, with the aerodynamic characteristics being obtained by the CFD solver; the same grid topology and CFD methods applied for validations of NACA 0012 airfoil are adopted. Flow conditions are Mach numbers 0.2 and 0.6, sea-level and 25,000 t altitudes, and Reynolds numbers 1.1e+07 and 1.8e+07. hese represent the landing and cruise conditions of the reference airfoil.
For the ARMOGA operation, the population size and the generation are set at 16 and 10, respectively. Also, tournament selection, uniform crossover, and 4% of mutation are applied to the developed ARMOGA code. Every third generation is selected for the adaptive range distributions of populations. Maximum and minimum ranges of design variables are allocated to ± 20% of PARSEC parameter of the reference airfoil. Furthermore, the maximum lit-to-drag ratio and maximum lit coeicient, which are the representative aerodynamic coeicients for cruise and landing conditions, are selected as object functions. Under the basic concept of maximum lit-to-drag ratio and maximum lit coeicient, the maximum functions (Jung and Kim 2013) in object functions are adopted to eiciently search the elite populations. he maximum function can be dealt with weight factors for the optimization strategy in Eq. 9:
maximize:
F
= [f
1(
α
), f
2(
α
)].
where: f1
(
α
) = L/D + max {[L/D –(L/D)
0], 0}
f
2(
α
) = C
Lmax
+ max {[C
Lmax– C
Lmax, 0], 0},
subjected to: α1= α
stall of Ref. Airfoil@ M = 0.2,
α
2= α
(L/D)max of Ref. Airfoil@ M = 0.6
where: L/D is the lit-to-drag ratio; CLmax is the maximum lit coeicient; (L/D)0 and CLmax,0 are the maximum lit-to-drag ratio and lit coeicients of the reference airfoil at speciied angles of attack for a reduction of computational resource and calculation time; αstall of Ref. Airfoil @ M = 0.2is the stall angle of attack of reference airfoil at the Mach number 0.2.
Equation 9 explains that, if the maximum lit coeicient and lit-to-drag ratio of candidate airfoils are higher than that of the reference airfoil at speciied angles of attack, it may be considered that the candidate airfoils are more excellent than the reference airfoil in a whole range of angles of attack. Figure 10 shows the optimization results. he bold line indicates the 1.8
1.6 1.4 1.2
1.0
0.8
0.6 0.4 0.2
90
80
70 60 50
40
30
20 10
20
AoA
L/D
CL
15 10 5 0 –5
Figure 9. Aerodynamic characteristics of reference airfoil at M = 0.2 and 0.6, sea-level and 25,000 ft altitudes and Re = 1.1e+07 and 1.8e+07 (Jung and Kim 2013).
non-dominated solutions and the red circle, the reference airfoil. C1 and C2 are outstanding airfoils which show better performances than the reference airfoil. For instance, C2
has a
higher lit coeicient than those of the reference and C1 airfoils. Regarding the maximum lit-to-drag ratio, C1 has a slightly higher value than C2. he outstanding airfoils indicate that their aerodynamic performances are better than those of the reference airfoil. Also, they can be taken into account for the CL and L/D curves, respectively. In Fig. 11, the aerodynamic characteristics with respect to the outstanding airfoils show a better performance in a whole range of angles of attack at given Mach numbers. In addition, the present approach with speciied angles of attack in object functions can be considered an eicient searching strategy.Appling the design variables and object functions as input vectors to the SOM, a feature between the design variables and object functions can be shown to identify the critical design parameter. Figures 12 and 13 show the maps of object functions and the corresponding design variables obtained by the SOM. In Fig. 12, high-value areas that simultaneously fulill the maximization of object functions in the maps are captured with black solid lines. hen, the dominant PARSEC parameters for object functions are investigated by those corresponding areas in the maps of the design variables. Maps with black solid line in Fig. 13 show the dominant PARSEC parameters for increasing the maximum lit coeicient and maximum lit-to-drag ratio; the other parameters
Figure 10. Pareto set (blue circle) with a reference solution (red circle) and non-dominated Pareto solutions (blue circle and black line).
Dominant solutions
Non-dominant solutions
80 70
60 50
40 1.60 1.65 1.70 1.75 1.80 1.85
Reference solutions
L/D
max
CL
max
L/D CLmax
70
69 72 74 76 77 79 81 82 84 86 10 11 11 12 13 13 14 14 15 15 14
rle rle_lo xlo zlo
xup zup zxxup zte
αte βte zxxlo ∆z
te –0.058 –0.049 0.30 0.37
0.015 0.019 0.066 0.044
–0.00034 0.00035 –0.94 –0.77
0.09 0.10 0.35 0.42
–0.00037 0.00040 –0.52 –0.63
7.7 8.5 9.4 –8.6 –7.3
90
Reference
C1 C2
L/D
CL
80
70
60
50
AoA
40
30
20
10
0 1.9
1.7
1.5
1.3
1.1
0.9
0.7
0.5
0.3
0 5 10 15
Figure 11. Comparisons of lift and lift-to-drag ratio curves among reference (blue line) and outstanding (C1: green line and C2: red line) airfoils at M = 0.2 and 0.6, sea-level and 25,000 ft altitudes and Re = 1.1e+07 and 1.8e+07 (Jung and Kim 2013).
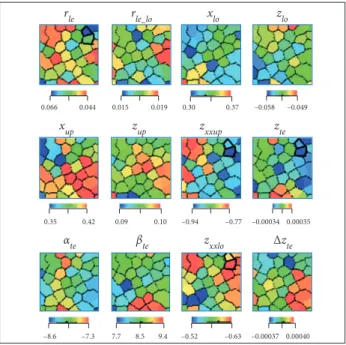
Figure 13. SOM results for design variables captured with black solid lines that indicate highly effective PARSEC parameters.
Figure 12. SOM results for object functions captured with black solid lines that simultaneously fulill the maximization of multi-object optimization problem: (a) maximum lift-to-drag ratio; (b) maximum lift coeficient.
Lower (%) Upper (%) Shared (%)
rle Xlo Zlo Zxxlo rle Xup Zup Zxxup ZTE ΔZTE αT E βT E 8.07 6.24 4.64 13.28 −16.27 0.12 7.07 −10.50 −13.37 6.25 −7.94 1.50 Table 1. A ratio between the averaged PARSEC parameters of outstanding airfoils and PARSEC parameters of reference airfoil.
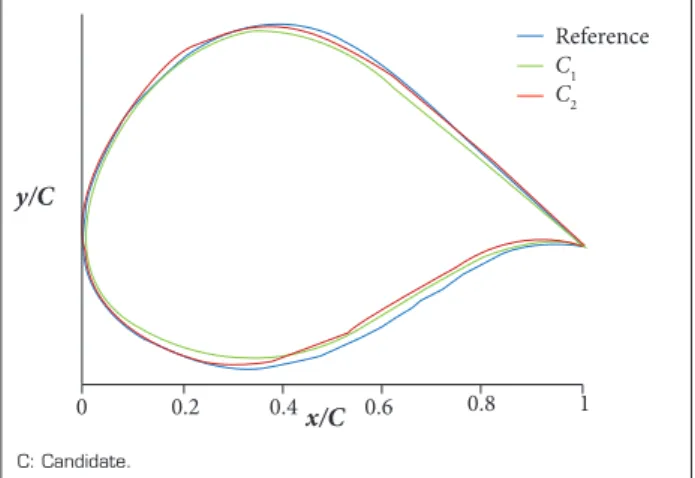
C: Candidate.
Figure 14.X-and y-coordinate values between the outstanding (C1: green line and C2: red line) and reference (black line) airfoils (Jung and Kim 2013).
y/C
x/C
0 0.2 0.4 0.6 0.8 1
Reference
C1 C2
are less efective in given ranges (± 20% of PARSEC parameter of reference airfoil) of design variables. For instance, the leading edge radius (r l e ) and curvature (z x x u p) at a maximum thickness position (x u p ) have a decrease tendency on the upper surface. Otherwise, for the lower surface, a curvature ( z x x l o ) at a maximum thickness position (x l o ) has an increase tendency. he position of the trailing edge indicates a decrease tendency. Such analysis results via SOM may be evaluated by an assessment of design variables among the outstanding airfoils, which have superior characteristics than those of the reference airfoil. Figure 14 shows geometrical comparisons among the airfoils; although the maximum thickness of upper and lower surfaces may be considered as a dominant parameter, the ratio divided by PARSEC parameter of reference airfoil indicates that the maximum thickness is less efective than the aforementioned
parameters, such as radius, curvature, and trailing edge position. It can be conirmed in comparisons of quantitative analysis presented in Table 1, where highly dominant parameters over than 10% in comparisons between the averaged PARSEC parameters of outstanding airfoils and PARSEC parameters of reference airfoil are exactly the same with the results of SOM analysis. Considering the minimum and maximum range of design variables within ± 20% of PARSEC parameters of the reference airfoil, the para- meters over than 10% may be regarded as dominant to improve the aerodynamic characteristics of the reference airfoil.
CONCLUSIONS
In this study, the SOM for aerodynamic airfoil shape design exploration via MO optimization technique is applied to investigate the dominant PARSEC parameters using the developed PARSEC, ARMOGA, and commercial codes. At given ranges of design variables, the dominant parameters obtained from the SOM results can be summarized to the leading edge radius of upper surface, curvatures at maximum thickness of both sides, and trailing edge position. Also, the SOM results are compared with the outstanding airfoils for quantitative evaluations. hus the dominant parameters between the SOM results and outstanding airfoils are exactly matched. In the future, pitching moment and divergence drag Mach number of theoutstanding airfoils will be investigated to consider the controllability and critical light speed. In addition, 3-D wing design will be explored by using the currently developed optimization system and the SOM.
REFERENCES
Abbott IH, von Doenhoff AE (1959) Theory of wing sections. New York: Dover Publications.
Anderson MB, Burkhalter JE, Jenkins RM (2000) Missile aerodynamic shape optimization using genetic algorithms. J Spacecraft Rockets 37(5):663-669. doi: 10.2514/2.3615
Arakawa M, Hagiwara I (1998) Development of Adaptive Real Range (ARRange) Genetic Algorithms. JSME Intl J Series C 41(4):969-977.
Arias-Montaño A, Coello Coello CA, Mezura-Montes E (2012) Multi-objective airfoil shape optimization using a multiple-surrogate approach. Proceedings of the 2012 IEEE Congress on Evolutionary Computation; Brisbane, Australia.
Choi W, Park CW, Jung SK, Park HB (2015) Multi-objective optimization of lexible wing using multidisciplinary design optimization system of aero non-linear structure interaction based on support vector regression. J Korean Soc Aero Space Sci 43(7):601-608. doi: 10.5139/JKSAS.2015.43.7.601
Deb K (2001) Multi-objective optimization using evolutionary algorithms. Chichester: Wiley.
Derksen RW, Rogalsky T (2010) Bezier-PARSEC: an optimized aerofoil parameterization for design. Adv Eng Software 41(7-8):923-930. doi: 10.1016/j.advengsoft.2010.05.002
Hicks RM, Henne PA (1978) Wing design by numerical optimization. J Aircraft 15(7):407-412. doi: 10.2514/3.58379
Hollmen J (1996) Self-organizing map; [accessed 2016 May 9]. http://www.cis.hut.i/~jhollmen/dippa/node7.html
Jeong S, Chiba K, Obayashi S (2005) Data mining for aerodynamic design space. J Aero Comput Inform Comm 2(11):452-469. doi: 10.2514/1.17308
Jung SK, Kim JH (2013) A study on real-coded adaptive range multi-objective genetic algorithm for airfoil shape design. J Korean Soc Aero Space Sci 41(7):509-515. doi: 10.5139/JKSAS.2013.41.7.509
Jung SK, Myong RS, Cho TH (2009) An eficient global optimization method for reducing the wave drag in transonic regime. J Korean Soc Aero Space Sci 37(3):248-254. doi: 10.5139/ JKSAS.2009.37.3.248
Kohonen T (1995) Self-organizing maps. Berlin: Springer.
Lian Y, Liou MS (2005) Multi-objective optimization of transonic compressor blade using evolutionary algorithm. J Propul Power 21(6):979-987. doi: 10.2514/1.14667
Liang Y, Cheng XQ, Li ZN, Xiang JW (2011) Robust multi-objective wing design optimization via CFD approximation model. Eng Appl Comp Fluid Mech 5(2):286-300.
Obayashi S, Sasaki D (2002) Self-organizing map of Pareto solutions obtained from multiobjective supersonic wing design. AIAA 2002-0991. Proceedings of the 40th AIAA Aerospace Sciences Meeting & Exhibit; Reno, USA.
Obayashi S, Sasaki D (2003) Visualization and data mining of Pareto solutions using self-organizing map. In: Fonseca CM, Fleming PJ, Zitzler E, Thiele L, Deb K, editors. Evolutionary Multi-criterion Optimization. v. 2632. Berlin: Springer Berlin Heidelberg. p. 796-809. (Lecture Notes in Computer Science).
Oyama A, Obayashi S, Nakamura T (2001) Real-coded adaptive range genetic algorithm applied to transonic wing optimization. Appl Soft Comput 1(3):179-187. doi: 10.1016/S1568-4946(01)00017-5
Parashar S, Pediroda V, Poloni C (2008) Self organizing maps (SOM) for design selection in robust multi-objective design of aerofoil. AIAA 2008-914. Proceedings of the 46th AIAA Aerospace Sciences Meeting and Exhibit; Reno, USA.
Sasaki D, Obayashi S (2005) Eficient search for trade-offs by adaptive range multi-objective genetic algorithms. J Aero Comput Inform Comm 2(1):44-64. doi: 10.2514/1.12909
Sobieczky H (1999) Parametric airfoils and wings. In: Fujii K, Dulikravich GS, editors. Recent development of aerodynamic design methodologies. Berlin: Springer Vieweg. p. 71-87. (Notes on numerical luid mechanics).
ViscoveryÒ (2016) The new approach to VISCOVER your data; [accessed 2016 May 9]. https://www.viscovery.net/somine/
Yang YR, Jung SK, Cho TH, Myong RS (2010) An aerodynamic shape optimization study to maximize the range of a guided missile. AIAA 2010-4240. Proceedings of the 28th AIAA Applied Aerodynamics Conference; Chicago, USA.