The present work proposes design models and recommendations for column-foundation connection through socket with rough interfaces, includ-ing the shear key coniguration, the socket and the precast column base. In the experimental investigations, the behavior of socket and column as a monolithic connection was veriied. However, for this to occur, the shear key dimensions must be between the limits suggested by the study. Considering the total transfer of internal forces in the connections, the vertical reinforcement should be designed based on the bending theory. The proposed model for the design of the transverse horizontal reinforcement, considering monolithic behavior of the connection, was found to be in good agreement with the observed experimental results. With adjustments to this model for the socket, a new model for the design of precast column bases is proposed and compared with other model adapted for rough interfaces.
Keywords: socket foundation, precast columns base, rough interfaces, shear keys, pedestal walls
Nesse trabalho, são propostos modelos e recomendações de projeto para a ligação pilar-fundação por meio de cálice com interfaces rugosas, incluindo a coniguração das chaves de cisalhamento, o cálice e a base do pilar pré-moldado. Nas investigações experimentais abrangidas neste estudo, foi constatado que nas ligações rugosas ocorre o funcionamento conjunto do cálice com o pilar como em uma ligação monolítica. Entre-tanto, para que isso ocorra, é necessário que as dimensões das chaves de cisalhamento estejam entre os limites recomendados nesse estudo. Considerando a transferência total de esforços na ligação, a armadura vertical deve ser dimensionada segundo a teoria de lexão. O modelo proposto para o dimensionamento da armadura horizontal transversal, também baseado no comportamento monolítico da ligação, forneceu bons resultados quando comparados com os valores experimentais. A partir desse modelo calibrado para o cálice, é proposta uma nova formulação para a base do pilar pré-moldado, a qual é comparada com outro modelo adaptado para interfaces rugosas.
Palavras-chave: cálice de fundação, base de pilares pré-moldados, interfaces rugosas, chaves de cisalhamento, colarinho
Design model and recommendations of column-foundation
connection through socket with rough interfaces
Modelo e recomendações de projeto da ligação
pilar-fundação por meio de cálice com interfaces rugosas
R. M. F. CANHA a [email protected]
G. M. CAMPOS b [email protected]
M. K. EL DEBS c [email protected]
a Departamento de Engenharia Civil, Centro de Ciências Exatas e Tecnologia – Universidade Federal de Sergipe, [email protected], Av. Marechal Rondon, s/n, Jardim Rosa Elze, CEP: 49100-000, São Cristóvão - SE, Brasil;
b Departamento de Engenharia de Estruturas, Escola de Engenharia de São Carlos – Universidade de São Paulo, [email protected], Av. Trabalhador SãoCarlense, 400, CEP: 13566-590, São Carlos - SP, Brasil;
c Departamento de Engenharia de Estruturas, Escola de Engenharia de São Carlos – Universidade de São Paulo, [email protected], Av. Trabalhador SãoCarlense, 400, CEP: 13566-590, São Carlos - SP, Brasil.
Received: 07 Oct 2011 • Accepted: 13 Dec 2011 • Available Online: 02 Apr 2012
Abstract
1. Introduction
The column-foundation connection through socket consists of em-bedding part of the precast column into the cavity of the foundation element. This connection is widely used in precast concrete struc-tures all over the world, being the most widespread in Brazil com-pared to other available types of column-foundation connections. This work presents a complementary analysis of the socket foun-dation initiated in Canha & El Debs [1], in which a critical analysis of available models and recommendations for socket are present -ed, and in Canha & El Debs [2], which proposes a design model for this element. These two abovementioned publications, however, are focused mainly on friction models for smooth socket founda-tion. More recently, Campos et al. [3] presented indications for the structural analysis of the column base in smooth interface sockets. The present work aims at presenting a complete structural analysis and detailing approach to precast column-socket connections with rough interfaces, including a coniguration of this type of interface with shear keys proposed by Canha [4], reined design models proposed by Campos [5] and recommendations for rough socket foundation of the latter author. Based on Campos [5], it is easy to
conirm that some questions relative to column-socket connection with rough interfaces, such as the column base, still remain un -solved. On the other hand, Canha [4] indicated that smooth socket model can be applied to the case of rough interfaces by simply ad -justing the friction coeficient to 1.0. This approach was adopted in the present work by adapting the model proposed by Campos et al. [3] to the rough column base. To complement the formulations and recommendations proposed, a new model is proposed for analysis and detailing the rough column base based on the monolithic be-havior of rough connections pointed out by Canha [4]. The results of two analysis models for column bases are then confronted.
2. Model and recommendations
for the design of rough socket
2.1 Rough interface coniguration
A socket foundation connection is deined as rough when shear keys, responsible by the load transfer between the column and socket, are executed in the internal socket walls and on the precast column along the embedment region. Besides the contribution of bond and friction,
Figure 1 – Model for determining the maximum shear strength (Rizkalla et al. [7])
sk
b = shear wall thickness
Friction force
due to shear
R
es
ul
tin
g
no
rm
al
fo
rc
e
q
c
V '
strut (2V ')
Force in
c
V '
a
V '
cc c
a
Pr
e-l
oa
d
V
Forces in
struts
V '
cj
Typical
strut
skV
h
Surface
slip
cos
A
pp
lie
d
no
rm
al
fo
rc
e
V
sk
q
j
cos
skh
jh
skThe Figure 2 presents the following parameters:
e
sk:
Distance between the shear key axese’
sk
:
Internal distance between shear keysh
sk:
Shear key heightl
sk
:
Largest shear key base dimensionl
’
sk:
Smallest shear key base dimensiona
sk:
Inclination of shear key face relative to a parallel line throughthe joint axis
l
sk:
Ratio of largest base dimension to height of shear keyq
sk:
Inclination of shear key face relative to a perpendicular line through the joint axis.The geometrical ratio of the shear key can be deined according to equation 2:
(2)
sksk sk
=
l
/
h
l
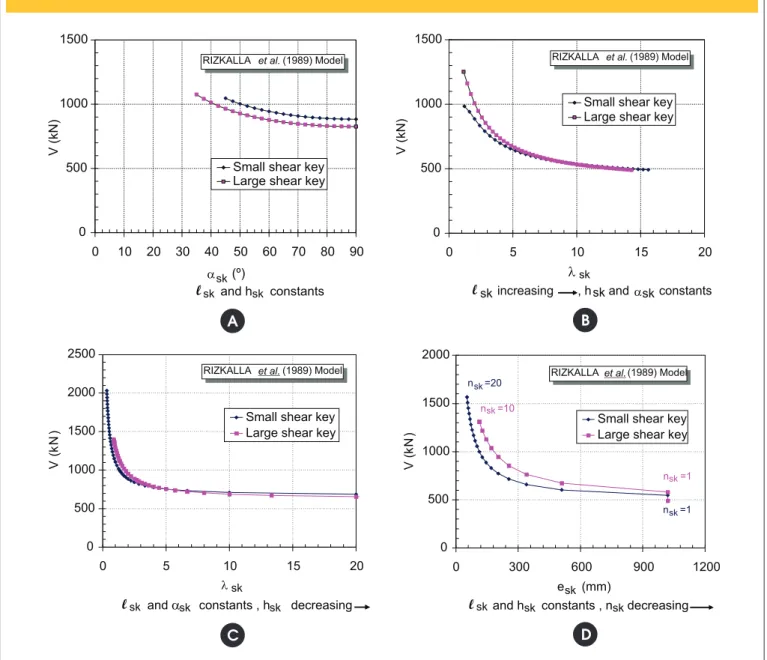
The main results obtained on applying the model proposed by Riz-kalla et al. [7] are presented in Figure 3.
Figure 3(a) shows an increase in shear strength as the face angle of shear key ask decreases up to the limiting value of ask, lim for which the smallest shear key base dimension
l
sk
’
is null. This value of ask, lim was found to be 45o and 35o for small and large shear keys,
re-spectively. It is worth pointing out that, according to Lacombe and Pommeret [8], when this angle is less than 45o, the failure of the
connection takes place by slipping between the shear keys. By increasing
l
sk and keeping the shear key height hsk and the
angle ask ixed, the value of lsk increases, thus resulting in an de-crease in shear strength as illustrated by Figure 3(b). Still relative to λsk, it is noticed that the strength decrease is more pronounced along the irst part of the curve up to the limiting value of lsk=6
indicated by Lacombe and Pommeret [8], and from this point, the strength is small and then tends to a constant value for large values of lsk. According to Figure 3(c), the increase in lsk as hsk decreases is also one of the reasons for the observed decrease in shear strength V.
By varying the number of shear keys nsk, the distance between
keys esk is observed to decrease as the number of shear keys in-creases, consequently resulting in an increase in shear strength V, as illustrated by Figure 3(d).
Based on the theoretical study of the Rizkalla et al. [7] model, it is expected that a geometrical ratio of the key
l
sk≤ 6
providesappropriate stress transfer at the column-pedestal wall inter-face. Adopting shear keys with angle
a
sk= 45
o
, internal spacing
e’
sk=
4cm
and the maximum ratiol
sk
= 6
to account forshear key symmetry on the reverse side of the interface, a suitable shear stress transfer occurs between the column and the socket.
The Brazilian Standard Code NBR 9062:2006 [6] recommends a minimum roughness of
h
sk=
1cm
for every 10 cm of joint in or-der to assure a monolithic behavior of the connection. However, it does not specify what distance this 10 cm of joint refers to. Hence, the 10 cm will be considered here to represent the sum of the larg -est shear key base dimensionl
sk and the internal spacing between
the shear keys
e’
sk, thus resulting to a single key for each joint length considered, as illustrated in Figure 4(a).For minimum shear key dimensions, it is recommended that the these keys provide an additional portion of the interface shear strength
on account of interlock mechanical fraction of the adherence. None-theless, besides those provided by NBR 9062:2006 [6], there are still no known speciic recommendations for the analysis of these keys which guarantee an appropriate transfer of load in rough connections. In order to substantiate the adopted shear key dimensions of the rough column-socket connection tested by Canha [4], the theoreti -cal model illustrated in Figure 1 proposed by Rizkalla et al [7] was used for the qualitative and systematic analysis of the geometric parameters of the shear keys. This model is commonly used for shear strength analysis of shear walls with shear keys and ixed together by dry mortar (“drypack”). The model was then adjusted with experimental tests carried out on specimens with smooth in -terface and with two shear key conigurations labeled small and large shear keys. Based on the observed post-cracking behavior of the specimens, the maximum shear load (V) of the connections with shear keys can be estimated according to equation 1. In this equation, the irst term represents the compressive strength of the concrete strut between diagonal cracks (
V
c) while the second term refers to the strength due to friction along the sliding surface (V
f ). The shear key geometrical parameters are given in Figure 2.(1)
(
n
sk1
)
f
crA
cssen
c(
nA
c(
n
sk1
)
f
crA
cscos
c)
V
=
-
a
+
m
s
-
-
a
Where:
n
sk is the number of shear keys
f
cr is the compressive strength of the cracked joint chj ch j 2 1
cs (h h )b /cos
A = + q is the average transverse section of the
diagonal section of the concrete strut
) h / ( tan1 ch j c= - l
a is the inclination of the diagonal section of the concrete strut relative to the horizontal.
Figure 2 – Shear key variables (Canha [4])
sk
a
sksk
sk
h
'
sk
q
4(a) referring to specimen IR1, and the other with dimensions a little less than the minimum values indicated in Figure 4(b) for specimen IR2.
Detailed experimental-theoretical studies of the socket foundation carried out by Canha [4] showed that the behavior of specimens with rough interfaces is similar to that of monolithic connections. The observed experimental strengths for the two tested specimens were veriied to agree closely. Besides, the specimen with small shear keys (IR2) was found to present a higher stiffness (relative to rebar strains) than the specimen with large shear keys (IR1), as shown in Figure 5. The abovementioned observation indicates that the modiication of shear key dimensions within the ranges indicated in Figure 4 does not inluence, except the connection stiffness, the connection strength.
largest shear key base dimension be twice the maximum size of the coarse aggregate and the shear key height be at least half the aggregate size, as illustrate in Figure 4(b), to guarantee that the coarse aggregate its into the shear key during the concrete placement. In the case of symmetrical keys, it is necessary to consider the maximum size of the coarse aggregate relative to the largest of the three “concretes” of the connection (socket, column and joint).
To define the roughness to be adopted in the specimens tested by Canha [4], the shear keys were manufactured ac-cording to the limits imposed by NBR 9062:2006 [6] and the results presented regarding the parametric evaluation with the Rizkalla et al. [7] model. Two shear key configurations were used, one with maximum dimensions shown in Figure
Figure 3 – Parametric evaluation of the shear keys using the model proposed by RIZKALLA et al. [7]
0 500 1000 1500
0 10 20 30 40 50 60 70 80 90
a (º)
V (kN)
Small shear key Large shear key
RIZKALLA et al. (1989) Model
l and h constantssksk sk
0 500 1000 1500
0 5 10 15 20
l
V (kN)
Small shear key Large shear key
RIZKALLA et al. (1989) Model
sk
l increasing , h and sk sk a constantssk
0 500 1000 1500 2000 2500
0 5 10 15 20
l
V
(k
N
) Small shear keyLarge shear key
RIZKALLA et al. (1989) Model
l and a constants , h decreasing sk
sk sk sk
0 500 1000 1500 2000
0 300 600 900 1200
e (mm)
V
(k
N
) Small shear keyLarge shear key
RIZKALLA et al. (1989) Model
n =10sk
n =20sk
n =1sk
n =1sk
sk
l and h constants , n decreasingsk sk sk
B
B
B
D
A
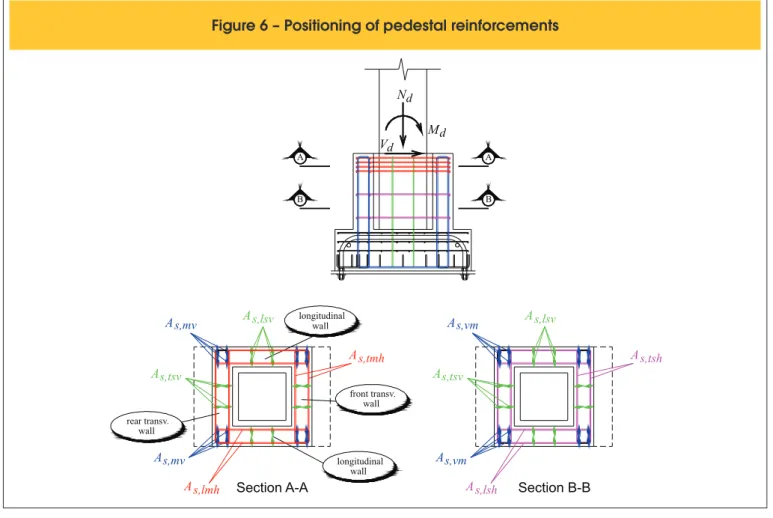
2.2 Main vertical reinforcement – A
s,mvThe main vertical reinforcement
A
s,mv is deined as that distributed along the corners of the longitudinal and transverse walls. Thisreinforcement, shown in Figure 6, has strength function on the ten-sion side of the connection, but is placed symmetrically at the cor -ners due to construction aspects.
Based on observation by Canha [4] that rough interface specimens
Figure 4 – (a) Maximum shear key dimensions with respect to
minimum roughness according to NBR 9062:2006 [6] and theoretical
evaluation according to Canha [4]; (b) Minimum shear key dimensions
as a function of aggregate dimension recommended by Canha [4]
e
'=
4
cm
6
cm
4
cm
10
cm
= 6
l
=
45
º
sk
h = 1 cm sk = 6
lsk
ask
sk
sk
=
6
cm
=
45
º
sk
h ask
sk
sk
f
2agf
ag2
e
'
f
agf
ag/2f
ag3
f
agBB
A
showed a similar behavior to that of monolithic connections, hence resulting in full transfer of the bending moments and normal loads from column to socket, it is recommended, for the case of rough in-terface sockets, to apply the bending theory for designing the main vertical reinforcement. Nonetheless, tests carried out by Jaguaribe Jr. [9] showed that the estimated connection strength based on the bending theory for reduced embedded lengths was higher than experimental strength values obtained from tested specimens. This indicated that the bending theory is applicable only to sockets with embedded lengths that meet the criteria given by the Brazilian Standard Code NBR 9062:2006 [6].
In this paper, a reined model for detailing the vertical reinforce-ments is presented, originally proposed by Canha [4], with addi-tional considerations and recommendations, as shown in Figure 7. For a more precise analysis, it is recommended take into account all vertical reinforcements contributing to the strength of the con -nection. Besides this, the rectangular-parabolic concrete compres -sion stress diagram should be adopted.
However, for practical applications, a simpliied analysis can be em-ployed. This approach assumes a simpliied diagram of concrete compression stress with height equal to 0.8 of the depth of the neutral axis and the resulting tensile force determined by the contribution of the main vertical reinforcements at the corners of rear wall and the secondary vertical reinforcements placed in this wall. Hence, the es -timated total reinforcement based on the bending theory is obtained from equation 3 and the reinforcement
A
s,mv is then calculated.(3)
tsv, s mv , s tot
,
s
2
A
A
A
=
×
+
The secondary reinforcements of rough interface sockets are de-signed considering the behavior of the longitudinal walls similar to that of short corbel. It is noted that, in the application of bending theory, the reinforcement
A
s,tsv is included in the calculation oftot , s
A
and it is equal to0.40.A
s,mv. This secondary reinforce-ment is important in socket foundation to resist secondary stresses and for crack control of the pedestal walls.Figure 7 shows the following parameters:
M
bd: Design bending moment at socket basecsf
R
: Resultant of concrete compressive stress of socket1 ssf ssf
R
R
=
: Resultant of forces in vertical reinforcements tsv, s mv ,
s A
A .
2 + at d1=dsf
ssfi
R
: Resultant of forces in secondary vertical reinforcementslsv , s
A
atd
i. In the case of secondary vertical reinforcement in two layers, for instance, there are the following parameters:2 ssf
R
: Resultant of forces in secondary vertical reinforcementslsv , s
A
atd
23 ssf
R
: Resultant of forces in secondary vertical reinforcementslsv , s
A
atd
3s
cd: Design concrete compressive stress of socketFigure 6 – Positioning of pedestal reinforcements
d
V
A A
As,tmh
As,lmh Section B-B
As,lsv As,vm
As,vm
As,tsv
As,tsh
As,lsh rear transv.
wall
longitudinal wall
front transv. wall
longitudinal wall
B B
Section A-A As,lsv As,mv
As,mv
As,tsv
d
N
d
X
sf: Depth of neutral axisFor a simpliied bending theory analysis, the force
R
ssf, resultant in the vertical reinforcements 2.As,mv+As,tsv, is determined accord-ing to the equation:(4)
sf ext w sf d bd yd tot ,sssf
A
f
M
N
z
z
0
5.
h
0
5.
h
R
=
×
=
-
×
+
×
-
×
Where:
emb d d bd M V l
M = + ×
sf sf
sf d 0.4 x
z = - ×
For practical application in the case of large eccentric normal forc-es, the parameters zsf@0.9×dsf and [email protected]×hext could be used.
The resultant of concrete compression stresses in the socket is estimated as:
(5)
(
)
sf w ext d bd d ssfcsf
R
N
M
N
0
.
z
5
h
0
.
5
h
R
=
+
=
+
×
×
-
×
Substituting zsf=dsf-0.4×xsf in equations 3 and 4, the resultants
ssf
R
andR
csf are calculated according to expressions 6 and 7, respectively, as:(6)
sf sf sf ext d bdssf
M
N
d
(
0
.
5
0
.
4
h
x
0
.
4
x
)
R
×
-×
-×
×
-=
(7)
(
)
sf sf w ext d bdcsf
M
N
d
0
.
5
0
.
4
h
x
0
.
5
h
R
×
-×
-×
×
+
=
Considering that the force
R
csf is the resultant of the compres-sive stressess
cd considered uniformly distributed on an area ofext sf h x 8 .
0 × × , for the rectangular compressive stress diagram, the force
R
csf results in:(8)
cd ext sf cd csfcsf
A
0
.
8
x
h
R
=
×
s
=
×
×
×
s
Figure 7 – Schematic representation of force for the determination of vertical
reinforcements in rough interface sockets according to Canha [4]
A A Section A-A csf R ssf1 R hw 2A of reinforcement s,mv+ As,tsv
As,lsv As,mv As,mv As,tsv ssf2 R ssf3 R d2 x 1
d = d N d M force resultant csf R ssf1 R 0.8x d ssf
R =
cd s Parabolic-rectangular diagram
of concrete stress
Substituting equations 6 and 8 in equation 5, the position of the neutral axis can be determined from equation 9, and subsequently
A
s,mv is determined.(9)
0
h
x
32
.0
d
h
x
8.
0
d
N
h
N
5.
0
M
bd-
×
d×
ext+
d×
sf-
×
sf×
exts×
cd×
sf+
×
sf2×
exts×
cd=
If the simpliied rectangular concrete compressive stress diagram is adopted, it results, for the socket, a constant compressive stress of
cd cd=0.85×f
s along a depth of 0.8×xsf measured from the compression face, referred to compressed zone of constant height. For the remaining height of 0.2×xsf, the compressive stresses in concrete is neglected.
2.3 Main horizontal reinforcements
The main horizontal reinforcement consists of the main trans-verse horizontal reinforcement, As,tmh and the main longitudinal
horizontal reinforcement, As,lmh. As,tmh is the reinforcement
distrib-uted along the top of the transverse walls within a distance of
l
emb/3 from the top while As,lmh is that distributed along the top
of the longitudinal walls within l
emb/3. Since the reinforcements lmh
, s
A
andA
s,tmh are distributed within the same height of the rough socket, and considering the positioning of the rebars in the socket at the construction, it is recommended, when design-ing socket connections, to adopt the largest reinforcement areaFigure 8 – Transfer of forces resultants from column to rough socket (adapted from Canha et al. [10])
l
embh c R s R N M V csf R
Transfer of forces resultants from column to socket foundation
b b hext As zsf topf p topr p ssf R d p topr em b wall Rear transverse
l
/2 topr pH Htopf
em b
l
/3 ptopfl
3/ em b wall Front transverse em bl
Hr f H topf p ' p 'toprem b /3
l
z s,mv2A +As,tsv
Pressures rear wall resultant on Variable inclination Variable inclination front wall Pressures resultant on r H f H ssf R csf R f p r b bf topr
H Htopf
l
emb/3 d d d Hr f H
with the reinforcement arranged symmetrically. Figure 6 shows the positioning of these reinforcements.
2.3.1 Main transverse horizontal reinforcement – As,tmh
Canha et al. [10] proposes a model for the analysis of transverse walls of sockets with smooth and rough interfaces, based on the ex -perimental results of Canha [4] and Jaguaribe Jr. [9]. Following the experimental results of Nunes [11] obtained from the behavior of the transverse walls, a reined Canha et al. [10] model presented herein was obtained. Figure 8 presents the stress transfer model from col -umn to socket with rough interfaces, based on Canha et al. [10]. In this model, compression struts appear on the compressed side (front transverse wall) due to the transfer of the compression resultant
R
cfrom the column to the front wall, thus resulting in a force
R
csf in the socket foundation. Due to the presence of these compression struts, a pressure resultantH
f is observed to act on the front transverse wall. This pressure attains its maximum value at the top of the front transverse wall due to the smaller inclinations of the struts with respect to a horizontal axis through the top of this wall. Since these struts are practically vertical near the socket base, the pressure at this point is null. This forceH
f can determined using equation 10 below:(10)
fcsf f
tan
R
H
where:
f
β
: average struts inclination on the compression side.csf
R
: Compression force resultant in the socket determined from equation 5.On the compression side of the column, the pressures distribution is similar to that of the front wall. Hence, the pressures at the top of the column and of the front wall are the same:
(11)
topf topf
'
p
p
=
The pressure resultant
H
topf is thus equal to the resultant of the trapezoidal pressure block acting at the top of the front transverse wall. This means thatH
topf is a portion ofH
fand is determined according to equation 12:(12)
ftopf
0
,
6
H
H
@
×
On the tension side (rear transverse wall), the transfer by compres -sion struts of most of the ten-sion force
R
s, from the column to the rear wall, results in the tension forceR
ssf in the socket and in thepressure
H
r on the rear wall. It can be noticed that the pressureH
r is concentrated mostly at the top of the wall due to the smaller inclina-tion of the compression struts in this region relative to the horizontal axis, and the base of the rear transverse wall does not transmit forces. The pressureH
r is determined by equation 13 as:(13)
r ssf r
tan
R
H
b
=
where:
r
β
: average compression struts inclination on the tension side.ssf
R
: Force resultant in the vertical reinforcements 2.As,mv+As,tsv calculated by equation 4.In case of the tensile side of the column, the compression struts are known to initiate at the bottom of the column. Because of this, the triangular pressure distribution occurs all over the tensioned column base with length l
emb, such that the pressure at the column top is half of that acting on the rear wall:
(14)
2
p
'
p
topr=
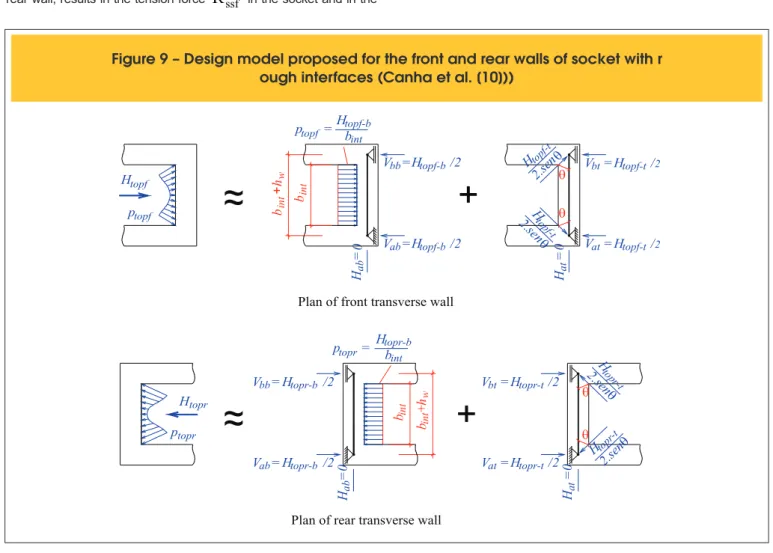
toprFigure 9 – Design model proposed for the front and rear walls of socket with r
ough interfaces (Canha et al. [10]))
V =ab H /2
topf-t
V =bt H /2
topf-t
V =at H /2
H
=
ab
0
q topf
Plan of front transverse wall
Plan of rear transverse wall
topf
p
topf
H
topr
p
topr
H
topf-b
V =bb H /2
~~
~~
+
topr-b
V =bb H /2
topr-b
V =ab H /2
H
=
ab
0
topr-b
H
int
b
in
t
b
w
+h
in
t
b
p =topr
topr-t
V =bt H /2
topr-t
V =at H /2
H
=
at
0
q q topr-t
H 2.senq
topr-t
H 2.sen
q
H
=
at
0
topf-t
H 2.sen
topf-t H 2.sen
q topf-b
H
int
b
+
in
t
b
w
+
p =
h
in
t
b
q
The pressure resultant
H
topr on the upper third of the rear trans-verse wall is approximately equal to the pressureH
r distributed on the upper half of that wall.Experimental results conirmed that the upper part of the front and rear transverse walls of rough sockets were subjected to combined bending and tension, with the predominance of tension. This be-havior under bending-tension was observed from obtained rein -forcement strains and cracks coniguration of the transverse walls. Hence, the proposed analysis model presented in Figure 9, based on the experimental investigation, consists of representing the top of transverse walls as a simply supported beam with the distrib -uted pressure given by two parts: a pressure Htopf-b and Htopr-b which causes bending of the beam, and a pressure Htopf-t and Htopr-t that is
transmitted to the beam supports at an angle of θ=45º, represent-ing the average crack inclination of the tested specimens, causrepresent-ing tension of the beam. The total upper pressure on the front wall
topf
H
and on the rear wallH
topr is the sum of the portions referring to bending and tension.Based on the obtained strain gauge results, the percentages adopted for the case of bending- tension was 15% for pressures
H
topf−band
H
topr−b, and 85% for pressuresH
topf−t andH
topr−t . Besides these percentages, only the tension force, for whicht topf topf
H
H
=
− andH
topr=
H
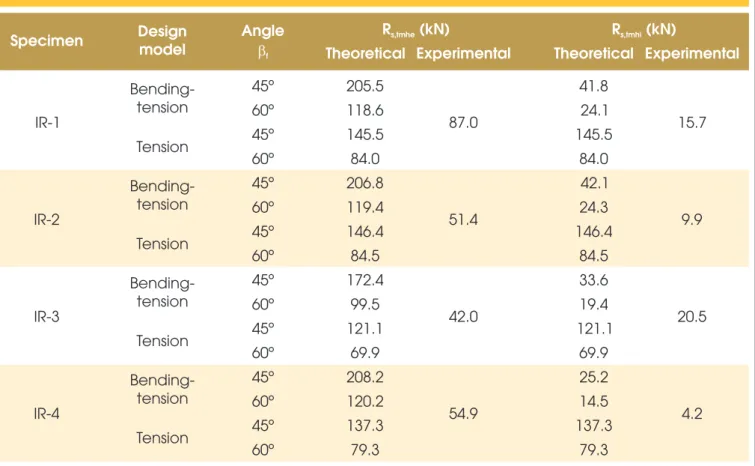
topr−t, can be considered. Concerning the average inclination of the compression struts of theTable 1 – Theoretical and experimental internal forces in reinforcement A
s,tmhwith varying angles of
β
ffor the front transverse wall of rough interface sockets
Specimen
Design
model
Angle
b
f
R
s,tmhe(kN)
R
s,tmhi(kN)
Theoretical Experimental
Theoretical
Experimental
IR-1
Bending-tension
45º
205.5
87.0
41.8
15.7
60º
118.6
24.1
Tension
45º
145.5
145.5
60º
84.0
84.0
IR-2
Bending-tension
45º
206.8
51.4
42.1
9.9
60º
119.4
24.3
Tension
45º
146.4
146.4
60º
84.5
84.5
IR-3
Bending-tension
45º
172.4
42.0
33.6
20.5
60º
99.5
19.4
Tension
45º
121.1
121.1
60º
69.9
69.9
IR-4
Bending-tension
45º
208.2
54.9
25.2
4.2
60º
120.2
14.5
Tension
45º
137.3
137.3
60º
79.3
79.3
walls, Canha et al. [10] indicates a value of 45º for
β
f andβ
r. However, it is noticed that, in some cases, with these inclination an -gles, the theoretical results did not represent well the experimental results. Because of this, an analysis with the variation of the average inclinations of the compression struts in the front and rear transverse walls was developed. The obtained results were then complement -ed with experimental results of Nunes [11]. For the angleβ
f, the values of 45º and 60º were compared, and forβ
r, the values of 45º and 35º.An analysis and comparative study of the experimental and theo -retical results was carried out for specimens IR-1 and IR-2 tested by Canha [4], for IR-3 by Jaguaribe Jr. [9] and for IR-4 by Nunes [11]. Table 1 presents the results of the force in the reinforcement
tmh , s
A
with variation inβ
f of the front transverse wall.Analyzing the results, for all cases when
b
f=
60
o was con-sidered, the obtained theoretical and experimental forces showed close agreement. For instance, for specimen IR-2, considering the bending-tension and an angle of 60º, the difference between the theoretical and experimental force was found to be approximately 132%, compared to approximately 300% when a strut inclination of 45º was taken into account.had been tested by Jaguaribe Jr. [9] with a reduced embedded length and consequently the observed deviation of the experimental results was due mainly to this factor. On the other hand, considering only tension and an angle of 60º for specimen IR-1, the obtained theoretical force in the external branch was found to be approximately 3.5% below the experi -mental result. In determining the experi-mental values, however, a modu-lus of elasticityof 210 GPa for the reinforcement steel was adopted even though it may be slightly lower, thus making up for this small difference. A general analysis showed that the theoretical model which best represents the experimental results is that corresponding to an av-erage strut inclination of 60º on the compression side of the socket foundation. Based on this, a strut angle of 60º will be adopted in the present study.
Although the observed percentage differences are large, it is important to highlight here that the two other models cited in the literature for analysis of the front transverse wall were found to result in much higher differences compared to experimental results. Table 2 compares the experimental results with those of the proposed model, Melo [12] and CNR 10025:1998 [13] mod-els. The bending theory based model by Melo [12] considers the upper part of front transverse wall as a beam on two ixed sup-ports and subjected to bending moments, with resulting plastic bending moments at the extremities. The tension model given in CNR 10025:1998 [13,] however, recommends the application of a strut and tie model to the upper part of front transverse wall considering only the existence of tensile stresses in this re
-CNR 10025:1998 [13]
668.9
668.9
Table 2 – Comparison between the proposed model and that given
by Melo [12] and CNR 10025:1998 [13]
Specimen
Design model
R
s,tmhe(kN)
R
s,tmhi(kN)
Theoretica l
Experimental
Theoretica l
Experimental
IR-1
Bending-
tension
118.6
87.0
24.1
15.7
Tension
Proposed
b
f= 60º
Proposed
b
f= 60º
Proposed
b
f= 60º
Proposed
b
f= 60º
84.0
84.0
Melo [12]
542.7
542.7
CNR 10025:1998 [13]
686.9
686.9
IR-2
Bending-
tension
119.4
51.4
24.3
9.9
Tension
84.5
84.5
Melo [12]
546.3
546.3
CNR 10025:1998 [13]
691.4
691.4
IR-3
Bending-
tension
99.5
42.0
19.4
20.5
Tension
69.9
69.9
Melo [12]
558.1
558.1
CNR 10025:1998 [13]
717.0
717.0
IR-4
Bending-
tension
120.2
54.9
14.5
4.2
Tension
79.3
79.3
gion. Table 3 presents the resulting forces in the reinforcement
tmh , s
A
according to the variation ofβ
r of the rear transverse wall.An analysis of Table 3 indicates that the compression struts incli-nations on the tension side of the socket (rear wall) are smaller than those of the compression struts on the compression side (front wall). Hence, for this wall, angles of 35o and 45o were
ad-opted in this study. The rear transverse wall was instrumented only in specimens IR-3 and IR-4. Table 3 shows the data for these two sockets.
As it can be perceived, for the two specimens under bending-tension condition, and considering an angle of 45o, the obtained
theoretical forces in the internal branch of the reinforcement were smaller than the observed experimental values, hence this strut angle is not recommended to consider. If an angle of 35o is
consid-ered, the veriication of forces for specimen IR-4 is not neglected. The theoretical force in specimen IR-3 was found to be slightly smaller that the observed experimental value, but as it can be re-called, this specimen had a reduced embedded length.
Notwithstanding the few experimental results available, it is recom-mended that a value of o
r=35
b be adopted, because considering this situation, the theoretical force is higher than the experimental value. A strut angle of 30o was not considered since the
corre-sponding results for this situation would be very conservative rela-tive to tension or more still, would not meet safety conditions for the case of bending-tension.
It is worth emphasizing that in the knowledge of the authors, this formulation is currently the only model available for analyzing the rear transverse wall.
2.3.2 Main longitudinal horizontal reinforcement – As,lmh As indicated in Figure 6, the reinforcement
A
s,lmh located on the upper part of the longitudinal walls of the rough socket must be determined considering the effect of the pressuresH
topf andtopr
H
acting on the transverse walls of the socket.The main horizontal reinforcement is made up of two branches:
Table 3 – Theoretical and experimental internal forces in reinforcement A
s,tmhwith varying angles o
β
rfor the rear transverse wall of rough interface sockets
Specimen
Design
model
Angle
b
rR
s,tmhe(kN)
R
s,tmhi(kN)
Theoretical Experimental
Theoretical Experimental
IR-3
Bending-
tension
45º
159.90
31.20
35º
228.40
44.50
Tension
45º
112.40
112.40
35º
160.50
160.50
IR-4
Bending-
tension
45º
199.60
24.10
35º
285.10
34.50
Tension
45º
131.60
131.60
35º
188.00
188.00
100.30
101.30
46.50
33.80
external and internal branch, and must be distributed in the upper part of the socket within a height of l
emb/3.
After determining the pressures acting on the transverse walls, it is recommended to estimate the resulting steel area based on the pressure on the front and rear walls. An estimate of this reinforce -ment is carried out following equations 15 and 16, and the adopted
lmh , s
A
is the highest of the obtained values.(15)
yd topf lmh
,
s
2
f
H
A
×
=
(16)
ydtopr lmh
,
s
2
H
f
A
=
×
2.4 Secondary reinforcements – A
s,svand A
s,shFigure 6 illustrates the positioning of the secondary vertical rein -forcement As,sv and the secondary horizontal reinforcement As,sh. These secondary reinforcements are used in socket foundation to resist secondary stresses and for cracking control of pedestal walls. It is noteworthy that the secondary horizontal reinforcements used in the front wall play the important role of absorbing the pres-sures within two lower thirds of these wall (2l
emb/3).
For calculation of the secondary reinforcements of socket with rough interfaces, it is recommended to apply the short corbel the -ory for the longitudinal walls, respecting the following areas and spacings indicated in El Debs [14]:
n For secondary vertical reinforcement: mv , s lsv
, s tsv , s sv ,
s A A 0,40A
A = = ³ ×
n For secondary horizontal reinforcement: mv
, s lsh
, s tsh , s sh ,
s A A 0,25A
For both vertical and horizontal secondary reinforcements, a spac-ing s between 150 mm and 300 mm must be adopted.
3. Model and recommendations for
the design of rough column bases
3.1 Proposed model based on monolithic behavior
Although the experimental investigation carried by Canha [4] was focused mainly on pedestal walls, the observed monolithic behav -ior of rough interface connections indicates that detailing of the column base obeys the same bending theory.
As mentioned previously, based on the experimental results ob-tained by Nunes [11], it was possible to reine the model describing the transfer of load from the column to socket originally proposed by Canha et al. [10].
Figure 10 – Design model proposed for the rough column base
With the model calibrated for socket foundations, the forces acting on the column can be obtained, resulting in the proposed model shown in Figure 10.
The rough column base is subjected to Hf and Hr on the sides
refer-ring to the front and reartransverse walls, respectively, resulting from the transfer through struts of the internal compression and tension forces to these walls as presented in item 2.3.1.
Also, at the column bottom, there is the internal transverse force Vcb and the internal eccentric normal force Ncb.
The problem thus involves four unknowns (tM, tN, Vcb and Ncb). Be -sides the three static equilibrium equations, there is an additional equation related to the normal reaction
N
cb at the column bottom.This force is considered as the
N
d reduced by ratio of the column cross sectionA
c to the external surface area of the pedestalA
cp,according to the following equation:
(17)
cp c d
cb
N
A
A
N
=
Based on the structural outline of this element, the diagrams of the internal forces were determined with the corresponding expres-sions given below.
Considering a pressures variation along the embedded length
l
emb,
for practical applications, the column transverse reinforcement area is determined for maximum internal forces.
Hence the
p
topf'
andp
topr'
values are given, respectively, by equations 18 and 19:(18)
f emb csf emb ftopf
'
2
H
2
R
tan
p
b
×
×
=
×
=
l
l
(19)
r emb ssf emb rtopr
'
2
H
2
R
tan
p
b
×
×
=
×
=
l
l
The shear force
V
cb at the column bottom and the shear stresstN are determined from the equilibrium equations of forces in the horizontal and vertical directions and are given, respectively, by:
(20)
fr d
cb
V
H
H
V
=
+
-(21)
embcb d N
=
(
2
h
N
+
2
-
b
)
N
×
l
t
From the moment equilibrium relative to point O, the shear stress tM can be deined by equation 22:
(22)
(
)
2
h
b
h
e
N
H
H
3
2
V
M
2 emb nb cb f r d emb d M+
×
×
-+
+
=
t
l
l
The internal forces along the column base are calculated from the three static equilibrium equations in plane.
The bending moment
M
y acting at a given distancey
from the column bottom is calculated by the following equation:(23)
(
)
32 emb f r f r emb d nb cb nb cb y
y
3
H
H
y
3
H
H
M
e
N
e
N
M
l
l
-×÷÷
ø
ö
çç
è
æ
-+
-×
+
×
-=
Also, the shear force
V
y at a given distancey
from the column bottom is given by:(24)
(
)
22 emb f r f r d
y
V
H
H
H
H
y
V
l
-+
=
The internal normal force
N
y at a given distancey
from the col-umn bottom is:(25)
y
N
N
N
N
emb d cb cby
÷÷
×
ø
ö
çç
è
æ
-+
-=
l
The Bending Moment Diagram has a cubic shape. The absolute maximum value
M
max at the column top and absolute minimum valueM
min at the column bottom are given, respectively, by:(26)
d
max
M
M
=
-(27)
nb cb
min
N
e
M
=
-
×
On the other hand, a parabolic diagram is adopted for the Shear Force Diagram with the maximum value
V
max at the column bot -tom and the minimum valueV
min at the column top are calcu-lated, respectively, by:(28)
fr d
max
V
H
H
V
=
+
-(29)
d
min
V
V
=
value
N
min at the column bottom, given, respectively, by:(30)
dmax
N
N
=
-(31)
cpc d min
N
A
A
N
=
-To determine the column longitudinal reinforcement, the largest values of the bending moment and the normal force acting at the section of column top are considered. For the transverse reinforce -ment, the column bottom section, where the maximum shear force is found to act, must be used. The determination of this reinforce -ment must consider shear concrete strength.
Besides determining the column reinforcements, whichever analy -sis model is employed, it is recommended that the column longi-tudinal reinforcement be properly anchored to the column base, and the vertical reinforcement of rear transverse wall be detailed by over lapping the reinforcement, in order to transfer the tensile force of column in proper form to the rear wall. Experimental results obtained from specimens tested by Canha [4] and Jaguaribe Jr. [9] conirm that for adequate transfer of force from the column to the socket, the minimum embedded length for column-socket founda -tion elements with rough interfaces must meet the NBR-9062:2006 [6] requirements.
Figure 11 – Adapted design model proposed for analysis of the precast column base (Campos et al. [3])
As for smooth interfaces, the determination of the anchored length of the column longitudinal reinforcement is given by equation 32 based on recommendations by Leonhardt and Mönnig [15]. The stress transferred from reinforcement to concrete from this point of anchorage was conirmed experimentally for smooth specimens by Ebeling [16] and extrapolated here for rough specimens.
(32)
2
emb
anc
l
l
=
3.2 Adaptation of model considering friction forces
Campos et al. [3] proposes a strut-and-tie model applicable to the analysis of smooth precast column base, which was based on ex-perimental results of Ebeling [16]. This model was adjusted with that proposed by Canha [4] for the design of smooth interface sockets con-sidering the strength of concrete in the determination of internal forces and subsequently in calculating the transverse reinforcement. The adjusted model with the proposed modiications is given in Figure 11. The pressure on the front transverse wall Htopf, the pressure on the
rear transverse wall Hbot, and the normal reaction on the foundation base Nfb, deined by the equilibrium equations, are given, respec-tively, by equations 33, 34 and 35:
(33)
a
×
+m
÷÷
ø
ö
çç
è
æ
a
×
+
+
-+
m+
m
×
+÷÷
ø
ö
çç
è
æ
+
-m+
m
×
+
+
-=
tg
2
tg
2
e
h5.
0
d
y
1
V
e
h5.
0
d
e
1
N
e
h5.
0
d
M
H
2 nbd nb nb 2 2 d nb d
(34)
2 d d topf
bot
H
1
N
V
H
m
+
+
×
m
-=
(35)
2 d d
fb
N
1
V
N
m
+
×
m
-=
This model is indicated for sockets subjected to normal forces with high eccentricity and with embedded lengths based on NBR 9062:2006 [6] recommendations.
Canha [4] conirms that the design of socket foundations consider -ing friction forces wherein the friction coeficient m is adjusted to 1 was in the safe sidefor rough interface specimens, in spite of its being more conservative than the bending theory. Thus, the model for smooth column base was applied to rough column base analysis, considering m =1, as a base for comparison with model proposed for rough column based on monolithic behavior.
3.3 Analysis of column base
To investigate the proposed model for column base, four column sections were considered based on practical observations of pre-cast concrete structures commonly used. Two rectangular and two square sections were adopted; the irst section being a 40x40 cm2 column section. These dimensions were chosen with the belief that it is the smallest column size used in precast concrete structures. A normal force was assumed and the corresponding bending mo -ment was calculated following equation 36 for a high eccentricity.
(36)
2
h
N
M
dd×
³
From the applied load on the section, the coeficients
ν
andm
' were calculated according to equations 37 and 38, respectively. Fixing these two coeficients, the internal axial force and bending moment at any other section could be determined.(37)
cd c
d
f
A
N
×
=
n
(38)
cdc d '
f
h
A
M
×
×
=
m
The shear force was determined through a linear ratio with the bending moment, considering the acting of concentrated force. The sections and their respective loads are presented in Table 4. The following material and construction variables were assumed in the design of the rough column:
a) Embedded length for rough interfaces and high eccentric-ity was based on recommendations by NBR 9062:2006[6]:
h 6 . 1 emb= ×
l ;
b) Joint width of 5 cm;
c) Pedestal wall thickness:
h
w³
1
/
3
.
5
×
(
h
intor
b
int)
. This is anintermediary value between the minimum recommended by Campos [5] and that indicated by Leonhardt and Mönnig [15]; d) Steel CA-50 (fyk =500 MPa and fyd =435 MPa) for lon
-gitudinal reinforcement and steel CA-60 (fyk =600 MPa and
MPa 522
fyd= ) for transverse reinforcement;
e) Characteristic compression strength of the socket and column concretes:
f
ck=
20
MPa
andf
ck=
30
MPa
, respectively, andγ
c=
1
,
4
.The formulation proposed in this work assumed a monolithic con-nection. The obtained results were then compared with the model proposed by Campos et al. [3] adapted for rough interfaces. The geometrical characteristics, internal forces and resulting reinforce-ments for each section analyzed are presented in Table 5. Regarding the longitudinal reinforcement As, the proposed model for
rough column base provided values smaller than those obtained from Campos et al. [3] model adapted for rough interfaces. The observed difference is 27% for all cases. Theoretically, no transverse reinforce -ment would be necessary for the 40x40 cm2 and 60x40 cm2 sections based on the proposed model. For the 40x60 cm2 and 60x60 cm2 sections, the transverse reinforcements determined according to the proposed model were found to be higher than those obtained from the adapted model for rough interfaces, with the differences up to 28%. The transverse reinforcements obtained from both the proposed mod -el and that adapted for rough interfaces are smaller than the minimum transverse reinforcement recommended by NBR 6118:2007 [17], thus indicating, in this case, the use of minimum reinforcement.
4. Final remarks and conclusions
In this paper, models and design recommendations for the analy-sis of column-foundation connection through socket with rough
Table 4 – Column cross section
dimensions and loads
Column
section
bxh
2(cm )
Axial Force
N (kN)
dShear Force
V (kN)
dBending
Moment
M (kN.m)
d40x40
250
50
200
40x60
375
112.5
450
60x40
375
75
300
Table 5 – Obtained results for rough interface column base
Variables
Column Dimensions (cm )
240x40
40x60
60x40
60x60
b (cm)
int50
50
70
70
h (cm)
int50
70
50
70
h (cm)
w15
20
20
20
b (cm)
ext80
90
110
110
h (cm)
ext80
110
90
110
l (cm)
emb64
96
64
96
l (cm)
p63
95
63
95
Proposed Model
b
f60º
60º
60º
60º
b
r35º
35º
35º
35º
R (kN)
csf483.41
815.66
657.41
1222.22
R (kN)
ssf233.41
440.66
282.41
662.22
H (kN)
f279.10
470.92
379.55
705.65
H (kN)
r333.34
629.32
403.32
945.75
M (kN.m)
max200.00
450.00
300.00
675.00
N (kN)
max250.00
375.00
375.00
560.00
V (kN)
max104.25
270.90
98.77
408.85
2
A (cm )
s1099.92
1608.99
1649.89
2416.21
A (cm)
sw/s-
0.272
-
0.417
A
swmin/s(cm)
0.444
0.444
0.666
0.666
Campos et al. [3] model adapted for rough interfaces (
m
= 1)
H (kN)
topf312.40
499.43
468.61
749.02
H (kN)
bot162.40
255.68
243.61
384.65
N (kN)
fb100.00
131.25
150.00
195.63
F (kN)
1660.00
963.21
990.00
1445.71
F (kN)
4162.40
255.68
243.61
384.65
2
A (cm )
s1518.00
2215.39
2277.00
3325.14
A (cm)
sw/s0.195
0.215
0.292
0.327
interfaces are proposed, contemplating the coniguration of the shear keys, the socket and the column base.
After analysis of the theoretical and experimental results, the fol -lowing conclusions were drawn:
a) For a rough socket foundation to show a behavior similar to that of a monolithic connection, it is necessary that the shear keys dimensions be within the limits recommended in the pres -ent work.
b) The design of the vertical reinforcement of rough sockets must be based on the bending theory.
c) The horizontal reinforcement of the transverse walls should be designed following the reined model by Canha et al. [10], adjusting the values of o
f
=
60
b
andb
r=
35
o to better repre -sent the experimental results.d) The new model proposed for analysis of rough column base, calibrated from the socket foundation, was found to present less conservative longitudinal reinforcement compared to the model proposed by Campos et al. [3] and adapted for rough interfaces. The two models were found to provide minimum transverse reinforcement.
It is worth highlighting that the models proposed in this work are valid only for rough interface connections in which the embed-ded length is determined by the Brazilian Standard Code NBR 9062:2006 [6] and for cases of high eccentricity, keeping in mind that these models were based in experimental observations of specimens within these situations.
5. Acknowledgements
The authors would like to acknowledge CAPES for the inancial support through scholarships for the Master’s degree of the irst author and Post-Doctorate of the second author, FAPESP for the support for the thematic project “Nucleation and increment of re -search, innovation, and diffusion in precast concrete and mixed structures for the civil construction modernization” (proc. 05/53141-4) and CNPq for productivity scholarship in research of the irst and third authors.
6. References
[01] CANHA, R.M.F.; EL DEBS, M.K. Critical analysis of models and recommendations for designing
column-base connection by socket of precast concrete structures. IBRACON Structural Journal, v.2, n.2, p.116-136, June. 2006.
[02] CANHA, R.M.F.; EL DEBS, M.K. Proposal of design model for column-base connection by socket of precast concrete structures. IBRACON Structural Journal, v.2, n.2, p.152-166, June. 2006.
[03] CAMPOS, G.M.; CANHA, R.M.F.; EL DEBS, M.K. Design of precast columns bases embedded in socket foundations with smooth interfaces. IBRACON Structures and Materials Journal, v.4, n.2, p.314-323, June. 2011.
[04] CANHA, R.M.F. Theoretical-experimental analysis of column-foundation connection through socket of precast concrete structures. São Carlos. 279p. PhD Thesis. School of Engineering of São Carlos, University of São Paulo, 2004.
[05] CAMPOS, G.M. Recommendations for the design of socket foundations. São Carlos. 183p. MSc Thesis. School of Engineering of São Carlos, University of São Paulo, 2010.
[06] BRAZILIAN ASSOCIATION OF TECHNICAL
STANDARDS. NBR 9062 - Design and fabrication of precast concrete structures. Rio de Janeiro, ABNT. 2006.
[07] RIZKALLA, S.H.; SERRETE, R.L.; HEUVEL, J.S.; ATTIOGBE, E.K. Multiple shear key connections for precast shear wall panels. PCI Journal, v.34, n.2, p.104-120, Mar/Apr. 1989.
[08] LACOMBE, G.; POMMERET, M. Les joints structuraux dans les constructions en grands panneaux
prefabriques. Annales de L’Institut Technique du Batiment et dês Travaux Publics, n.314, p.114-144, Fevrier. 1974.
[09] JAGUARIBE JR., K.B. Column-foundation connection through socket of precast concrete structures with reduced embedded length. São Carlos. 167p. MSc Thesis. School of Engineering of São Carlos, University of São Paulo, 2005.
[10] CANHA, R.M.F.; EBELING, E. B.; EL DEBS, A. L. H. C; EL DEBS, M. K. Analysis of the behavior of transverse walls of socket base connections. Engineering Structures, v.31, n.3, p.788-798, Mar. 2009.
[11] NUNES, V.C.P. Experimental analysis of socket foundation emphasizing the internal forces in the pedestal transverse walls. São Carlos. 132p. MSc Thesis. School of Engineering of São Carlos, University of São Paulo,, 2009.
[12] MELLO, C.E.E. (Ed.) MUNTE design handbook of precast concrete. São Paulo: Pini, 2004.
[13] CONSIGLIO NAZIONALE DELLE RICERCHE. CNR-10025 - Istruzioni per il progetto, l´esecuzione ed il controllo delle strutture prefabbricate in calcestruzzo. ITEC/La prefabricazione. Roma, 1998. [14] EL DEBS, M.K. Precast concrete: bases and
applications. 1.ed. São Carlos, SP, Publicação EESC-USP. 2000.
[15] LEONHARDT, F.; MÖNNIG, E. Vorlesungen uber massivbau, Berlin:. Springer-Verlag, 1973. (Portuguese version: Construções de concreto: Princípios básicos sobre armação de estruturas de concreto armado, Rio de Janeiro: Interciência, 1.ed, v.3,. 1977.)
[16] EBELING, E. B. Analysis of precast columns base in the connection with socket foundation. São Carlos. 103p. MSc Thesis. School of Engineering of São Carlos, University of São Paulo, 2006.
![Figure 1 – Model for determining the maximum shear strength (Rizkalla et al. [7])](https://thumb-eu.123doks.com/thumbv2/123dok_br/18859999.417768/2.892.66.829.553.1139/figure-model-determining-maximum-shear-strength-rizkalla-et.webp)
![Figure 2 – Shear key variables (Canha [4])](https://thumb-eu.123doks.com/thumbv2/123dok_br/18859999.417768/3.892.62.435.190.558/figure-shear-key-variables-canha.webp)
![Figure 5 – Applied load-main vertical reinforcement strain curve (Canha [4])](https://thumb-eu.123doks.com/thumbv2/123dok_br/18859999.417768/5.892.60.839.791.1143/figure-applied-load-vertical-reinforcement-strain-curve-canha.webp)
![Figure 7 – Schematic representation of force for the determination of vertical reinforcements in rough interface sockets according to Canha [4]](https://thumb-eu.123doks.com/thumbv2/123dok_br/18859999.417768/7.892.65.828.236.708/figure-schematic-representation-determination-vertical-reinforcements-interface-according.webp)
![Table 2 – Comparison between the proposed model and that given by Melo [12] and CNR 10025:1998 [13]](https://thumb-eu.123doks.com/thumbv2/123dok_br/18859999.417768/11.892.71.823.419.1141/table-comparison-proposed-model-given-melo-cnr.webp)
