A Work Project, presented as part of the requirements for the Award of a Master Degree in Economics from the NOVA – School of Business and Economics.
A SURVIVAL ANALYSIS OF PORTUGUESE FIRMS
MÓNICA BORGES SIMÕES no 798
A Project carried out on the Master in Economics Program, under the supervision of: Professor Paulo M. M. Rodrigues
A SURVIVAL ANALYSIS OF PORTUGUESE FIRMS
Abstract
This paper uses firm level data for Portugal and analyses the impact of financial ratios on the probability of exit. While controlling for financial effects, the relationship between export activity and exit was also studied. Different indicators for export performance were used. The results indicate that financial factors - leverage, profitability and collateral - are relevant to survival. They also indicate that firms that export have a lower hazard ratio but if they become unsuccessful and exit the export market they will have a higher probability of exit when compared to continuous exporters, continuous non-exporters and starters/switcher.
Key words: survival, financial-constraints, exports, exiters
Acknowledgements:
I would like to thank my advisor, Professor Paulo Rodrigues, for all the help and advice he has given me over the past months and for his dedication to the project. I would also like to express my gratitude to BPlim, for giving me access to the data used in this work and for all their support, to the department of Research and Economics Studies of Banco de Portugal, for their hospitality. They were essential to make the project possible. I also thank Pedro Portugal, Hugo Reis and Luciana Barbosa for all their advice. Finally, I would like to thank my family and my friends for all their patience and encouragement.
1. Introduction
During recessions firms may experience lower revenues and might require external funding to survive, especially if they depend solely on domestic demand. Furthermore, credit supply is expected to contract in such periods, the reduction can be severe in the case a banking crisis is also present. Therefore, banks may not provide the funding firms need to comply with debt payments and survive, forcing them to exit the market. This situation is particularly relevant if the bond’s market is insufficiently developed and banks are the only source of funding available to firms. It is therefore relevant to study if in Portugal financial constraints influenced the decision of firms to exit and if exports played a relevant role in the probability of survival.
The relation between borrowing constraints and firm dynamics, in particular survival, has been studied by a large number of authors. In general, the impact of financial variables on survival has been found to be significant and consistent across different empirical studies. In parallel, theoretical frameworks that incorporate financial variables have also been developed by economists, to explain the mechanisms through which borrowing constraints influence survival. Revenues, financial structure and the collateral of firms are variables frequently used in such models.
In addition to financial constraints there are firm characteristics that have been linked to firm survival. Companies that export are often seen as more resilient than firms that depend solely on domestic demand, especially during recessions. A number of papers have studied if the likelihood of survival differed between exporters and non-exporters. They concluded that exporter firms are more likely to survive than firms that do not export, with the results being consistent across studies. However, only a very reduced number of studies have studied if the likelihood of survival differs between exporters and non-exporters controlling for financial constraints. It is important to separate the two effects as empirical studies have found evidence
that financial constraints may be important when deciding to export. None of the studies on the impact of export status on survival used data from Portuguese firms.
The purpose of this paper is to study, for the Portuguese economy, the impact of financial constraints on firm survival and to determine if the likelihood of survival differs between exporters and non-exporters, or across exporting status – starters/switchers, continuous exporters, continuous non-exporters, and exiters from export markets. It also studies the impact of financial variables on survival for the different groups. This paper contributes to the literature that studies the relationship between financial constraints, internationalization and firm survival.
The study uses a database with balance sheet information on the majority of firms operating in Portugal between 2008 and 2012. The database, Informação Empresarial
Simplificada (IES), is compiled by Banco de Portugal with information reported by firms in
each year. It contains information for all industries making it possible to conduct an analysis not only for the manufacturing sector, but for the economy as a whole.
The results indicate that as expected firms with less leverage, higher profits and higher collateral are more likely to survive then their counterparts. The empirical analysis also showed that after controlling for financial effects, firms’ characteristics such as age and size, sector characteristics, macro and random firm effects, exporter firms were more likely to survive than non-exporting firms, and that after exiting the export market firms had a lower probability of surviving when compared to continuous and non-continuous exporters, and starters/switchers.
This paper is organized as follows. Section 2 describes the literature that is relevant for the empirical analysis. Section 3 describes the data and Section 4 the empirical model. Section 5 discusses the results. Section 6 discusses the robustness of the results. Section 7 presents the conclusions.
2. Literature review 2.1 Financial constraints
Several authors have developed theoretical frameworks to explain how financial constraints determine the growth and exit decision of firms (Cooley and Quadrini, 2001; Albuquerque and Hopenhayn, 2004; Clementi and Hopenhayn, 2006).
Clementi and Hopenhayn (2006) developed a framework in which financial constraints appear as a consequence of asymmetric information between a borrower and a lender. In their model, a lender finances the initial investment, I0, and the working capital, kt, that is transferred to the borrower in each period and is entitled to a share of the liquidation value of the project in case it fails. The borrower is required to pay the lender all its profits during the first periods of the project and will receive revenues that constitute the expected equity, V, until the end of the project. A project is financially feasible and can take place if the sum of the wealth of the entrepreneur together with the maximum sustainable debt (which is determined by the value of the collateral) is sufficient to finance the initial investment, I0. The initial decision on how to finance initial investment is important but it is not the sole determinant of the financial structure of the firm. The performance of revenues is also a very important factor. This occurs as negative shocks to revenues are translated into lower expected equity and as positive shocks are rewarded by an increase in expected equity. As a consequence of this specification, a sequence of negative shocks greatly reduces entrepreneurs’ expected future benefits. If the equity reaches a specific threshold the entrepreneur may decide to exit in order to benefit from its share of the liquidation value.
The model developed by Albuquerque and Hopenayn (2004) uses a similar structure. The lender is responsible for financing initial investment, I0, and the working capital, kt. (I0 and kt can be seen as long-term and short-term debt respectively). The borrower is required to pay the lender its profits in the initial stage. The maximum total debt is determined by the value of
collateral. However, in this model the financial constraints are a consequence of limits to the enforceability of the contract, as the borrower can decide to exit, instead of information asymmetries. In the model, a firm would decide to liquidate the business if the value of expected cash flows, V, would be inferior to other opportunities available to the entrepreneur. Furthermore, a sequence of negative shocks may lower the equity (V) to the point at which firms decide to exit.
A very different approach was used by Cooley and Quadrini (2001), nonetheless they also concluded that firms affected by financial constraints were expected to have a lower likelihood of survival. According to their specification, a firm would be liquidated if it suffered a permanent shock making the business unproductive or if the firm had insufficient resources to repay the debt as a result of a temporary productivity shock with restrictions to external financing.
The previous theoretical frameworks are supported by a number of empirical studies. Some papers provide empirical evidence that financial constraints influence a firm’s decision to invest (Fazzari et al., 1988), and that they are important to explain growth patterns and firm size (Cabral and Mata, 2003). Other papers have concluded that financial constraints are significant determinants of the failure of firms.
Zingales (1998) found evidence that more indebted and less profitable firms had a lower probability of survival using data from the trucking sector in the US, even when controlling for productivity. With data from Greek manufacturing companies, Fotopolis and Louri (2000) determined that on average firms with higher tangible assets and profits, and lower debt had a lower probability of exit. Using similar financial variables – debt over assets, the ratio of tangible assets to total assets and profits over assets - Bridges and Guariglia (2008) with data on newly establish firms for the UK, Tsoukas (2011) with data for listed companies from East Asia, and Spaliara and Tsoukas (2013) with a panel of Asian firms from five different countries
have reach the same conclusions.
A more diverse set of variables was used by Bunn and Redwood (2003). With a panel of British firms from all sectors of activity (except the financial sector), they concluded that debt and profits, current ratio and interest cover ratio were also significant determinants of survival. Using a panel of British firms as well, Guariglia et al. (2016) found evidence that leverage, profits, equity over assets and interest rates were relevant to explain the exit decision of firms. Finally, using data for manufacturing firms from France and the U.K., Görg and Spaliara (2014) employed the variables - interest coverage ratio and leverage in their model with statistically significant results that were consistent with previous studies.
As for Portugal, the impact of financial constraints on firm survival was studied by Farinha and Santos (2006) using data for the newly created firms that answered the annual survey of the Bank of Portugal between 1985 and 1998. In their study, firms with higher leverage, and lower ratio of tangible assets to total assets were on average more likely to exit. They also studied if the value of the financial variables at birth were significant to explain survival in later periods. In another study of Portuguese firms, Mata et al. (2010), different types of debt were considered important determinants of survival. The impact of financial variables on exit was also considered, although indirectly, in the paper by Mata and Freitas (2012). The purpose of their paper was to study if foreign firms had a higher survival rate when compared to domestic firms. The variables debt over total assets and ROA were used as control variables and were found to be statistically significant, with higher leverage and lower profits being associated with a higher probability of exit.
2.2 Exports
Several microeconomic studies have found empirical evidence that support the hypothesis that exporters have a higher probability to survive relative to non-exporters (see Wagner, 2011, for a survey of the literature). To my knowledge, only two papers have studied
the impact of financial constraints with export activities on the probability of exit. Using data for the UK, Bridges and Guariglia (2008) study the effect of internationalization on survival. They conclude that exporters have a lower probability of exit. A similar result was obtained for foreign owned firms. Using data for British and French manufacturing firms, Görg and Spaliara (2014) studied the relation between financial variables, export status and survival. Their results indicate that when financial health indicators change, the impact on survival of a one unit increase in each of the variables is not the same for starters, continuous exporters, continuous non-exporters, exiters from export markets and switchers (firms that do not export continuously). Starters and exiters from export markets have a stronger reaction to the indicators than switchers and continuous exporters. In a previous version of the paper, they also presented evidence that on average exporters had a lower probability of exit than other firms.
2.3 Other firm characteristics. Market characteristics.
A significant number of studies have shown that firms with larger size enjoy a higher probability of survival. Mata and Portugal (1994) showed that this argument is true for Portugal. Firms may be larger because they are more efficient (Audretsch and Mahmood, 1994), or they may be larger because they can operate at their efficient size, i.e. they are not influenced by financial factors (Fazzari et al., 1988).
The age of the firm has also been suggested as an important factor for firm survival (Mata and Portugal, 1994, and Farinha and Santos, 2006). A possible explanation in the literature is that the relationship between a lender and an entrepreneur is more likely to be influenced by asymmetries of information as young firms do not have a long history of reports. Another explanation is that neither the entrepreneur or the lender have full information on the potential of the initial investment, and need to see the reaction of the market in the first years.
Specific characteristics of the sectors such as their entry rates, exit rates or concentration indexes, as well as macro characteristics have been linked to the likelihood of survival (Mata
and Portugal, 1994). To account for these effects some authors have used industry dummies at 3-digit level (Mata and Freitas, 2012) or at a 5-digit level (Görg and Spaliara, 2014). Lastly, in the literature, dummies for the years of the sample are frequently used as a proxy for the effects of macro variables (Görg and Spaliara, 2014).
3. Data
The analysis uses the IES database from Banco de Portugal for the period 2006-2014. IES includes balance sheet information and individual information (such as starting year, district and sector of the economy) that is reported by each firm during tax payments. Thus, it includes the majority of Portuguese firms. However, there are reasons that might explain the non-existence of data for a firm in a specific year (delay in reporting for instance). Therefore, if a firm reported in period t-1 and in period t+1, but there was no information for period t, the firm was considered to be alive and the simple average of the values of the variables in t-1 and in t+1 were used to calculated the value for period t. If instead, a firm failed to report in period t and in period t+1, the firm was classified as dead in period t-1 (i.e. the firm died during period t-1). Finally, a firm was classified as dead in period t if the firm had reported its intention to close business in period t. Consequently, this paper only uses information for the period 2006-2012, as the last two years are required to construct the variable “dead/ exit”.
Following a methodology which is commonly described in the literature with micro data, firms that had incomplete information or inconsistent information for the variables of interest were excluded. Moreover, firms that reported values for the financial variables that were above the 99th percentile were also excluded as such extreme values were considered to be a result of errors in reporting or extreme shocks. Additionally, only firms with positive values of business turnover and assets were used.
In 2010, a new set of accounting rules were implemented in Portugal, the new guidelines were designed to be consistent with international standards. As a consequence, the definition
of some of the variables vary before and after 2010. Moreover, a break in the series of financial variables was observed in 2010. In order to accomplish a rigorous analysis, the sample was split into two, the first group had firms that reported before 2010. The second group included information for the period 2011-2012
The theoretical work of Clementi and Hopenayn (2006) and the extensive number of empirical works that studied the impact of financial constraints and export status on survival determined the choice of variables that were used in this paper. The analysis in this paper will include the effects of the financial variables - leverage, collateral and profits and the effect of export indicator variables - exports dummy and export status dummies. Control variables such as size, age, year-dummies and industry-dummies will also be added to the models.
To create the final database, financial ratios were calculated for each firm for every year. As a measure of Leverage the ratio of debt to total assets was calculated. Before 2010 the value of debt corresponds to bank loans. After 2010, the definition of debt is less strict, it includes loans from financial institutions, bonds and loans from firms from the same corporate group. The change in the definition is a direct consequence of the transformation in the accounting and reporting rules that took place in 2010. Profits were defined as return on assets, i.e. the ratio between earnings before interests and taxes over total assets. IES does not have a measure that allows for a direct measure of Collateral, therefore fixed assets were used as a proxy. Thus, for each firm in each year, the ratio between fixed assets to total assets was computed.
Export indicator variables were also calculated for each of the firms. Exporter is an indicator variable that was designed to assume 1 if business turnover from abroad was positive, and zero otherwise. After 2010, the number of firms with missing information on business turnover from foreign countries was similar to the number of firms with null sales before that year. Therefore, the missing values were considered to be zero for this particular variable. An additional variable, that measures the link between survival and export behavior, was computed
for each firm. The Export status is a categorical variable with four possible classifications: continuous exporter, continuous non-exporter, exiter from export markets and starters/switcher. A firm was classified as Continuous exporter if it exported in period t, t-1 and in period t-2 (if alive). If a firm did not have positive exports for period t, t-1 and t-2 (if alive) the firm was classified as Continuous non-exporter. Moreover, in the case a firm exported in period t-1 but had no positive exports in period t, it was considered an Exiter from export markets. Finally, if a firm had no positive exports in period t-1 but had positive exports in period t the firm was classified as a Starter/ switcher. Consequently, only data from 2008-2012 was used.
The control variables for individual characteristics of the firms: Age and Size were computed as the logarithm of age and the logarithm of real sales to account for non-linearities. In the cases that this specification was considered not sufficient, the logarithm squared was used in the regressions as well. In the literature, different studies use different measures of size – number of employees, real sales or assets. In this paper, sales were used as it is more coherent with the definition used by the European Commission in the classification of firm dimension.
The first control variables for the market, the industry dummies, were constructed as follows. In the regressions that used the entire sample, 11 different sectors were considered: Mining and quarrying; Manufacturing; Utilities; Construction; Wholesale and retail trade; Transport and Storage; Accommodation and food services; Information and food services; Real estate; Consulting, education and health and Other services (exclude financial services). Additional analysis was performed using only data for the manufacturing sector. In this case, 2-digit industry dummies were used to differentiate the different hazard rates of the sector.
To avoid endogeneity, all financial and size variables were used with one lag. Moreover, in order to measure the impact of the financial variables on survival only firms that had positive values for the financial variables for at least one of the sample years were included in the analysis. Additionally, sectors, and all firms in it, that did not have at least one firm with positive
values of exports in each year were excluded.
The analysis uses four distinct databases. The first; DB1, includes 272 215 observations of 160 437 firms from all sectors of the economy during the period 2008-2010. The second, DB2, includes 45 273 observations of 23 160 manufacturing firms for the period 2008-2010. Furthermore, DB3 and DB4 include information for the period 2011-2012. The first, DB3, has 305 887 observations for 160 611 firms, and the last, DB4, includes only 23 261 firms with 44 272 observations in total.
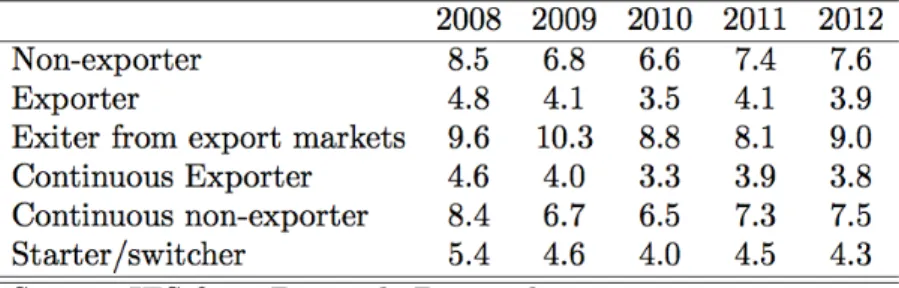
Table 1: Evolution of death rates of firms by export status
Table 1 shows the evolution of death rates across the years for exporting and non-exporting firms. There is clear evidence that the rate is superior in the case of non-exporters. Relative to export status, exiters from export markets have the highest death rate and continuous
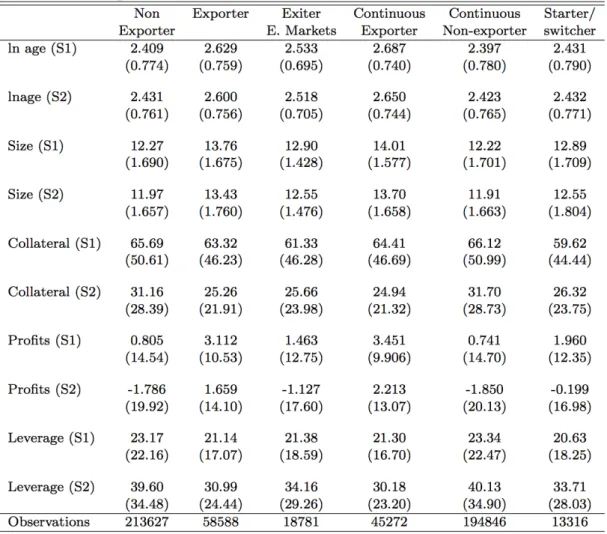
exporters have the lowest. Table 2 shows the sample means of the financial variables by
exporting status. On average, exporting firms are larger and older, have larger values of profits and have lower values of collateral and leverage. Finally, on average, profits are the highest for continuously exporting firms and continuous non-exporters have the largest value of debt.
4. Empirical model
To achieve the purpose of this paper it is essential to estimate the exit probability of the firm. Two important factors condition the analysis and should be taken into consideration before choosing the model so that bias is avoided. First, looking at the information available for firms in 2012, it is impossible to know when most of the firms in the sample will die, i.e. the data is right censored. Second, in 2008 all firms were included regardless of their age. This
means that the data is also left truncated. In order to minimize the bias created by these specificities a semiparametric hazard model was used for the analysis.
Table 2: Sample means by exporting status
The information provided in the database is annual. This implies that it is not possible to determine the exact time of death, it is only possible to acknowledge that the firm died after the beginning of the period and before it ended, thus interval censoring is also present. To account for the later characteristic a discrete duration model was used (complementary log-log). Additionally, to incorporate the empirical evidence that firm heterogeneity is relevant to explain survival, a random effects model was used (with normal distribution). The additional effects calculate a different baseline hazard for each firm. A very good explanation of the model and steps for its implementation is provided in Jenkins (2005) and Jenkins (1995). Furthermore,
Geroski et al. (2010), Tsoukas (2011) and Görg and Spaliara (2014) provide examples of empirical applications of the discrete survival models to firm survival analysis. The model can be represented as:
!"# %(', )|+) = . ' + 0 12'+ 342'+ 562'+ 782'+ 92 ' = :, … , < (1) Equation (1) presents the hazard rate, which is the probability of failure in t, given that, the firm did not die until t-1. It is represented in the cloglog form. The hazard depends on the baseline hazard that characterizes each firm, = (>? = @(=)), individual characteristics of the firm such as age (t) and size (Y), financial variables (X), export indicators (W) and market indicators (Z). A, B, C and D represent vectors of the regression coefficients. E includes Y, X, W and Z.
!"# %(', )|+) = . ' + 0 12'+ 342'+ 5FGHIJ'KJ2'+ 782'+ 92 (2) The analysis involved two stages. Each of the steps was implemented on all four databases. Firstly, the impact of the financial variables and the link between survival and exporting was studied (2). Additionally, the relationship between survival and exporter status was studied (3).
!"# %(', )|+) = . ' + 0 12'+ 342'+ 5FGHIJ' L'M'NL2'+ 782'+ 92 (3) Secondly, a different approach was followed in order to establish if the regression coefficients of the financial variables could vary across export indicators (4). As in stage 1, the analysis with the export indicator was used first and the export status indicator was used after. !"# %(', )|+) = . ' + 0 12'+ 342'+ 562'+ O 4 ∗ 6 2'+ 782'+ 92 (4) where Q R ∗ STUVWXYW = QZ[Y=W\]Y ∗ STUVWXYW + Q^_WV@`Xa ∗ STUVWXYW + QbcVdd\XYW\d ∗ STUVWXYW
5. Results
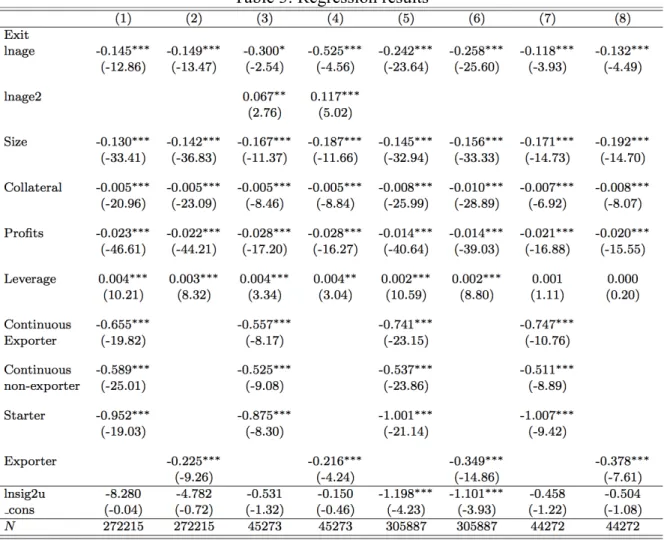
In this section, the empirical results are presented and discussed in light of the evidence from the relevant empirical literature. Table 3 shows the estimates of equations (3) in columns 1, 3, 5 and 7 and the estimates of equation (2) in columns 2, 4, 6 and 8. The first four columns
refer to the analysis of the data for the first period (2008-2010) and the last four for the second period (2011-2012). In addition, the last two columns of each period refer to the manufacturing sector as oppose to all industries.
The impact of financial variables – Leverage, Profits and Collateral - on the exit decision of firms is statistically significant. The estimates show that firms with more Leverage have on average a higher likelihood of exit, which is consistent with the results found in the literature (Zingales (1998), Fotopolis and Louri (2000), Bunn and Redwood (2003), Bridges and Guariglia (2008), Tsoukas (2011), Spaliara and Tsoukas (2013), Görg and Spaliara (2014), Guariglia et al. (2016)), including previous results that used Portuguese data (Farinha and Santos (2006), Mata et al. (2010), Mata and Freitas (2012)).
The results also indicate that firms with higher ROA (Profits) have on average a lower probability of exit. This is in line with previous studies on survival (Mata and Freitas (2012), Zingales (1998), Fotopolis and Louri (2000), Bunn and Redwood (2003), Bridges and Guariglia (2008), Tsoukas (2011), Spaliara and Tsoukas (2013), Guariglia et al. (2016)). There is also empirical evidence that Collateral is an important factor for survival. The higher its value, the lower is, on average, the probability of exit. In the literature, several variables have been used as proxy for collateral, Fotopolis and Louri (2000) used fixed assets and found evidence that the higher the values of this variable the lower the likelihood of exit. Another variable also used as proxy is tangibles assets, which includes not only fixed assets but also inventories. This approach was followed by Farinha and Santos (2006), Bridges and Guariglia (2008), Tsoukas (2011), Spaliara and Tsoukas (2013), and they all concluded that the variable was an important determinant of survival and that higher values of collateral decreased the probability of exit.
Thus, the empirical results show that the probability of survival depends on the financial strength of firms, as companies with less leverage and more profits and collateral have a lower probability of exit, which is consistent with the empirical literature on survival.
Table 3: Regression results
The empirical results also show that exporting firms have on average a lower probability of exit than non-exporting firms, controlling for the financial factors that also influence the business. There are several empirical studies that analyzed the link between firm survival and exports, and found that on average exporting firms have a lower likelihood to exit or the link is insignificant. However, only Bridges and Guariglia (2008) analyzed this effect controlling for the financial health of the firm. Their conclusion was that exporting firms had a higher probability of survival.
A more detailed analysis of the effect of exporting was done using four indicators instead of two. After controlling for financial factors (on average) Exiters from export markets have the highest probability of closing their business. Starters/switchers have the lowest probability
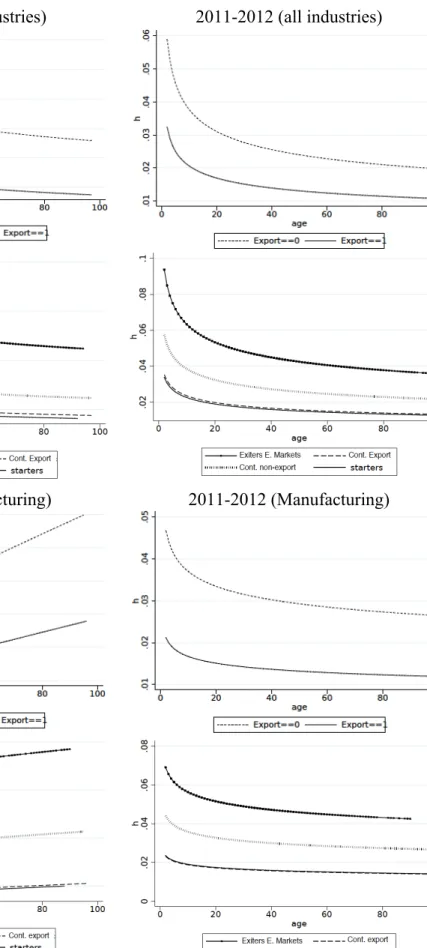
Table 4: Hazard rates(h) by export status 2008-2010 (all industries)
2011-2012 (all industries)
2008-2010 (Manufacturing) 2011-2012 (Manufacturing)
of exit, which suggests that the decision to start exporting and exit are not taken in the same year. Continuous exporters show a lower probability of exit when compared to continuous
non-exporters, this difference is particularly relevant in the last period (2011-2012).
However, table 2 showed that firms with different exporting status presented different sample means for the financial variables. This fact suggests that, the impact of export status on survival happens through two channels - the financial and the non-financial. Table 4 shows the hazard rate using the coefficients that were estimated in the regression, the mean of the financial variables for each status, and the effect of the status estimated in the regression. The graphs confirm the previous conclusions – exiters from export markets have higher hazard rates, and
starters/switcher have the lowest rates. Continuous exporters have a lower likelihood of exit
relative to continuous non-exporters.
Görg and Spaliara (2014) analyzed the impact of export status on survival while controlling for the financial health of the firm. Their conclusions also highlighted that exiters
from export markets have a higher probability of exit relative to other firms.
Therefore, the exporting status of a firm seems relevant to explain survival even when the financial effect is controlled for in the model. The results also show that the decision to export comes with risks as exiters from export markets had the highest values for the hazard rate. A possible explanation is that a large investment is required prior to the start of the exporting activity, with a large share being a sunk cost. Not succeeding may therefore compromise the firm’s ability to honor their commitments with the financial institutions or reduce to unsustainable levels the internal resources of the firm.
The results on the individual characteristics of the firms are also consistent with the literature, as older and larger firms have a lower probability to exit.
Table 5 shows the estimation results of equation (4). As before, the first four columns Table 5: Regression results
refer to the analysis of the data for the first period (2008-2010) and the last four for the second period (2011-2012). In addition, the last two columns of each period refer to the manufacturing sector as oppose to all industries.
The results show that the interactions between the financial variables and export status are particularly relevant when the estimation uses all industries, with most of the coefficients being statistically significant. However, the importance of the interactions for the estimation of the hazard rate for manufacturing firms seems reduced, as most coefficients associated with the interactions are statistically insignificant. The empirical results from columns (1) and (5) suggest that the increase in the probability of exit after a decrease of Collateral or Profits will be higher for exiters from export markets relative to starters and continuous non-exporters, however the impact on survival after an increase in leverage is expected to be lower for exiters. The important conclusion is, that even in the presence of interactions, the indicators of export status remain statistically significant, with the same sign and ordering. Therefore, exiters
from export markets continue to be the firms that, on average, have a higher probability of exit,
and starters/switchers the firms with the lowest. Thus, empirical evidence suggests that firms belonging to different exporting status may have different coefficients for the financial variables. However, the main results regarding the importance of the financial variables and export indicators do not change after taking into account such interactions between the two sets of variables.
6. Robustness
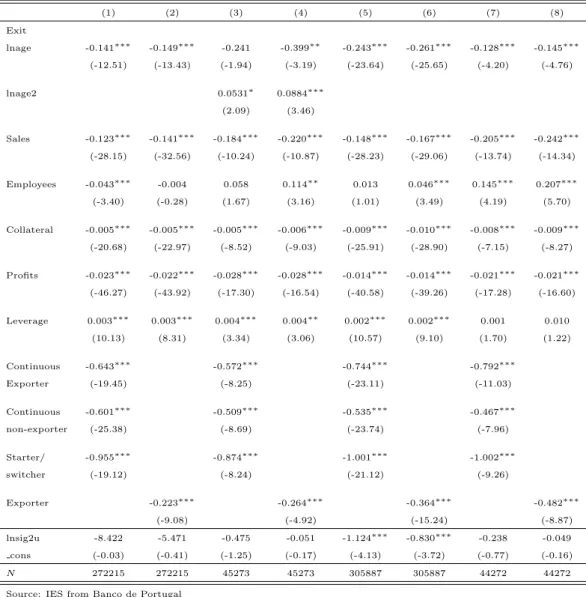
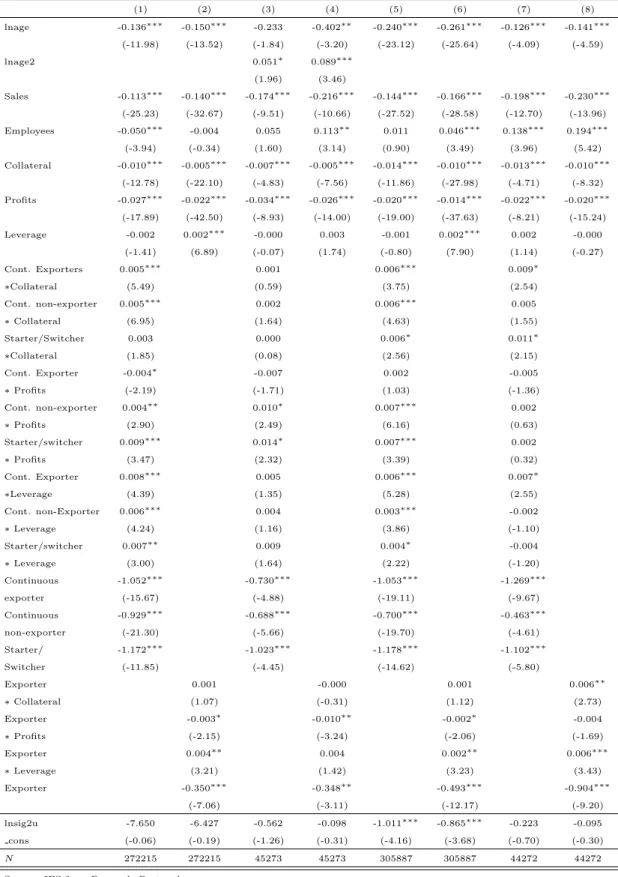
In this section, the empirical results of the robustness checks are discussed. Initially, the variable productivity was added to the model to test if financial and export indicators remained statistically significant determinants of survival and if the inclusion of this variable changed the sign of the relevant estimators. The variable logarithm of sales over the number of employees
was chosen to measure productivity. To estimate the effect of size (sales) and the effect of productivity (sales per employee) on survival, the following specification was considered:
!"# %(', )|+) = . ' + 342'+ 562'+ 782'+ 92+ 0:!e fg!hfij + 0k!e KlHmInKKL2' (6)1 The empirical results showed that all variables that were significant remained significant and none of the relevant variables changed its sign.
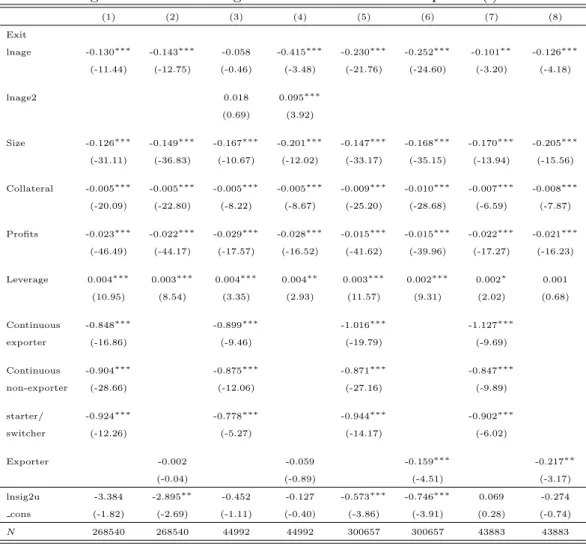
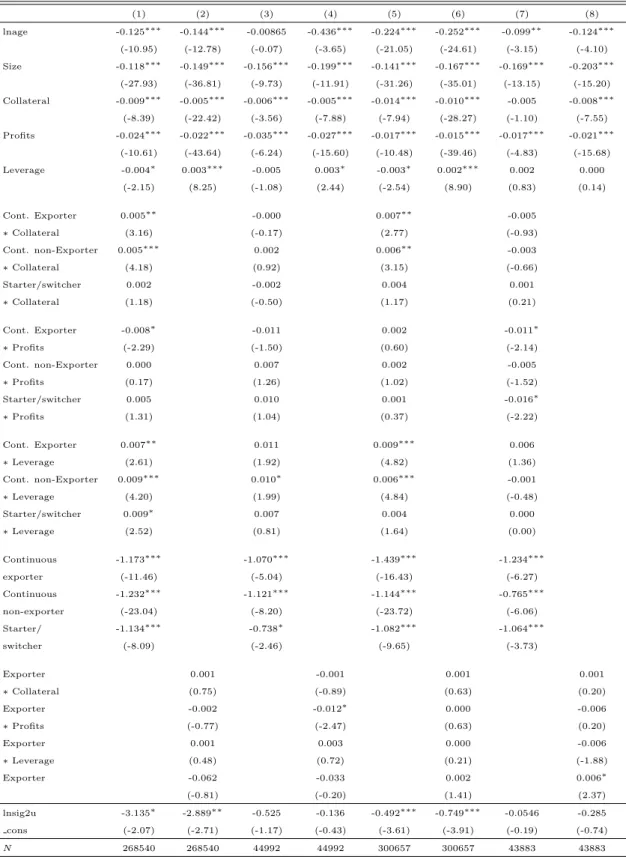
Next, robustness was also tested considering different specifications from the ones used in the original model. Firstly, it was tested whether changing the definition of the export indicator would change the empirical results. In the original model, the indicator for exports was defined as 1 if a firm had positive foreign sales, and zero otherwise. In this new model, the variable export will only assume the value of 1 if the business turnover originated abroad was above 50% of the total value, or, superior to 10% if the firm had sales superior to 150 000€. The financial variables – leverage, profits and collateral remained significant and with the same sign. However, there was a change to the effect of the export status when controlling for the effect of the financial variables. With the new specification, continuous exporters become the group with the lowest probability of exit.
Secondly, a model with a different definition of leverage was used. In the new model, leverage is defined as liabilities instead of debt. The number of firms with information on liabilities is larger when compared with the number of firms that have information on debt, which explains the differences in the number of observations. The effect of this variable on the probability of exit remains positive. The effects of the other variables are consistent with previous results. However, using this specification, leverage becomes statistically significant for all the regressions. Finally, the baseline model was re-estimated using 3 digit-level industry dummies. The results were also consistent with the ones obtained with the first model.
1Instead of using sales and sales per employee, the regression includes sales and employees due to the stuvs
7. Conclusions
In this study, micro data for firms that were operating in the Portuguese economy between 2008 and 2012 available in IES was used. IES is a database which is computed by Banco de Portugal using individual characteristics and balance sheet information that firms are obliged to report every year, consequently it comprises information for all, or almost all Portuguese firms. The initial database was split into two sub periods, 2008-2010 and 2011-2012, and empirical estimations were applied to both periods. This decision was made to overcome a structural break in the series of the financial variables which were a result of revisions to the legislation on accounting rules implemented in 2010.
One of the purposes of this study was to determine if, in Portugal, the survival of firms was influenced by financial factors. The empirical evidence shows that variables such as leverage, profitability and availability of assets that could be presented as collateral are relevant to the likelihood of exit of a firm. Firms with higher leverage, lower returns on assets and lower shares of assets that can be used as collateral have on average a higher probability of exit.
However, relative to the main research question if exporters were more likely to survive relative to firms that were only exposed to the domestic market, the results showed that after controlling for financial variables, exporting firms have on average a higher probability of survival. Moreover, exporting firms also present healthier values for the financial indicators, which decreases even more the likelihood of exit.
To understand the relationship between exports and survival in more detail, a model including other indicators for the export behavior was tested. Exiters from export markets, which are firms that stopped exporting in the current period, constitute the group that has the lowest likelihood of survival. These firms present worst values for the financial variables when compared to continuous exporters and non-exporters and they are the most likely to exit when financial factors are controlled for. Exiters from export markets are also more reactive to
variations in the financial variables relative to other firms. However, starting to export also has some advantages. Firms that do not exit and become continuous exporters are expected to have lower hazard rates than firms that never decided to export, with and without the financial effects.
This may be relevant for policy decisions. Firms that export are more robust, they have lower death rates, lower leverage and higher returns. Thus, solving borrowing constraints that are currently limiting the access of firms to export markets may be important to strengthening the economy. However, the decision to export has risks. Firms that stop exporting have the highest hazard rates.
8. Bibliography
Albuquerque, Rui, and Hugo A. Hopenhayn. 2004. "Optimal lending contracts and firm dynamics." The Review of Economic Studies. vol. 71, no. 2, 2004, pp. 285–315. JSTOR, www.jstor.org/stable/3700627.
Audretsch, David and Talat Mahmood. 1994. “Firm selection and industry evolution: the post-entry performance of new firms.” Journal of Evolutionary Economics, 4(3): 243-260. doi: 10.1007/BF01236371
Bridges, Sarah, Alessandra Guariglia. 2008. “Financial constraints, global engagement, and firm survival in the United Kingdom: evidence from micro data.” Scottish Journal of Political Economy 55(4), 444–464, doi:10.1111/j.1467-9485.2008.00461.x
Bunn, P., Redwood, V., 2003. “Company accounts based modelling of business failures and the implications for financial stability.” Working Paper 210, Bank of England.
Cabral, Luis M. B., and José Mata. 2003. "On the Evolution of the Firm Size Distribution: Facts and Theory." American Economic Review 93(4): 1075-1090, doi: 10.1257/000282803769206205
Clementi, Gian Luca, and Hugo A. Hopenhayn. 2006. "A Theory of Financing Constraints and Firm Dynamics." Quarterly Journal of Economics 121 (1): 229-265, doi: 10.1093/qje/121.1.229.
Cooley, Thomas, F., and Vincenzo Quadrini. 2001. "Financial Markets and Firm Dynamics."American Economic Review, 91(5): 1286-1310. doi: 10.1257/aer.91.5.1286 Farinha, Maria Luísa, and João Santos. 2006. “The survival of start-ups: Do their funding
choices and bank relationships at birth matter.” Mimeo.
Fazzari, Steven M., R. Glenn Hubbard, Bruce C. Petersen, Alan S. Blinder, and James M. Poterba. 1988. "Financing Constraints and Corporate Investment." Brookings Papers on Economic Activity, no. 1 (1988): 141-206. doi:10.2307/2534426.
Fotopoulos, Georgios, and Helen Louri. 2000. “Determinants of hazard confronting new entry: does financial structure matter?” Review of Industrial Organization 17(3): 285–300, doi: 10.1023/A:1007862922531
Geroski, P. A., José Mata, and Pedro Portugal. 2010. “Founding conditions and the survival of new firms.” Strategic Management Journal, 31(5), 510-529.
Görg, Holger, and Marina-Eliza Spaliara. 2014. “Financial health, exports and firm survival: a comparison of British and French firms.” Economica, 81 (323). pp. 419-444.
Greenaway, David, Alessandra Guariglia, and Richard Kneller. 2007. “Financial factors and exporting.” Journal of International Economics, 73(2): 377–95, doi: 10.1016/j.jinteco.2007.04.002
Guariglia, A., Spaliara, M.-E. and Tsoukas, S. (2016). “To What Extent Does the Interest Burden Affect Firm Survival? Evidence from a Panel of UK Firms during the Recent Financial Crisis.” Oxford Bulletin of Economics and Statistics, 78: 576–594. doi: 10.1111/obes.12120.
Jenkins, Stephen P. 1995. “Easy Estimation Methods for discrete-time duration models.” Oxford Bulletin of Economics and Statistics, 57(1), 129-138. doi:10.1111/j.1468-0084.1995
Jenkins, Stephen P. 2005. “Survival analysis.” Unpublished manuscript, Institute for Social and Economic Research, University of Essex, Colchester, UK. Available at https://www.iser.essex.ac.uk/files/teaching/stephenj/ec968/pdfs/ec968lnotesv6.pdf. Mata, José, and Pedro Portugal. 1994. “Life duration of new firms.” Journal of Industrial
Economics, 42(3): 227–46. doi:10.2307/2950567.
Mata, José, António Antunes, and Pedro Portugal. 2010. “Borrowing Patterns, Bankrupcy and voluntary liquidation.” Banco de Portugal Working Paper 201027.
Mata, José, and Ernesto Freitas. 2012. “Foreignness and exit over the life cycle of firms.” Journal of International Business Studies (2012) 43, 615–630. doi:10.1057/jibs.2012.21 Spaliara, Maria-Eliza, and Serafeim Tsoukas. 2013. “What matters for corporate failures in Asia? Exploring the role of firm-specific characteristics during the Asian crisis.” Structural Change and Economic Dynamics, 26: 83-96. doi: 10.1016/j.strueco.2012.12.002
Tsoukas, Serafeim. 2011. “Firm survival and financial development: Evidence from a panel of emerging Asian economies.” Journal of Banking and Finance 35(7): 1736–1752, doi: 10.1016/j.jbankfin.2010.12.008
Wagner, Joaquim. 2011. “International trade and firm performance: a survey of empirical studies since 2006. Review of World Economics, 148(2), 235-267, doi: 10.1007/s10290-011-0116-8
Zingales, Luigi. 1998. “Survival of the fittest or the fattest? Exit and financing in trucking
industry”. The Journal of Finance 53(3): 905–38.
Appendix
In this section, the regressions results of the robustness tests are presented.
Table 1: Regression results with the variable productivity
(1) (2) (3) (4) (5) (6) (7) (8) Exit lnage -0.141⇤⇤⇤ -0.149⇤⇤⇤ -0.241 -0.399⇤⇤ -0.243⇤⇤⇤ -0.261⇤⇤⇤ -0.128⇤⇤⇤ -0.145⇤⇤⇤ (-12.51) (-13.43) (-1.94) (-3.19) (-23.64) (-25.65) (-4.20) (-4.76) lnage2 0.0531⇤ 0.0884⇤⇤⇤ (2.09) (3.46) Sales -0.123⇤⇤⇤ -0.141⇤⇤⇤ -0.184⇤⇤⇤ -0.220⇤⇤⇤ -0.148⇤⇤⇤ -0.167⇤⇤⇤ -0.205⇤⇤⇤ -0.242⇤⇤⇤ (-28.15) (-32.56) (-10.24) (-10.87) (-28.23) (-29.06) (-13.74) (-14.34) Employees -0.043⇤⇤⇤ -0.004 0.058 0.114⇤⇤ 0.013 0.046⇤⇤⇤ 0.145⇤⇤⇤ 0.207⇤⇤⇤ (-3.40) (-0.28) (1.67) (3.16) (1.01) (3.49) (4.19) (5.70) Collateral -0.005⇤⇤⇤ -0.005⇤⇤⇤ -0.005⇤⇤⇤ -0.006⇤⇤⇤ -0.009⇤⇤⇤ -0.010⇤⇤⇤ -0.008⇤⇤⇤ -0.009⇤⇤⇤ (-20.68) (-22.97) (-8.52) (-9.03) (-25.91) (-28.90) (-7.15) (-8.27) Profits -0.023⇤⇤⇤ -0.022⇤⇤⇤ -0.028⇤⇤⇤ -0.028⇤⇤⇤ -0.014⇤⇤⇤ -0.014⇤⇤⇤ -0.021⇤⇤⇤ -0.021⇤⇤⇤ (-46.27) (-43.92) (-17.30) (-16.54) (-40.58) (-39.26) (-17.28) (-16.60) Leverage 0.003⇤⇤⇤ 0.003⇤⇤⇤ 0.004⇤⇤⇤ 0.004⇤⇤ 0.002⇤⇤⇤ 0.002⇤⇤⇤ 0.001 0.010 (10.13) (8.31) (3.34) (3.06) (10.57) (9.10) (1.70) (1.22) Continuous -0.643⇤⇤⇤ -0.572⇤⇤⇤ -0.744⇤⇤⇤ -0.792⇤⇤⇤ Exporter (-19.45) (-8.25) (-23.11) (-11.03) Continuous -0.601⇤⇤⇤ -0.509⇤⇤⇤ -0.535⇤⇤⇤ -0.467⇤⇤⇤ non-exporter (-25.38) (-8.69) (-23.74) (-7.96) Starter/ -0.955⇤⇤⇤ -0.874⇤⇤⇤ -1.001⇤⇤⇤ -1.002⇤⇤⇤ switcher (-19.12) (-8.24) (-21.12) (-9.26) Exporter -0.223⇤⇤⇤ -0.264⇤⇤⇤ -0.364⇤⇤⇤ -0.482⇤⇤⇤ (-9.08) (-4.92) (-15.24) (-8.87) lnsig2u -8.422 -5.471 -0.475 -0.051 -1.124⇤⇤⇤ -0.830⇤⇤⇤ -0.238 -0.049 cons (-0.03) (-0.41) (-1.25) (-0.17) (-4.13) (-3.72) (-0.77) (-0.16) N 272215 272215 45273 45273 305887 305887 44272 44272
Source: IES from Banco de Portugal
t statistics in parentheses⇤p < 0.05,⇤⇤p < 0.01,⇤⇤⇤p < 0.001. Robust SE. exiters from export markets was omitted. Industry groups and years were also omitted. (1), (2), (3), (4) use data from 2008-2010 (5), (6), (7) and (8) use data from 2011-2012 and (3), (4), (7), (8) use only data for the manufacturing sector
Table 2: Regression results with the variable productivity with interactions (1) (2) (3) (4) (5) (6) (7) (8) lnage -0.136⇤⇤⇤ -0.150⇤⇤⇤ -0.233 -0.402⇤⇤ -0.240⇤⇤⇤ -0.261⇤⇤⇤ -0.126⇤⇤⇤ -0.141⇤⇤⇤ (-11.98) (-13.52) (-1.84) (-3.20) (-23.12) (-25.64) (-4.09) (-4.59) lnage2 0.051⇤ 0.089⇤⇤⇤ (1.96) (3.46) Sales -0.113⇤⇤⇤ -0.140⇤⇤⇤ -0.174⇤⇤⇤ -0.216⇤⇤⇤ -0.144⇤⇤⇤ -0.166⇤⇤⇤ -0.198⇤⇤⇤ -0.230⇤⇤⇤ (-25.23) (-32.67) (-9.51) (-10.66) (-27.52) (-28.58) (-12.70) (-13.96) Employees -0.050⇤⇤⇤ -0.004 0.055 0.113⇤⇤ 0.011 0.046⇤⇤⇤ 0.138⇤⇤⇤ 0.194⇤⇤⇤ (-3.94) (-0.34) (1.60) (3.14) (0.90) (3.49) (3.96) (5.42) Collateral -0.010⇤⇤⇤ -0.005⇤⇤⇤ -0.007⇤⇤⇤ -0.005⇤⇤⇤ -0.014⇤⇤⇤ -0.010⇤⇤⇤ -0.013⇤⇤⇤ -0.010⇤⇤⇤ (-12.78) (-22.10) (-4.83) (-7.56) (-11.86) (-27.98) (-4.71) (-8.32) Profits -0.027⇤⇤⇤ -0.022⇤⇤⇤ -0.034⇤⇤⇤ -0.026⇤⇤⇤ -0.020⇤⇤⇤ -0.014⇤⇤⇤ -0.022⇤⇤⇤ -0.020⇤⇤⇤ (-17.89) (-42.50) (-8.93) (-14.00) (-19.00) (-37.63) (-8.21) (-15.24) Leverage -0.002 0.002⇤⇤⇤ -0.000 0.003 -0.001 0.002⇤⇤⇤ 0.002 -0.000 (-1.41) (6.89) (-0.07) (1.74) (-0.80) (7.90) (1.14) (-0.27) Cont. Exporters 0.005⇤⇤⇤ 0.001 0.006⇤⇤⇤ 0.009⇤ ⇤Collateral (5.49) (0.59) (3.75) (2.54) Cont. non-exporter 0.005⇤⇤⇤ 0.002 0.006⇤⇤⇤ 0.005 ⇤ Collateral (6.95) (1.64) (4.63) (1.55) Starter/Switcher 0.003 0.000 0.006⇤ 0.011⇤ ⇤Collateral (1.85) (0.08) (2.56) (2.15) Cont. Exporter -0.004⇤ -0.007 0.002 -0.005 ⇤ Profits (-2.19) (-1.71) (1.03) (-1.36) Cont. non-exporter 0.004⇤⇤ 0.010⇤ 0.007⇤⇤⇤ 0.002 ⇤ Profits (2.90) (2.49) (6.16) (0.63) Starter/switcher 0.009⇤⇤⇤ 0.014⇤ 0.007⇤⇤⇤ 0.002 ⇤ Profits (3.47) (2.32) (3.39) (0.32) Cont. Exporter 0.008⇤⇤⇤ 0.005 0.006⇤⇤⇤ 0.007⇤ ⇤Leverage (4.39) (1.35) (5.28) (2.55) Cont. non-Exporter 0.006⇤⇤⇤ 0.004 0.003⇤⇤⇤ -0.002 ⇤ Leverage (4.24) (1.16) (3.86) (-1.10) Starter/switcher 0.007⇤⇤ 0.009 0.004⇤ -0.004 ⇤ Leverage (3.00) (1.64) (2.22) (-1.20) Continuous -1.052⇤⇤⇤ -0.730⇤⇤⇤ -1.053⇤⇤⇤ -1.269⇤⇤⇤ exporter (-15.67) (-4.88) (-19.11) (-9.67) Continuous -0.929⇤⇤⇤ -0.688⇤⇤⇤ -0.700⇤⇤⇤ -0.463⇤⇤⇤ non-exporter (-21.30) (-5.66) (-19.70) (-4.61) Starter/ -1.172⇤⇤⇤ -1.023⇤⇤⇤ -1.178⇤⇤⇤ -1.102⇤⇤⇤ Switcher (-11.85) (-4.45) (-14.62) (-5.80) Exporter 0.001 -0.000 0.001 0.006⇤⇤ ⇤ Collateral (1.07) (-0.31) (1.12) (2.73) Exporter -0.003⇤ -0.010⇤⇤ -0.002⇤ -0.004 ⇤ Profits (-2.15) (-3.24) (-2.06) (-1.69) Exporter 0.004⇤⇤ 0.004 0.002⇤⇤ 0.006⇤⇤⇤ ⇤ Leverage (3.21) (1.42) (3.23) (3.43) Exporter -0.350⇤⇤⇤ -0.348⇤⇤ -0.493⇤⇤⇤ -0.904⇤⇤⇤ (-7.06) (-3.11) (-12.17) (-9.20) lnsig2u -7.650 -6.427 -0.562 -0.098 -1.011⇤⇤⇤ -0.865⇤⇤⇤ -0.223 -0.095 cons (-0.06) (-0.19) (-1.26) (-0.31) (-4.16) (-3.68) (-0.70) (-0.30) N 272215 272215 45273 45273 305887 305887 44272 44272
Source: IES from Banco de Portugal
t statistics in parentheses⇤p < 0.05,⇤⇤p < 0.01,⇤⇤⇤p < 0.001. Robust SE. exiters from export markets was omitted. Industry groups and years were also omitted. (1), (2), (3), (4) use data from 2008-2010 (5), (6), (7) and (8) use data from 2011-2012 and (3), (4), (7), (8) use only data for the manufacturing sector
Table 3: Regression results using a di↵erent definition of exporter (i) (1) (2) (3) (4) (5) (6) (7) (8) Exit lnage -0.130⇤⇤⇤ -0.143⇤⇤⇤ -0.058 -0.415⇤⇤⇤ -0.230⇤⇤⇤ -0.252⇤⇤⇤ -0.101⇤⇤ -0.126⇤⇤⇤ (-11.44) (-12.75) (-0.46) (-3.48) (-21.76) (-24.60) (-3.20) (-4.18) lnage2 0.018 0.095⇤⇤⇤ (0.69) (3.92) Size -0.126⇤⇤⇤ -0.149⇤⇤⇤ -0.167⇤⇤⇤ -0.201⇤⇤⇤ -0.147⇤⇤⇤ -0.168⇤⇤⇤ -0.170⇤⇤⇤ -0.205⇤⇤⇤ (-31.11) (-36.83) (-10.67) (-12.02) (-33.17) (-35.15) (-13.94) (-15.56) Collateral -0.005⇤⇤⇤ -0.005⇤⇤⇤ -0.005⇤⇤⇤ -0.005⇤⇤⇤ -0.009⇤⇤⇤ -0.010⇤⇤⇤ -0.007⇤⇤⇤ -0.008⇤⇤⇤ (-20.09) (-22.80) (-8.22) (-8.67) (-25.20) (-28.68) (-6.59) (-7.87) Profits -0.023⇤⇤⇤ -0.022⇤⇤⇤ -0.029⇤⇤⇤ -0.028⇤⇤⇤ -0.015⇤⇤⇤ -0.015⇤⇤⇤ -0.022⇤⇤⇤ -0.021⇤⇤⇤ (-46.49) (-44.17) (-17.57) (-16.52) (-41.62) (-39.96) (-17.27) (-16.23) Leverage 0.004⇤⇤⇤ 0.003⇤⇤⇤ 0.004⇤⇤⇤ 0.004⇤⇤ 0.003⇤⇤⇤ 0.002⇤⇤⇤ 0.002⇤ 0.001 (10.95) (8.54) (3.35) (2.93) (11.57) (9.31) (2.02) (0.68) Continuous -0.848⇤⇤⇤ -0.899⇤⇤⇤ -1.016⇤⇤⇤ -1.127⇤⇤⇤ exporter (-16.86) (-9.46) (-19.79) (-9.69) Continuous -0.904⇤⇤⇤ -0.875⇤⇤⇤ -0.871⇤⇤⇤ -0.847⇤⇤⇤ non-exporter (-28.66) (-12.06) (-27.16) (-9.89) starter/ -0.924⇤⇤⇤ -0.778⇤⇤⇤ -0.944⇤⇤⇤ -0.902⇤⇤⇤ switcher (-12.26) (-5.27) (-14.17) (-6.02) Exporter -0.002 -0.059 -0.159⇤⇤⇤ -0.217⇤⇤ (-0.04) (-0.89) (-4.51) (-3.17) lnsig2u -3.384 -2.895⇤⇤ -0.452 -0.127 -0.573⇤⇤⇤ -0.746⇤⇤⇤ 0.069 -0.274 cons (-1.82) (-2.69) (-1.11) (-0.40) (-3.86) (-3.91) (0.28) (-0.74) N 268540 268540 44992 44992 300657 300657 43883 43883
Source: IES from Banco de Portugal
t statistics in parentheses⇤p < 0.05,⇤⇤p < 0.01,⇤⇤⇤p < 0.001. Robust SE. exiters from export markets was omitted. Industry groups and years were also omitted. (1), (2), (3), (4) use data from 2008-2010 (5), (6), (7) and (8) use data from 2011-2012 and (3), (4), (7), (8) use only data for the manufacturing sector
(i) a firm is an exporter if it exports more than 50 percent of its business turnover, or, if exports more than 10 percent of business turnover, and the value of sales is superior to 150 000
Table 4: Regression results using a di↵erent definition of exporter (i) with interactions (1) (2) (3) (4) (5) (6) (7) (8) lnage -0.125⇤⇤⇤ -0.144⇤⇤⇤ -0.00865 -0.436⇤⇤⇤ -0.224⇤⇤⇤ -0.252⇤⇤⇤ -0.099⇤⇤ -0.124⇤⇤⇤ (-10.95) (-12.78) (-0.07) (-3.65) (-21.05) (-24.61) (-3.15) (-4.10) Size -0.118⇤⇤⇤ -0.149⇤⇤⇤ -0.156⇤⇤⇤ -0.199⇤⇤⇤ -0.141⇤⇤⇤ -0.167⇤⇤⇤ -0.169⇤⇤⇤ -0.203⇤⇤⇤ (-27.93) (-36.81) (-9.73) (-11.91) (-31.26) (-35.01) (-13.15) (-15.20) Collateral -0.009⇤⇤⇤ -0.005⇤⇤⇤ -0.006⇤⇤⇤ -0.005⇤⇤⇤ -0.014⇤⇤⇤ -0.010⇤⇤⇤ -0.005 -0.008⇤⇤⇤ (-8.39) (-22.42) (-3.56) (-7.88) (-7.94) (-28.27) (-1.10) (-7.55) Profits -0.024⇤⇤⇤ -0.022⇤⇤⇤ -0.035⇤⇤⇤ -0.027⇤⇤⇤ -0.017⇤⇤⇤ -0.015⇤⇤⇤ -0.017⇤⇤⇤ -0.021⇤⇤⇤ (-10.61) (-43.64) (-6.24) (-15.60) (-10.48) (-39.46) (-4.83) (-15.68) Leverage -0.004⇤ 0.003⇤⇤⇤ -0.005 0.003⇤ -0.003⇤ 0.002⇤⇤⇤ 0.002 0.000 (-2.15) (8.25) (-1.08) (2.44) (-2.54) (8.90) (0.83) (0.14) Cont. Exporter 0.005⇤⇤ -0.000 0.007⇤⇤ -0.005 ⇤ Collateral (3.16) (-0.17) (2.77) (-0.93) Cont. non-Exporter 0.005⇤⇤⇤ 0.002 0.006⇤⇤ -0.003 ⇤ Collateral (4.18) (0.92) (3.15) (-0.66) Starter/switcher 0.002 -0.002 0.004 0.001 ⇤ Collateral (1.18) (-0.50) (1.17) (0.21) Cont. Exporter -0.008⇤ -0.011 0.002 -0.011⇤ ⇤ Profits (-2.29) (-1.50) (0.60) (-2.14) Cont. non-Exporter 0.000 0.007 0.002 -0.005 ⇤ Profits (0.17) (1.26) (1.02) (-1.52) Starter/switcher 0.005 0.010 0.001 -0.016⇤ ⇤ Profits (1.31) (1.04) (0.37) (-2.22) Cont. Exporter 0.007⇤⇤ 0.011 0.009⇤⇤⇤ 0.006 ⇤ Leverage (2.61) (1.92) (4.82) (1.36) Cont. non-Exporter 0.009⇤⇤⇤ 0.010⇤ 0.006⇤⇤⇤ -0.001 ⇤ Leverage (4.20) (1.99) (4.84) (-0.48) Starter/switcher 0.009⇤ 0.007 0.004 0.000 ⇤ Leverage (2.52) (0.81) (1.64) (0.00) Continuous -1.173⇤⇤⇤ -1.070⇤⇤⇤ -1.439⇤⇤⇤ -1.234⇤⇤⇤ exporter (-11.46) (-5.04) (-16.43) (-6.27) Continuous -1.232⇤⇤⇤ -1.121⇤⇤⇤ -1.144⇤⇤⇤ -0.765⇤⇤⇤ non-exporter (-23.04) (-8.20) (-23.72) (-6.06) Starter/ -1.134⇤⇤⇤ -0.738⇤ -1.082⇤⇤⇤ -1.064⇤⇤⇤ switcher (-8.09) (-2.46) (-9.65) (-3.73) Exporter 0.001 -0.001 0.001 0.001 ⇤ Collateral (0.75) (-0.89) (0.63) (0.20) Exporter -0.002 -0.012⇤ 0.000 -0.006 ⇤ Profits (-0.77) (-2.47) (0.63) (0.20) Exporter 0.001 0.003 0.000 -0.006 ⇤ Leverage (0.48) (0.72) (0.21) (-1.88) Exporter -0.062 -0.033 0.002 0.006⇤ (-0.81) (-0.20) (1.41) (2.37) lnsig2u -3.135⇤ -2.889⇤⇤ -0.525 -0.136 -0.492⇤⇤⇤ -0.749⇤⇤⇤ -0.0546 -0.285 cons (-2.07) (-2.71) (-1.17) (-0.43) (-3.61) (-3.91) (-0.19) (-0.74) N 268540 268540 44992 44992 300657 300657 43883 43883
Source: IES from Banco de Portugal
t statistics in parentheses⇤p < 0.05,⇤⇤p < 0.01,⇤⇤⇤p < 0.001. Robust SE. exiters from export markets was omitted. Industry groups and years were also omitted. (1), (2), (3), (4) use data from 2008-2010 (5), (6), (7) and (8) use data from 2011-2012 and (3), (4), (7), (8) use only data for the manufacturing sector
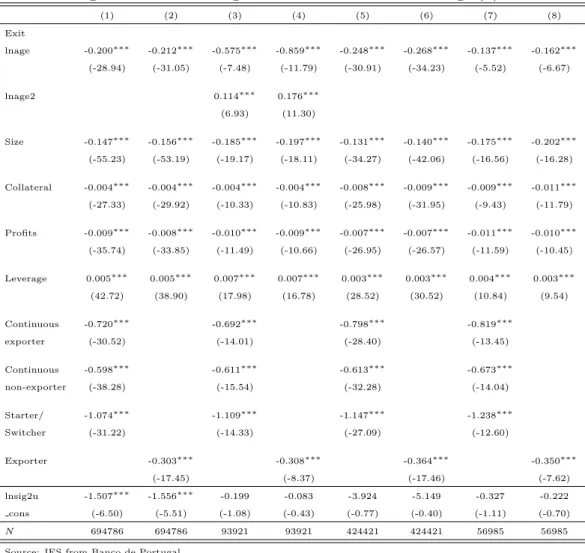
Table 5: Regression results using a di↵erent definition of leverage (ii) (1) (2) (3) (4) (5) (6) (7) (8) Exit lnage -0.200⇤⇤⇤ -0.212⇤⇤⇤ -0.575⇤⇤⇤ -0.859⇤⇤⇤ -0.248⇤⇤⇤ -0.268⇤⇤⇤ -0.137⇤⇤⇤ -0.162⇤⇤⇤ (-28.94) (-31.05) (-7.48) (-11.79) (-30.91) (-34.23) (-5.52) (-6.67) lnage2 0.114⇤⇤⇤ 0.176⇤⇤⇤ (6.93) (11.30) Size -0.147⇤⇤⇤ -0.156⇤⇤⇤ -0.185⇤⇤⇤ -0.197⇤⇤⇤ -0.131⇤⇤⇤ -0.140⇤⇤⇤ -0.175⇤⇤⇤ -0.202⇤⇤⇤ (-55.23) (-53.19) (-19.17) (-18.11) (-34.27) (-42.06) (-16.56) (-16.28) Collateral -0.004⇤⇤⇤ -0.004⇤⇤⇤ -0.004⇤⇤⇤ -0.004⇤⇤⇤ -0.008⇤⇤⇤ -0.009⇤⇤⇤ -0.009⇤⇤⇤ -0.011⇤⇤⇤ (-27.33) (-29.92) (-10.33) (-10.83) (-25.98) (-31.95) (-9.43) (-11.79) Profits -0.009⇤⇤⇤ -0.008⇤⇤⇤ -0.010⇤⇤⇤ -0.009⇤⇤⇤ -0.007⇤⇤⇤ -0.007⇤⇤⇤ -0.011⇤⇤⇤ -0.010⇤⇤⇤ (-35.74) (-33.85) (-11.49) (-10.66) (-26.95) (-26.57) (-11.59) (-10.45) Leverage 0.005⇤⇤⇤ 0.005⇤⇤⇤ 0.007⇤⇤⇤ 0.007⇤⇤⇤ 0.003⇤⇤⇤ 0.003⇤⇤⇤ 0.004⇤⇤⇤ 0.003⇤⇤⇤ (42.72) (38.90) (17.98) (16.78) (28.52) (30.52) (10.84) (9.54) Continuous -0.720⇤⇤⇤ -0.692⇤⇤⇤ -0.798⇤⇤⇤ -0.819⇤⇤⇤ exporter (-30.52) (-14.01) (-28.40) (-13.45) Continuous -0.598⇤⇤⇤ -0.611⇤⇤⇤ -0.613⇤⇤⇤ -0.673⇤⇤⇤ non-exporter (-38.28) (-15.54) (-32.28) (-14.04) Starter/ -1.074⇤⇤⇤ -1.109⇤⇤⇤ -1.147⇤⇤⇤ -1.238⇤⇤⇤ Switcher (-31.22) (-14.33) (-27.09) (-12.60) Exporter -0.303⇤⇤⇤ -0.308⇤⇤⇤ -0.364⇤⇤⇤ -0.350⇤⇤⇤ (-17.45) (-8.37) (-17.46) (-7.62) lnsig2u -1.507⇤⇤⇤ -1.556⇤⇤⇤ -0.199 -0.083 -3.924 -5.149 -0.327 -0.222 cons (-6.50) (-5.51) (-1.08) (-0.43) (-0.77) (-0.40) (-1.11) (-0.70) N 694786 694786 93921 93921 424421 424421 56985 56985
Source: IES from Banco de Portugal
t statistics in parentheses⇤p < 0.05,⇤⇤p < 0.01,⇤⇤⇤p < 0.001. Robust SE. exiters from export markets was omitted. Industry groups and years were also omitted. (1), (2), (3), (4) use data from 2008-2010 (5), (6), (7) and (8) use data from 2011-2012 and (3), (4), (7), (8) use only data for the manufacturing sector (ii) leverage is defined as total liabilities over total assets
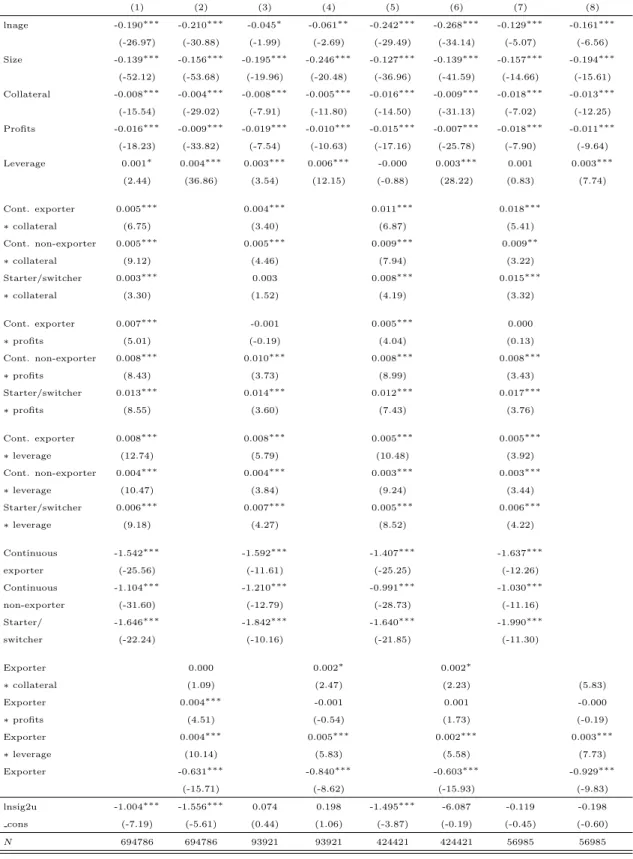
Table 6: Regression results using a di↵erent definition of leverage (ii) with interactions (1) (2) (3) (4) (5) (6) (7) (8) lnage -0.190⇤⇤⇤ -0.210⇤⇤⇤ -0.045⇤ -0.061⇤⇤ -0.242⇤⇤⇤ -0.268⇤⇤⇤ -0.129⇤⇤⇤ -0.161⇤⇤⇤ (-26.97) (-30.88) (-1.99) (-2.69) (-29.49) (-34.14) (-5.07) (-6.56) Size -0.139⇤⇤⇤ -0.156⇤⇤⇤ -0.195⇤⇤⇤ -0.246⇤⇤⇤ -0.127⇤⇤⇤ -0.139⇤⇤⇤ -0.157⇤⇤⇤ -0.194⇤⇤⇤ (-52.12) (-53.68) (-19.96) (-20.48) (-36.96) (-41.59) (-14.66) (-15.61) Collateral -0.008⇤⇤⇤ -0.004⇤⇤⇤ -0.008⇤⇤⇤ -0.005⇤⇤⇤ -0.016⇤⇤⇤ -0.009⇤⇤⇤ -0.018⇤⇤⇤ -0.013⇤⇤⇤ (-15.54) (-29.02) (-7.91) (-11.80) (-14.50) (-31.13) (-7.02) (-12.25) Profits -0.016⇤⇤⇤ -0.009⇤⇤⇤ -0.019⇤⇤⇤ -0.010⇤⇤⇤ -0.015⇤⇤⇤ -0.007⇤⇤⇤ -0.018⇤⇤⇤ -0.011⇤⇤⇤ (-18.23) (-33.82) (-7.54) (-10.63) (-17.16) (-25.78) (-7.90) (-9.64) Leverage 0.001⇤ 0.004⇤⇤⇤ 0.003⇤⇤⇤ 0.006⇤⇤⇤ -0.000 0.003⇤⇤⇤ 0.001 0.003⇤⇤⇤ (2.44) (36.86) (3.54) (12.15) (-0.88) (28.22) (0.83) (7.74) Cont. exporter 0.005⇤⇤⇤ 0.004⇤⇤⇤ 0.011⇤⇤⇤ 0.018⇤⇤⇤ ⇤ collateral (6.75) (3.40) (6.87) (5.41) Cont. non-exporter 0.005⇤⇤⇤ 0.005⇤⇤⇤ 0.009⇤⇤⇤ 0.009⇤⇤ ⇤ collateral (9.12) (4.46) (7.94) (3.22) Starter/switcher 0.003⇤⇤⇤ 0.003 0.008⇤⇤⇤ 0.015⇤⇤⇤ ⇤ collateral (3.30) (1.52) (4.19) (3.32) Cont. exporter 0.007⇤⇤⇤ -0.001 0.005⇤⇤⇤ 0.000 ⇤ profits (5.01) (-0.19) (4.04) (0.13) Cont. non-exporter 0.008⇤⇤⇤ 0.010⇤⇤⇤ 0.008⇤⇤⇤ 0.008⇤⇤⇤ ⇤ profits (8.43) (3.73) (8.99) (3.43) Starter/switcher 0.013⇤⇤⇤ 0.014⇤⇤⇤ 0.012⇤⇤⇤ 0.017⇤⇤⇤ ⇤ profits (8.55) (3.60) (7.43) (3.76) Cont. exporter 0.008⇤⇤⇤ 0.008⇤⇤⇤ 0.005⇤⇤⇤ 0.005⇤⇤⇤ ⇤ leverage (12.74) (5.79) (10.48) (3.92) Cont. non-exporter 0.004⇤⇤⇤ 0.004⇤⇤⇤ 0.003⇤⇤⇤ 0.003⇤⇤⇤ ⇤ leverage (10.47) (3.84) (9.24) (3.44) Starter/switcher 0.006⇤⇤⇤ 0.007⇤⇤⇤ 0.005⇤⇤⇤ 0.006⇤⇤⇤ ⇤ leverage (9.18) (4.27) (8.52) (4.22) Continuous -1.542⇤⇤⇤ -1.592⇤⇤⇤ -1.407⇤⇤⇤ -1.637⇤⇤⇤ exporter (-25.56) (-11.61) (-25.25) (-12.26) Continuous -1.104⇤⇤⇤ -1.210⇤⇤⇤ -0.991⇤⇤⇤ -1.030⇤⇤⇤ non-exporter (-31.60) (-12.79) (-28.73) (-11.16) Starter/ -1.646⇤⇤⇤ -1.842⇤⇤⇤ -1.640⇤⇤⇤ -1.990⇤⇤⇤ switcher (-22.24) (-10.16) (-21.85) (-11.30) Exporter 0.000 0.002⇤ 0.002⇤ ⇤ collateral (1.09) (2.47) (2.23) (5.83) Exporter 0.004⇤⇤⇤ -0.001 0.001 -0.000 ⇤ profits (4.51) (-0.54) (1.73) (-0.19) Exporter 0.004⇤⇤⇤ 0.005⇤⇤⇤ 0.002⇤⇤⇤ 0.003⇤⇤⇤ ⇤ leverage (10.14) (5.83) (5.58) (7.73) Exporter -0.631⇤⇤⇤ -0.840⇤⇤⇤ -0.603⇤⇤⇤ -0.929⇤⇤⇤ (-15.71) (-8.62) (-15.93) (-9.83) lnsig2u -1.004⇤⇤⇤ -1.556⇤⇤⇤ 0.074 0.198 -1.495⇤⇤⇤ -6.087 -0.119 -0.198 cons (-7.19) (-5.61) (0.44) (1.06) (-3.87) (-0.19) (-0.45) (-0.60) N 694786 694786 93921 93921 424421 424421 56985 56985
Source: IES from Banco de Portugal
t statistics in parentheses⇤p < 0.05,⇤⇤p < 0.01,⇤⇤⇤p < 0.001. Robust SE. exiters from export markets was omitted. Industry groups and years were also omitted. (1), (2), (3), (4) use data from 2008-2010 (5), (6), (7) and (8) use data from 2011-2012 and (3), (4), (7), (8) use only data for the manufacturing sector (ii) leverage is defined as total liabilities over total assets
Table 7:Regression results using 3-digit Industry dummies (1) (2) (3) (4) (5) (6) (7) (8) Exit lnage -0.116⇤⇤⇤ -0.114⇤⇤⇤ -0.179 -0.282⇤ -0.202⇤⇤⇤ -0.206⇤⇤⇤ -0.090⇤⇤ -0.093⇤⇤ (-9.85) (-9.71) (-1.41) (-2.25) (-18.79) (-19.18) (-2.83) (-2.94) lnage2 0.045 0.069⇤⇤ (1.73) (2.71) Size -0.118⇤⇤⇤ -0.121⇤⇤⇤ -0.162⇤⇤⇤ -0.168⇤⇤⇤ -0.137⇤⇤⇤ -0.139⇤⇤⇤ -0.144⇤⇤⇤ -0.150⇤⇤⇤ (-27.56) (-28.49) (-10.52) (-10.48) (-30.48) (-30.72) (-11.61) (-11.99) Collateral -0.004⇤⇤⇤ -0.005⇤⇤⇤ -0.005⇤⇤⇤ -0.005⇤⇤⇤ -0.007⇤⇤⇤ -0.008⇤⇤⇤ -0.006⇤⇤⇤ -0.007⇤⇤⇤ (-17.80) (-18.44) (-8.37) (-8.50) (-20.74) (-21.52) (-5.57) (-5.91) Profits -0.023⇤⇤⇤ -0.023⇤⇤⇤ -0.029⇤⇤⇤ -0.030⇤⇤⇤ -0.012⇤⇤⇤ -0.015⇤⇤⇤ -0.022⇤⇤⇤ -0.022⇤⇤⇤ (-45.15) (-44.26) (-17.60) (-17.02) (-41.05) (-40.08) (-16.82) (-15.94) Leverage 0.004⇤⇤⇤ 0.004⇤⇤⇤ 0.004⇤⇤⇤ 0.004⇤⇤⇤ 0.003⇤⇤⇤ 0.003⇤⇤⇤ 0.002⇤ 0.001 (12.22) (11.77) (3.50) (3.41) (12.91) (12.42) (2.03) (1.74) Continuous -0.619⇤⇤⇤ -0.544⇤⇤⇤ -0.704⇤⇤⇤ -0.726⇤⇤⇤ exporter (-17.58) (-7.67) (-20.53) (-9.78) Continuous -0.419⇤⇤⇤ -0.471⇤⇤⇤ -0.376⇤⇤⇤ -0.385⇤⇤⇤ non-exporter (-15.60) (-7.57) (-14.71) (-6.08) Starter/ -0.825⇤⇤⇤ -0.831⇤⇤⇤ -0.894⇤⇤⇤ -0.914⇤⇤⇤ switcher (-16.07) (-7.79) (-18.28) (-8.30) Exporter -0.331⇤⇤⇤ -0.264⇤⇤⇤ -0.451⇤⇤⇤ -0.472⇤⇤⇤ (-12.95) (-4.96) (-18.18) (-8.85) lnsig2u -2.940⇤ -2.152⇤⇤⇤ -0.323 -0.017 -0.644⇤⇤⇤ -0.540⇤⇤⇤ -0.103 -0.021 cons (-2.24) (-3.38) (-0.94) (-0.06) (-4.03) (-3.40) (-0.35) (-0.06) N 271755 271755 45011 45011 305522 305522 44074 44074
Source: IES from Banco de Portugal
t statistics in parentheses⇤p < 0.05,⇤⇤p < 0.01,⇤⇤⇤p < 0.001. Robust SE. exiters from export markets was omitted. Industry groups and years were also omitted. (1), (2), (3), (4) use data from 2008-2010 (5), (6), (7) and (8) use data from 2011-2012 and (3), (4), (7), (8) use only data for the manufacturing sector
Table 8:Regression results using 3-digit Industry dummies with interactions (1) (2) (3) (4) (5) (6) (7) (8) lnage -0.115⇤⇤⇤ -0.114⇤⇤⇤ -0.200 -0.293⇤ -0.202⇤⇤⇤ -0.206⇤⇤⇤ -0.090⇤⇤ -0.0920⇤⇤ (-9.81) (-9.75) (-1.55) (-2.33) (-18.72) (-19.17) (-2.81) (-2.88) lnage2 0.048 0.071⇤⇤ (1.83) (2.77) Size -0.117⇤⇤⇤ -0.120⇤⇤⇤ -0.156⇤⇤⇤ -0.164⇤⇤⇤ -0.137⇤⇤⇤ -0.138⇤⇤⇤ -0.142⇤⇤⇤ -0.146⇤⇤⇤ (-27.03) (-28.37) (-10.06) (-10.27) (-30.11) (-30.46) (-10.98) (-11.71) Collateral -0.007⇤⇤⇤ -0.004⇤⇤⇤ -0.006⇤⇤⇤ -0.005⇤⇤⇤ -0.011⇤⇤⇤ -0.008⇤⇤⇤ -0.011⇤⇤⇤ -0.008⇤⇤⇤ (-10.11) (-17.16) (-4.48) (-6.90) (-8.88) (-20.68) (-3.97) (-6.17) Profits -0.027⇤⇤⇤ -0.022⇤⇤⇤ -0.036⇤⇤⇤ -0.027⇤⇤⇤ -0.020⇤⇤⇤ -0.014⇤⇤⇤ -0.023⇤⇤⇤ -0.021⇤⇤⇤ (-17.99) (-42.24) (-9.07) (-14.56) (-18.35) (-38.36) (-8.11) (-15.07) Leverage 0.002 0.004⇤⇤⇤ 0.000 0.003⇤ 0.002⇤ 0.003⇤⇤⇤ 0.003 0.000 (1.84) (10.38) (0.10) (2.12) (2.23) (11.18) (1.67) (0.29) Cont. Exporter 0.003⇤⇤ 0.000 0.003⇤ 0.008⇤ ⇤ collateral (2.70) (0.27) (2.01) (2.17) Cont. non-Exporter 0.004⇤⇤⇤ 0.002 0.004⇤⇤ 0.004 ⇤ collateral (4.67) (1.32) (2.82) (1.37) Starter/switcher 0.001 -0.000 0.003 0.010⇤ ⇤ collateral (0.34) (-0.13) (1.43) (2.12) Cont. Exporter -0.004⇤ -0.006 0.001 -0.005 ⇤ profits (-2.00) (-1.42) (0.82) (-1.46) Cont. non-Exporter 0.005⇤⇤ 0.011⇤⇤ 0.007⇤⇤⇤ 0.002 ⇤ profits (3.14) (2.66) (5.88) (0.65) Starter/switcher 0.009⇤⇤⇤ 0.015⇤ 0.007⇤⇤ 0.002 ⇤ profits (3.34) (2.48) (3.19) (0.31) Cont. Exporter 0.005⇤ 0.005 0.004⇤⇤⇤ 0.006⇤ ⇤ leverage (2.42) (1.23) (3.58) (2.22) Cont. non-Exporter 0.002 0.004 0.001 -0.003 ⇤ leverage (1.39) (1.00) (1.30) (-1.51) Starter/switcher 0.004 0.009 0.002 -0.005 ⇤ leverage (1.67) (1.59) (1.01) (-1.52) Continuous -0.838⇤⇤⇤ -0.660⇤⇤⇤ -0.896⇤⇤⇤ -1.147⇤⇤⇤ exporter (-11.63) (-4.22) (-15.16) (-8.35) Continuous -0.614⇤⇤⇤ -0.622⇤⇤⇤ -0.434⇤⇤⇤ -0.345⇤⇤ non-exporter (-11.99) (-4.76) (-10.61) (-3.23) Starter/ -0.905⇤⇤⇤ -0.948⇤⇤⇤ -0.968⇤⇤⇤ -0.980⇤⇤⇤ switcher (-8.80) (-4.04) (-11.55) (-5.05) Exporter -0.001 -0.001 0.000 0.005⇤ ⇤ collateral (-1.11) (-0.71) (0.23) (2.31) Exporter -0.004⇤⇤ -0.010⇤⇤ -0.002⇤ -0.004 ⇤ profits (-2.65) (-3.20) (-2.47) (-1.83) Exporter 0.003⇤⇤ 0.003 0.002⇤⇤ 0.006⇤⇤ ⇤ leverage (2.69) (1.24) (2.95) (3.13) Exporter -0.374⇤⇤⇤ -0.303⇤⇤ -0.554⇤⇤⇤ -0.856⇤⇤⇤ (-7.39) (-2.71) (-13.27) (-8.62) lnsig2u -2.851⇤ -2.272⇤⇤ -0.394 -0.062 -0.604⇤⇤⇤ -0.564⇤⇤⇤ -0.085 -0.022 cons (-2.32) (-3.15) (-1.03) (-0.20) (-3.90) (-3.45) (-0.28) (-0.07) N 271755 271755 45011 45011 305522 305522 44074 44074
Source: IES from Banco de Portugal
t statistics in parentheses⇤p < 0.05,⇤⇤p < 0.01,⇤⇤⇤p < 0.001. Robust SE. exiters from export markets was omitted. Industry groups and years were also omitted. (1), (2), (3), (4) use data from 2008-2010 (5), (6), (7) and (8) use data from 2011-2012 and (3), (4), (7), (8) use only data for the manufacturing sector