Journal of the Brazilian Chemical Society
This is an Open Access artcle distributed under the terms of the Creatie Commons
Attributon NonCCommercial iicense hhich permits unrestricted nonCcommercial use, distributon,
and reproducton in any medium proiided the original hork is properly cited. Fonte:
http://hhh.scielo.br/scielo.phpsscriptssci_aarttext&pidsS0103C
50532015000601297&lngsen&nrmsiso. Acesso em: 16 abr. 2018.
REFERÊNCIA
COiARES, Carla Joiania Gomes et al. Exploratory analysis of the distributon of lignin and cellulose
in hoods by raman imaging and chemometrics. Journal of the Brazilian Chemical Society, São
Paulo, i. 26, n. 6, p. 1297C1305, jun. 2015. Disponíiel em: <http://hhh.scielo.br/scielo.phps
scriptssci_aarttext&pidsS0103C50532015000601297&lngsen&nrmsiso>. Acesso em: 16 abr. 2018.
doi: http://dx.doi.org/10.5935/0103C5053.20150096.
Article
J. Braz. Chem. Soc., Vol. 26, No. 6, 1297-1305, 2015. Printed in Brazil - ©2015 Sociedade Brasileira de Química
0103 - 5053 $6.00+0.00
A
http://dx.doi.org/10.5935/0103-5053.20150096*e-mail: [email protected]
Exploratory Analysis of the Distribution of Lignin and Cellulose in Woods by
Raman Imaging and Chemometrics
Carla J. G. Colares,a Tereza C. M. Pastore,b Vera T. R. Coradin,b José A. A. Camargos,b
Alessandro C. O. Moreira,b Joel C. Rubimb and Jez W. B. Braga*,a
aInstituto de Química, Universidade de Brasília, 70904-970 Brasília-DF, Brazil
bLaboratório de Produtos Florestais, Serviço Florestal Brasileiro, 70818-900 Brasília-DF, Brazil The determinations of cellulose and lignin are important in wood analysis from both perspectives: chemistry composition, commercial and industrial application of woods. In this context, Raman image spectroscopy was applied in the determination of cellulose and lignin distribution in wood surfaces of Swietenia macrophylla King (Mahogany) and Eucalyptus hybrid (E. urophylla × E. camaldulensis). The relative concentration maps were obtained by applying a multivariate curve resolution procedure. The estimated Raman spectra for cellulose and lignin agrees with the ones available in the literature. The cellulose concentration maps showed similar variations for both studied species with an average value of nearly 85% as obtained by the reference method. The lignin concentration maps were somewhat different. The Eucalyptus hybrid presents a broader distribution (20 to 45%) while for Mahogany it is nearly constant, around 25%, with localized regions presenting contents of 45 to 65% of lignin. The reference method showed that the mean lignin content of both species is 27%. The cellulose and lignin concentration maps agree with the biological functions of the anatomic structures observed in the images.
Keywords: Raman image spectroscopy, MCR-ALS, cellulose, lignin, wood analysis
Introduction
Wood is a heterogeneous material with a wide application in several industrial and domestic segments. Cellulose, hemicelluloses and lignin are the major constituents of wood and are present in the whole cell wall.1,2
Cellulose is a crystalline polysaccharide formed by (1-4)-β-D-glucopyranose units. It is resistant to hydrolysis, the structural basis of cell wall and the most abundant polymeric compound in plants. On the other hand, hemicelluloses present a random and an amorphous structure that is easily hydrolyzed by diluted acids or bases. The hemicelluloses are composed of various units of sugars produced in the wood and other plant tissues that include the sugars with five and six carbon atoms, being associated with cellulose and lignin.2
Lignin is derived from condensation reactions of three major subunit precursors, the p-coumaryl alcohol, coniferyl alcohol and syringyl alcohol monolignols. This compound represents the third most abundant group of carbohydrates in plant cell walls, after cellulose and hemicelluloses.3-5
Wood represents the main raw material in many industrial segments, such as paper, building, furniture and art industry. Depending on the application different characteristics or physical properties are required for the wood. This variation in the wood properties is observed in many different wood species present in the market. In this context, Eucalyptus represents an important forest genus due to its large planted area and rapid growth, as well as its potential use in paper industry.6,7 Differently,
Mahogany (Swietenia macrophylla King) presents a wide application in the furniture and art industries due to its beauty, dimensional stability, easy workability, durability and other physical properties.8
Nowadays, due to the importance of wood in the different sectors, genetic studies have been carried out to improve the desired characteristics of woods. These genetic improvements may change the proportion of the main components of the wood and their distribution in the different tissues or anatomic structures. Therefore, analytical methods that provide this kind of information are important in the design of genetic modifications.
Analytical methods, such as high performance liquid chromatography (HPLC), gravimetry and Soxhlet extraction
Exploratory Analysis of the Distribution of Lignin and Cellulose in Woods J. Braz. Chem. Soc.
1298
for determination of sugars, insoluble lignin and extractives, respectively, are useful tools to determine the main chemical components of woods and are useful tools to determine the main chemicals where have the ability to generate in situ results. However, these analytical techniques are expensive, time consuming, and in the majority of cases, destructive, once they require the digestion of plant tissue.9,10
Spectroscopic methods, such as near infrared (NIR), middle infrared (MIR), Raman, and molecular fluorescence have been used in the investigation of the cell wall of plants, presenting the ability to generate in situ nondestructive chemical images.9,11,12,14
Raman image spectroscopy is a powerful tool in the determination of the chemical composition of wood, presenting the ability to provide the spatial distribution of constituents, especially the cellulose and lignin, once these components show specific signals in the Raman spectra. Sun et al.15 presented an interesting study applying Raman
imaging in microscopic scale for the chemical composition of the specie E. globulus. In this study, the authors were able to perform the analysis chosen specific wavenumbers.15
However, due to the wood complexity, the spectroscopic signals may be overlapped in many cases, preventing the use of univariate approaches in the data analysis.10,16
The species Swietenia macrophylla King (Mahogany) and the Eucalyptus are commercially explored in the Brazilian market of woods. As far as we know, there is no report in the literature presenting the distribution of cellulose and lignin in these woods, using chemical imaging by Raman spectroscopy and chemometrics methods. In this sense, the aim of this work is the aplication of Raman image spectroscopy and multivariate curve resolution-alternating least squares (MCR-ALS) analysis to determine the distribution of cellulose and lignin in these wood species. Experimental
Sample Preparation
The Eucalyptus hybrid (E. urophylla × E. camaldulensis) were collected at the Itapoã Farm (District of Paraopebas, Minas Gerais State, Brazil) and Swietenia macrophylla King (Mahogany) was obtained in the year of 1992 in Brasília, Federal District, Brazil.
The species were botanically identified at the Forest Products Laboratory in Brasília registered as FPBw in the Index Xylariorum.17 Transversal sections of 1.0 cm by
0.5 cm by 20 µm thick of the wood samples were prepared using a sliding microtome. Before the Raman analysis each small transversal section with 20 µm thick was sequentially extracted with acetone:water (9:1), toluene:ethanol (2:1),
and methanol for 30 minutes in each solvent.10,18 After the
extraction procedure the sections were identified, air-dried and placed in a microscope slide. All used solvents were of analytical grade purchased from Fischer Scientific and Sigma-Aldrich. The extraction process was necessary to remove or reduce the concentration of the extractives of the samples. These compounds provide significant background variation due the fluorescence, which difficult the Raman analysis.
The Eucalyptus species used in this study was chosen due to its importance for the paper and pulp as well as the energetic industries while Mahogany was chosen for being the world’s most valuable tropical timber, which was included on the Appendix II of the Convention of International Trade in Endangered Species of Wild Fauna and Flora (CITES) in 2003 due to its extensive logging.19
Determination of cellulose and lignin by the reference method
The cellulose determination by the reference method was based on the sum of the concentrations of the sugars of linear chain: glucose and the polysaccharides xylose, galactose, arabinose and mannose. These compounds were determined by high performance liquid chromatography adapted from the method described by Kaar et al.20 and
Ruiz and Ehrman.21,22
The insoluble and soluble lignin was determined adapted from the procedures described by Templeton and Ehrman.23,24 The total lignin represents the sum of soluble
and insoluble lignin.
Raman image spectroscopy analysis
An InVia Raman system (Renishaw) was used in the present study. This spectrometer was equipped with a confocal microscope (Leica) using a 20X objective lens and a CCD detector. Furthermore, an AlGaAs diode laser (Renishaw) emitting at 785 nm was used. The spectra were collected in the range of 723 to 1817 cm-1 with a nominal
resolution of 4 cm-1 using the Streamline acquisition mode.
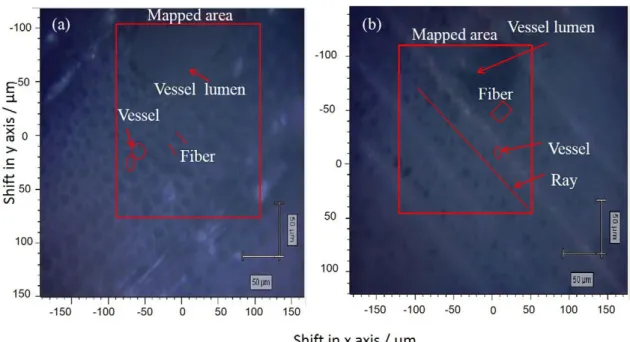
The laser power was set at 100%. For the sample analysis, each microscope slide containing the transversal section was placed in the equipment and the central region was selected for the mapping (Figures 1a and 1b).
Multivariate curve resolution method applied to image spectroscopy
The multivariate curve resolution-alternating least squares method is based on the bilinear model that can be mathematically written as:
D = CST + E (1)
where D is the raw data matrix, C is the matrix of relative intensity profiles and ST the matrix of the estimated pure
spectra. E accounts for the experimental error contained in the raw data.25-27
Spectroscopic images are defined by three informative directions: the spectral direction and two spatial directions, related to the x- and y-coordinates of each pixel. Thus, the spectra collected in each pixel characterize chemically
the constituents of the image and this information and the pixel position in the sample provide spatial-related compositional description of the sample, such as shown in Figure 2. Images are often displayed as cubes (x, y and λ), but their mathematical description does not require any three-dimensional model.
The goal of MCR-ALS applied to spectroscopic images is the decomposition of the original raw image into the distribution maps and pure spectra of the constituents.27-32
Figure 1. White light image of transversal sections spectral mapped areas (a) Mahogany; (b) Eucalyptus.
Exploratory Analysis of the Distribution of Lignin and Cellulose in Woods J. Braz. Chem. Soc.
1300
In this work, the data were analyzed by MCR-ALS and all calculations were performed with Matlab (version 7.12 R2011a) using the MCR-ALS toolbox.33
The successful application of MCR-ALS requires: (i) an estimation of the number of significant components (NC) (or rank estimation); (ii) an initial estimation of either the concentration or spectral profiles of these components; (iii) the selection of appropriate constraints for the ALS optimization; and (iv) the ALS optimization itself. MCR-ALS has been discussed in previous references.25,27,28,34 Thus, only a brief description of each
step will be presented here.
Determination of the number of components (NC)
The number of components for MCR-ALS analysis can be initially estimated from the previous knowledge of the investigated system or from the results obtained by singular value decomposition (SVD) of the data matrix. In the first approach, the number of components is estimated from the number of chemical species expected to be present in the sample or the data. SVD analysis can confirm this preliminary knowledge of the system unless rank deficiencies25,27,35 and additional interferences are present.
It is assumed that in absence of rank deficiency problems, the number of significant components (either physical or chemical) should represent larger singular values than those related to data noise.
Initial estimates
The initial estimates for either the concentration or spectral modes for the previously selected number of components for the MCR-ALS analysis can be obtained by the method based on the detection of purest variables in the data set.33 An iterative resolution method oriented to
recover the underlying spectroscopic bilinear model, i.e., concentration profiles (folded back into distribution maps) and pure spectra, by applying constraints related to chemical or mathematical properties of the profiles to be resolved.37
Constraints
During the ALS optimization, to obtain physically meaningful solutions, the iterative calculation of C and ST
matrices (by equations 2 and 3) is subjected to constraints, which can be imposed based either on previous chemical knowledge of the system or on natural restrictions of experimental systems like non-negativity. In this work, non-negativity constraint was applied in all cases for both concentration and spectral profiles.
ALS optimization
The ALS algorithm starts the optimization using either equations 2 or 3 depending on whether the initial estimates for the concentration C = Cinic, or for spectral profiles
ST = ST
inic were used.25,27,28
ST = C+D (2)
C = D(ST)+ (3)
where “+” indicates the pseudoinverse operation. The optimization procedure iterates the two steps described by equations 2 and 3 using the previously estimated values in an alternating least squares way under constraints (see below) trying to minimize the residual matrix E until convergence.25,27,30,35
Afterward, the identification of each component was performed by the identification of specific Raman signals with the information present in the literature.9-12,16,18
The estimates of the concentrations in each pixel (yi) were obtained by the direct relation between the average concentration of cellulose (–ycell) and lignin (–ylig), obtained by the reference method, and the average relative intensity estimated for cellulose (–Icell) and lignin (–Ilig) by the MCR-ALS (average of the relative intensity of all pixels of the concentration map for each constituent). For example, given the relative intensity for cellulose in the pixel i (Icell,i),
the concentration in this pixel for cellulose (ycell,i) was obtained by ycell,i = (Icell,i × –ycell) /
–
Icell). The same procedure
was applied for other pixels. Results and Discussion
Results of cellulose and lignin by the reference method
The contents of cellulose and lignin as obtained by the reference method are shown in Table 1. The results indicate that both wood species contain similar concentrations of cellulose and lignin. It should be noted that depending on the Eucalyptus specie, the average concentrations of cellulose and lignin could vary, since there are species genetically modified for paper pulp and energy purposes. Therefore, as the Eucalyptus specie used in this study was genetically modified for the energy industry, it presents average lignin and cellulose similar to Mahogany. The results in percent of cellulose and lignin obtained by the reference methods were used as the average or global concentration in each species.
In Table 1 it is possible to observe that the concentrations of cellulose and lignin add to above 100%, suggesting that the reference method present a significant estimation error.
The classical methods for analysis of wood components, rely on empirical procedures, which rarely generate results that sum to 100%. For example, Holocelluloses (that represents the combination of the cellulose with hemicelluloses), always contain residuals of lignin. At the same time, the lignin determination has also several shortcomings that apparently elevate (most common) or diminish (seldom) the true lignin content. It is important to note that there is a lack of information in the literature about the chemical composition of these species. Furthermore, the chemical composition of wood depends on different variables such as: geographic location, climate, soil and age. Therefore, it was considered that the results obtained are in agreement with the results observed in other references.38
Preprocessing data
For each species, the spectral mapped area was
approximately equal to 4.0 mm2. For Mahogany and
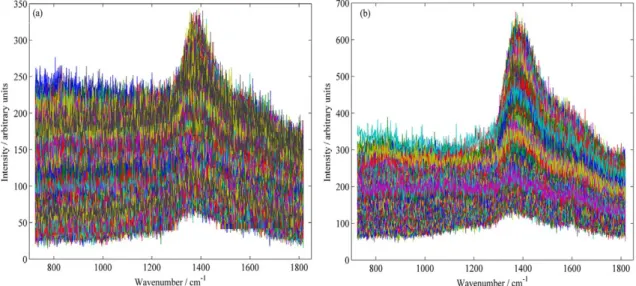
Eucalyptus, the data matrix was composed of 2499 and 3162 spectra, respectively. Raw data spectra are presented in Figures 3a and 3b.
It can be observed in Figure 3 significant spectral noise and baseline variations. The poor signal to noise ratio is due to the acquisition mode selected (the streamline). In the streamline mode, a cylindrical lens is used causing a
significant reduction in the laser power density (W cm-2)
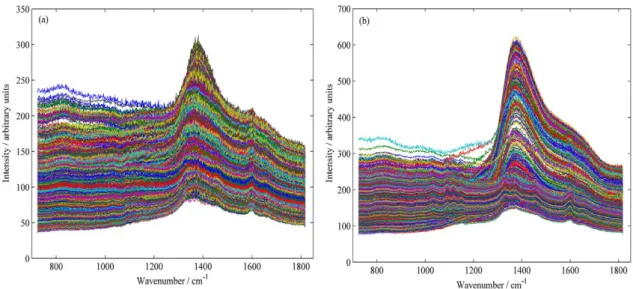
arriving to the sample. The fluctuation in the baseline can be assigned to the presence of fluorescence in the sample and its heterogeneity. In order to reduce the noise present in the raw spectral data, before the MCR-ALS analysis, a filter based on the principal components analysis (PCA) was applied. The number of components used in this preprocessing was established by visual inspection of the loading vectors. When only noise was observed in a specific loading vector, the immediately previous number of components was selected. It was assumed that the number of components capture all the systematic variations (the chemical information) in the data. For both species, 7 components were used. Moreover, the PCA models used for data filtering explained more than 99% of the total variance in both species. Figures 4a and 4b illustrate the spectral data after applying the filter to the row spectra of Mahogany and Eucalyptus, respectively, revealing a significant improvement in the signal to noise ratio.
Cellulose and lignin determination by MCR-ALS
The MCR-ALS was applied to the data presented in Figure 4. The presence of specific bands of these compounds was verified by comparison with data reported in the literature.5,10,18
For Mahogany and Eucalyptus, four different components were chosen based on the explained variance and on the results for the estimated spectra of cellulose and lignin. It is important to note that the number of components used in the MCR-ALS analysis was lower than the one used on the PCA filter step. This can be justified because in the filter step a higher number of components was applied to ensure that any chemical information was lost. However,
Table 1. Cellulose and lignin values obtained by the reference method
for wood species
Wood species Percentage / m/m
Cellulose Total lignin
Eucalyptus 62.79 28.68
Mahogany 57.25 26.46
Exploratory Analysis of the Distribution of Lignin and Cellulose in Woods J. Braz. Chem. Soc.
1302
the last three PCs were not significant for the MCR-ALS analysis. To prove this fact, the MCR-ALS was repeated with five components and only noise or highly correlated components were observed.
Figures 5a-d present the Raman spectra as recovered by MCR-ALS. The first recovered Raman spectrum (Figure 5a) was attributed to cellulose by the identification of characteristic Raman signals of this compound at 1098 cm-1, 1123 cm-1 and 1150 cm-1 (C−C and C−O
stretching, H−C−C twist) and 1378 cm-1(H−O−C twist).
Furthermore, the second recovered Raman spectrum (Figure 5b) was attributed to lignin due to the presence of the specific Raman signals at 1600 cm-1 and 1330 cm-1.5,10,16
The signal at 1600 cm-1 is assigned to the symmetric
stretching of aromatic rings present in lignin. The Raman signal at 1330 cm-1 corresponds to the vibration Aril−OH
or Aril−O−CH3 which is present in coniferyl alcohol
connection.16
The third recovered spectrum (Figure 5c) was attributed to the background variation, which was related to the
Figure 4. Data matrix spectra after filter based on principal component analysis for: (a) Mahogany; (b) Eucalyptus.
presence of extractives (probably the main responsible for fluorescence in the wood). Furthermore, this group of compounds contain aromatic structures that could also contribute to the Raman signal near 1600 cm-1, which could
lead to overlapping with the main lignin band. In order to minimize the fluorescence signal, an extraction procedure was applied to the samples. Even though, a significant background variation due the fluorescence was observed, but it was modeled by the MCR-ALS.
The last recovered spectrum (Figure 5d) presents a broad feature centered at 1390 cm-1. The relative intensity
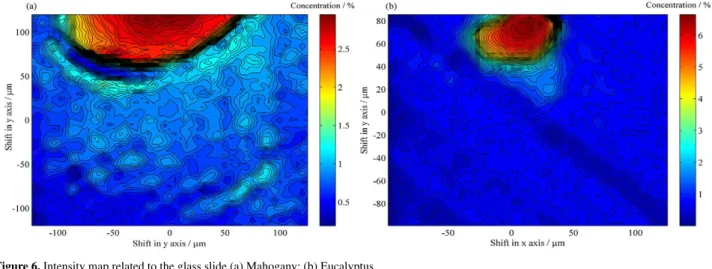
maps of this component (Figures 6a and 6b) show that this signal is above the noise level only in the lumen of the vase. The comparison between the Raman spectrum of the slide glass with the recovered spectrum of the fourth component leads to a perfect match. Therefore, this component is related to the glass slide that was used as support for micrometric samples of species studied. The same result was obtained for both wood species.
The cellulose and lignin concentration maps for Eucalyptus are presented in Figures 7a and 7b, respectively.
In this case, the maps are presented in percentage units, once the average concentration determined by the reference method enables the estimation of the concentration in each pixel. The results of global concentrations (Table 1) of cellulose for Eucalyptus and Mahogany were 62.79 and 57.25%, and for lignin were 28.68 and 26.46%, respectively. The mapped area contains vessel, ray, fibers and the vessel lumen.
The map of cellulose (Figure 7a) presents concentrations varying from 50% to values above 100%. These regions with percentage values above 100% can be attributed to an estimation error caused by pixels of specific regions with concentration values much larger than the mean/global concentration estimated by the reference method, which can represent a bias in the results. Considering the distribution of cellulose in the mapped area, it can be observed that with exception of the region of the vessel lumen of the vase, the cellulose is present in almost all mapped region, especially in the region between radiuses and fibers (see Figure 1a). Figure 7b shows the concentration map of lignin, which presents values varying from 20 to 35%. Higher lignin
Figure 6. Intensity map related to the glass slide (a) Mahogany; (b) Eucalyptus.
Exploratory Analysis of the Distribution of Lignin and Cellulose in Woods J. Braz. Chem. Soc.
1304
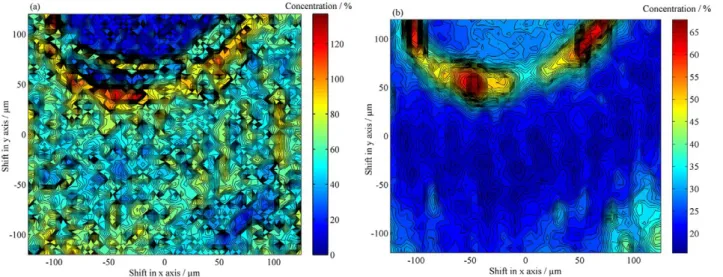
Figure 8. Concentration maps for (a) cellulose and (b) lignin for the specie Mahogany.
contents are observed in the ray region, indicating that this anatomic structure is richer in lignin.
The same analysis was performed for Mahogany, where the Figures 8a and 8b show concentration maps of cellulose and lignin, respectively. Results for cellulose (Figure 8a) show concentrations varying from 40 to above 100% in the fibers and ray. However, the region that presents the highest percentage of cellulose is located around the vessel lumen.
The concentration map for lignin in Mahogany (Figure 8b) shows percentages of approximately 25% in most of the mapped region, which include the fibers and vessel. Differently from the Eucalyptus, the highest percentage of lignin in the Mahogany species investigated was observed around the lumen of the vessel, with specific regions showing lignin contents varying from 45 to 65%. However, in the ray (bottom right corner in Figure 8b) percentages varying from 35 to 40% are observed, which was also observed for Eucalyptus.
The observed distributions for cellulose and lignin confirm the constitution of anatomical structures, once the fibers correspond to sustentation tissue, formed by the deposition of cellulose, and other fibril components as lignin and hemicelluloses. Furthermore, in the ray and the region around the vessel lumen it is common to have accumulation of substances related with the plant nutrition.2,12,39,40
Therefore, it can be concluded that the Raman images obtained are related to the variability of concentrations of cellulose and lignin between morphological regions. Conclusions
Raman image spectroscopy in conjunction with chemometric methods was successfully used to investigate
the distribution of lignin and cellulose in two different species of wood, Mahogany and Eucalyptus. The Raman spectra of cellulose and lignin as recovered by MCR-ALS presented characteristic Raman signals of these compounds. These characteristic Raman signals were used to estimate the distribution of cellulose and lignin concentration in the microscopic level as concentration maps. These concentration maps indicate that the percentages of cellulose and lignin are in reasonable agreement with the values obtained by the reference method. Differently from the reference method, the concentration maps show that the cellulose and lignin contents varied between the distinct anatomical regions and agree with the function of these structures.
Finally, traditional analytical methods for chemical analysis in wood are labor-intensive, destructive and provide only the global concentration estimation. The importance of this work is that the application of Raman image spectroscopy in conjunction with MCR-ALS allow to obtain in situ identification and distribution estimation of cellulose and lignin in microscopic scale, which provide local information that can help to observe modifications in the species promoted by genetic improvements and to predict the chemical information of wood species. Acknowledgement
Authors would like to thank LPF-SFB, FAPDF, CNPQ (307223/2012-4), CAPES and INCTBio.
References
1. Severo, E. T. D.; Calonego, F. W.; Sansígolo, C. A.; Silva Lusit. 2006, 126, 113.
2. Fengel, D.; Wegener, G.; Wood: Chemistry Ultrastructure
Reactions; Walter de Gruyter & Co.: Berlin, 1984.
3. Bonawitz, N. D.; Chapple, C.; Annu. Rev. Genet. 2010, 44, 337. 4. Zhao, Q.; Dixon, R. A.; Trends Plant Sci. 2011, 16, 227. 5. Ji, Z.; Ma, J. F.; Zhang, Z. H.; Xu, F.; Sun, R. C.; Ind. Crop.
Prod. 2013, 47, 212.
6. Brisolal, H. S.; Demarco, D.; Sci. For. 2011, 39, 317. 7. Morais, S. A. L.; Nascimento, E. A.; Melo, D. C.; Rev. Árvore
2005, 9, 461.
8. Lunz, A. M.; Thomazini, M. J.; Morais, M. C. B.; Neves, E. J. M.; Batista, T. F. C.; Degenhardt, J.; Souza, L. A.; Ohashi, O. S.; Pesquisa Florestal Brasileira 2009, 59, 45.
9. Ma, J.; Zi, J.; Zhou, X.; Zhang, Z.; Xu, F.; Microsc. Microanal.
2013, 19, 243.
10. Agarwal, U. P.; Planta 2006, 224, 1141.
11. Gierlinger, N.; Schwanninger, M.; Plant Physiol. 2006, 140, 1246.
12. Nuopponen, M.; Willför, S.; Jääskeläinen, A. S.; Sundberg, A.; Vuorinen, T.; Spectrochim. Acta 2004, 60, 2953.
13. Ona, T.; Sonoda, T.; Ito, K.; Shibata, M.; Kato, T.; Ootake, Y.;
J. Wood Chem. Technol. 1997, 17, 399.
14. Ona, T.; Sonoda, T.; Ito, K.; Shibata, M.; Katayama, T.; Kato, T.; Ootake, Y.; J. Wood Chem. Technol. 1998, 18, 41.
15. Sun, L.; Simmons, B. A.; Singh, S.; Biotechnol. Bioeng. 2011,
108, 295.
16. Hänninen, T.; Kontturi, E.; Vuorinen, T.; Phytochemistry 2011,
72, 1889.
17. Stern, W. L.; IAWA J. 1988, 9, 203.
18. Agarwal, U. P.; Reiner, R. S.; J. Raman Spectrosc. 2009, 40, 1527.
19. Grogan, J.; Barreto, P.; Conserv. Biol. 2005, 19, 973. 20. Kaar, W. E.; Cool, L. G.; Merriman, M. M.; Brink, D. L.; J. Wood
Chem. Technol. 1991, 11, 447.
21. Ruiz, R.; Ehrman, T.; Determination of Carbohydrates in
Biomass by High Performance Liquid Chromatography; National Renewable Energy Laboratory: Golden, CO, 1996. 22. Ruiz, R.; Ehrman, T.; HPLC Analysis of Liquid Fractions of
Process Samples for Byproducts and Degradation Products; National Renewable Energy Laboratory: Golden, CO, 1996.
23. Templeton, D.; Ehrman, T.; Determination of Acid-Insoluble
Lignin in Biomass; National Renewable Energy Laboratory: Golden, CO, 1995.
24. Templeton, D.; Ehrman, T.; Determination of Acid-Soluble
Lignin in Biomass; National Renewable Energy Laboratory: Golden, CO, 1995.
25. Tauler, R.; Chemom. Intell. Lab. Syst. 1995, 30, 133. 26. Jaumot, J.; Gargallo, R.; de Juan, A.; Tauler, R.; Chemom. Intell.
Lab. Syst. 2005, 76, 101.
27. de Juan, A.; Tauler, R.; Crit. Rev. Anal. Chem. 2006, 36, 163. 28. Geladi, P.; Grahn, H.; Multivariate Image Analysis in Chemistry
and Related Areas, 1st ed.; Wiley: New Jersey, USA, 1996.
29. de Juan, A.; Maeder, M.; Hancewicz, T.; Tauler, R.; J. Chemom.
2007, 21, 7.
30. de Juan, A.; Maeder, M.; Hancewicz, T.; Tauler, R.; J. Chemom.
2008, 22, 291.
31. Piqueras, S.; Burger, J.; Tauler, R.; de Juan, A.; Chemom. Intell.
Lab. Syst. 2012, 117, 169.
32. Vidal, M.; Amigo, J. M.; Chemom. Intell. Lab. Syst. 2012, 117, 138.
33. http://www.mcrals.info/, accessed in April 2015. 34. Tauler, R.; J. Chemom. 2002, 16, 117.
35. Brown, S. D.; Walczak, B.; Tauler, R.; Comprehensive
Chemometrics: Chemical and Biochemical Data Analysis, 1st ed.; Elsevier: Amsterdam, 2009.
36. Windig, W.; Guilment, J.; Anal. Chem. 1991, 63, 1425. 37. Piqueras, S.; Duponchel, L.; Tauler, R.; de Juan, A.; Anal. Chim.
Acta 2011, 705, 182.
38. Santana, M. A. E.; Okino, E. Y. A.; Holzforschung 2007, 61, 477.
39. Rowell, R. M.; Handbook of Wood Chemistry and Wood
Composites, 2nd ed.; CRC Press: London, New York, 2012.
40. Gierlinger, N.; Luss, S.; Konig, C.; Konnerth, J.; Eder, M.; Fratzl, P.; J. Exp. Bot. 2009, 61, 587.
Submitted: January 18, 2015 Published online: April 24, 2015