Evaluation of waist circumference
to predict general obesity and arterial
hypertension in women in Greater
Metropolitan Belo Horizonte, Brazil
Avaliação da capacidade preditiva da
circunferência da cintura para obesidade global
e hipertensão arterial em mulheres residentes
na Região Metropolitana de Belo Horizonte, Brasil
1 Departamento de Enfermagem Materno Infantil e Saúde Pública, Escola de Enfermagem, Universidade Federal de Minas Gerais. Av. Alfredo Balena 190, Belo Horizonte, MG 30130-100, Brasil. [email protected] 2 Departamento de Nutrição Social e Aplicada, Instituto de Nutrição Josué de Castro, Universidade Federal do Rio de Janeiro. Av. Brigadeiro Trompowsky s/n, Bloco J, Rio de Janeiro, RJ 21941-590, Brasil. 3 Departamento de Epidemiologia e Métodos Quantitativos em Saúde, Escola Nacional de Saúde Pública, Fundação Oswaldo Cruz. Rua Leopoldo Bulhões 1480, Rio de Janeiro, RJ, 21041-210, Brasil.
4 Instituto de Medicina Social, Universidade do Estado do Rio de Janeiro. Rua São Francisco Xavier 524, Bloco D, Rio de Janeiro, RJ 20559-900, Brasil. 5 Instituto de Ciências Exatas, Universidade Federal de Minas Gerais. Av. Antônio Carlos 6627, Belo Horizonte, MG 31270-901, Brasil. 6 Escola de Educação Física, Universidade Federal de Minas Gerais. Av. Antônio Carlos 6627, Belo Horizonte, MG 31270-901, Brasil.
Gustavo Velásquez-Meléndez 1 Gilberto Kac 2
Joaquim Gonçalves Valente 3,4 Roberta Tavares 1
Cibele Queiroz da Silva 5 Emerson Silami Garcia 6
Abstract This study examined the capacity of waist circumference ( WC) to identify subjects with overweight (BMI ≥25) and obesity (BMI ≥30), in agreement with internationally recom-mended levels of action. Data were obtained from 791 women, 15-59 years old. After identifying overweight and obesity according to WC values, sensitivity and specificity were calculated to ver-ify whether WC could be a good risk predictor for hypertension. Associations were tested by lin-ear regression and logistic regression, controlling for confounding. WC cut-off points of 80cm and 88cm correctly identified 89.8% and 88.5% of women with overweight and obesity, respec-tively. Abdominal obesity (WC ≥88cm) was statistically associated with hypertension in the mul-tivariate analysis (OR = 2.88; 95% CI: 1.77-4.67). Hypertension was identified with a sensitivity of 63.8% and 42.8%, and with a specificity of 68.0% and 83.3%, for WC ≥80 and ≥88, respective-ly. The proposed cut-off points for abdominal obesity can potentially distinguish individuals at risk for future obesity, but has only moderate power to predict individuals with high blood pres-sure.
Key words Obesity; Women’s Health; Hip; Hypertension; Body Mass Index
Resumo Avaliou-se a capacidade que a Circunferência da Cintura (CC) tem em identificar va-lores de IMC ≥25 (sobrepeso) e ≥30 (obesidade) a partir de níveis de ação recomendados inter-nacionalmente. Setecentas e noventa e uma mulheres entre 15-59 anos foram recrutadas. Foram calculadas a sensibilidade e a especificidade no diagnóstico de sobrepeso e obesidade e a sensi-bilidade e especificidade na predição da hipertensão, a partir de valores de CC. As associações foram testadas por análise de regressão linear e regressão logística controlando para o efeito de fatores de confusão. A CC ≥80 e ≥88cm discriminou corretamente 89,8% de mulheres com IMC ≥ 25 e 88,5% com IMC ≥30. A obesidade abdominal (CC ≥88cm) esteve associada significativa-mente com a hipertensão na análise multivariada (OR = 2,88, IC 95%: 1,77-4,67). A hipertensão foi identificada com sensibilidade de 63,8 e 42,8% e especificidade de 68,0 e 83,3% para CC ≥80 e ≥88, respectivamente. A obesidade abdominal nos pontos de corte propostos pode discriminar adequadamente indivíduos em risco de se tornarem obesos, no entanto, apresenta um poder apenas moderado para discriminar indivíduos com níveis pressóricos altos.
Introduction
In recent decades a major increase has been re-ported in the prevalence of overweight and obesity in different regions of Brazil, both in men and women and from all social classes. This phenomenon has been detected by vari-ous population surveys conducted in the last 25 years (INAN, 1991; Monteiro & Conde, 1999). The mechanisms underlying this trend are still unknown, although researchers have raised hypotheses concerning the consumption of denser diets and a reduction in the level of en-ergy expenditure.
Various cross-sectional and longitudinal studies have shown that accumulated abdomi-nal fat is associated with increased risk of non-communicable diseases, especially cardiovas-cular diseases, coronary arteriosclerosis, and overall mortality, in addition to insulresis-tance syndrome, hypertriglyceridemia, and in-creased low density lipoprotein levels (Folson et al., 2000; Lapidus et al., 1984).
Diagnosis of overweight and obesity using simple indicators like body mass index (BMI) is extensively consolidated in the literature (WHO, 1998). Despite its limitations, this indicator has been systematically utilized in epidemiological studies for the diagnosis and evaluation of sec-ular trends in overweight/obesity in children and adults (Monteiro et al., 2000; WHO, 1990). Due to the seriousness of the problem, there is an intensive search for even simpler, more pre-cise, and more sensitive methods to adequate-ly diagnose excess body fat, associating it with key health problems, to ultimately foster the implementation of preventive and intervention measures. Although there are sophisticated methods like computed imaging techniques for the precise measurement of body fat, such methods are still scarcely feasible in epidemio-logical studies.
In the 1990s, Han et al. (1995) proposed that waist circumference (WC) ≥80cm (action level 1) and WC ≥88cm (action level 2) be used as cut-off points to identify women with over-weight and obesity, respectively. The action levels were also felt to be indicative for recom-mending individual weight control and health promotion in women (Han et al., 1995; Lean et al., 1995). According to a different view, these levels might reflect only the populations that generated them and were thus probably not applicable to the diversity of the overall Brazil-ian population (Gus et al., 1998; Okosun et al., 2000; Velásquez-Meléndez et al., 1999).
The objective of this study was thus to eval-uate the capacity of WC to distinguish
individ-uals with overweight and obesity, in addition to testing its association with arterial hyperten-sion using cut-off points proposed in the liter-ature.
Methodology
The current study adopted a cross-sectional design and was conducted at a Municipal Health Center in the city of Belo Horizonte, Mi-nas Gerais, Brazil. The Health Center was cho-sen because it provides daily out-patient care covering residents from the entire Greater Belo Horizonte Metropolitan Area. Participants were female volunteers in apparent good general health, with no chronic or acute metabolic or infectious complaints, who were treated at the various departments of the Health Center, with the objective of obtaining a wide range of age and BMI values. Data were gathered from Jan-uary to July 2000, and the initial sample con-sisted of 827 women from 14 to 65 years of age. The sample size was calculated to obtain accu-rate estimates of the probability of overweight/ obesity, given a set of covariables (Flack & Eudey, 1993). For the current analysis, we excluded women under 15 and over 59 years of age (n = 36), producing a final sample of 791 individuals. A questionnaire containing standardized questions on various aspects characterizing the sample (current and past disease, use of med-ication, life style, schooling, smoking, demo-graphic and socioeconomic factors, and ob-stetric history) was applied by trained inter-viewers.
Weight and height were measured with the individuals barefoot and without excess cloth-ing or accessories. Height was measured to the closest 0.1cm, with a stiff tape measure placed vertically on a flat wall, with the subject stand-ing erect and head in the Frankfurt plane (Lohman et al., 1988). Weight was measured with a digital scale (Model PL 150, Filizzola Ltd., Brazil), to the closest 0.1kg. These measure-ments were then used to calculate the body mass index (BMI = weight (kg)/height2). WC
was measured with the subject standing, mid-way between the last rib and the upper edge of the iliac crest, and hip circumference (HC) was measured at the greater gluteal curvature. Both measurements were taken with a stiff fiberglass tape, to the closest 0.1cm. All anthropometric measurements were taken by previously trained anthropometrists, and repeated three times, using the mean value.
the Joint National Committee (JNC, 1997) with aneroid sphygmomanometers, using the indi-rect auscultatory method, with the arm resting at the level of the precordium, using Korotkoff phases I and IV to read the systolic and dias-tolic blood pressure, respectively. Hyperten-sion was defined according to the following cri-teria: systolic blood pressure ≥140mmHg or di-astolic pressure ≥90mmHg (JNC, 1997).
Initial statistical analysis involved the de-scription of target variables with means and standard deviations. Sensitivity, specificity, and positive and negative predictive values and their 95% confidence intervals were calculated to evaluate whether WC appropriately identi-fied individuals with overweight (BMI ≥25) and obesity (BMI ≥30). Bivariate and partial linear regression analysis was used to test possible associations between systolic blood pressure (SBP), diastolic blood pressure (DBP), and an-thropometric variables (WC, BMI, and waist-to-hips ratio – WHR). Logistic regression, with the different WC categories (level 1 ≥80 and level 2 ≥88cm) as independent variables, was used to evaluate the effect of the different WC action levels on hypertension. Both linear gression (partial coefficients) and logistic re-gression used age, schooling, smoking, alcohol consumption, and physical activity as control variables. Age was calculated from the date of birth and included in the model as a continu-ous variable (minimum 15 and maximum 59), as was education (minimum 0 and maximum 21), measured as complete years of schooling. Life style variables were included in dichoto-mous form: current smoking (yes or no), alco-hol consumption at least once a week (yes or no), and practicing a sport (yes or no).
Sensitivity was defined as the proportion of hypertensive individuals correctly identified by the proposed WC cut-off points and specificity as the proportion of non-hypertensive individ-uals correctly identified by values below the proposed WC cut-off points.
All statistical analyses used SPSS version 8.0 (SPSS Incorporation, 1997). Results were con-sidered statistically significant with p values < 0.05. The current project was approved by the research ethics committee at Universidade Fe-deral de Minas Gerais. Written consent was ob-tained from all study participants.
Results
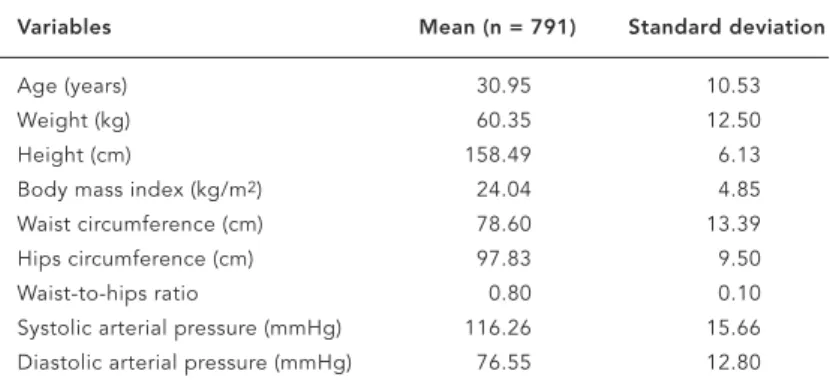
Table 1 shows mean values and standard devi-ations for some anthropometric measurements and blood pressure levels in the sample.
WC values ≥80cm (action level 1) correctly identified 89.8% (95% CI: 85.5-93.1) of women with overweight (BMI ≥25), while WC ≥88cm (action level 2) correctly identified 88.5% (95% CI: 85.5-91.1) of women with obesity (BMI ≥30) (Table 2).
We observed both bivariate and multivari-ate statistically significant positive correlations adjusted for age, schooling, smoking, alcohol consumption, and physical activity between WC, BMI, and WHR and SBP and DBP (Table 3). The weakest correlation coefficients were ob-served between WHR and both blood pressure levels.
Figure 1 shows SBP and DBP data for previ-ously defined WC categories. A clear increase was observed in SBP and DBP with increasing WC. Meanwhile, a slight drop was observed in mean SBP in the 78-81.9cm bracket and in
Table 1
Mean and standard deviation for selected variables in a sample of women. Belo Horizonte, Minas Gerais, Brazil, 2000.
Variables Mean (n = 791) Standard deviation
Age (years) 30.95 10.53
Weight (kg) 60.35 12.50
Height (cm) 158.49 6.13
Body mass index (kg/m2) 24.04 4.85 Waist circumference (cm) 78.60 13.39 Hips circumference (cm) 97.83 9.50
Waist-to-hips ratio 0.80 0.10
Systolic arterial pressure (mmHg) 116.26 15.66 Diastolic arterial pressure (mmHg) 76.55 12.80
Table 2
False positives, false negatives, sensitivity, specificity, and 95% confidence intervals in the identification of individuals with overweight (BMI ≥25kg/m2) and obesity (BMI ≥30kg/m2) based on WC ≥80 and ≥88cm, respectively. Belo Horizonte, Minas Gerais, Brazil, 2000.
Prediction Waist Circumference (cm)
≥80 ≥88
Overall total (n) 298 169
Total hypertensives (n) 27 59
False positives (n) 60 95
False negatives (n) 27 3
mean DBP in the 94-104.9cm bracket as com-pared to the next highest.
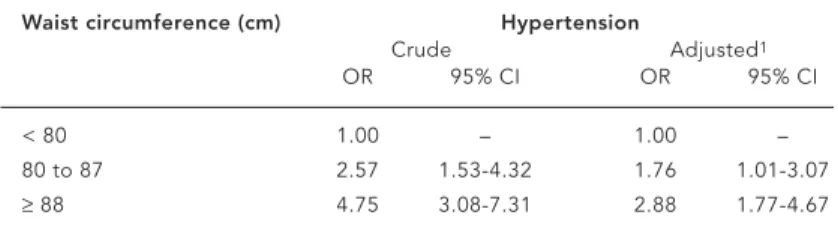
Prevalence of hypertension was 17.4%. An association was observed between abdominal obesity and hypertension. Table 4 shows crude odds ratios and odds ratios adjusted for age, schooling, smoking, alcohol consumption, and physical activity. Abdominal obesity (WC = 80-87cm) was associated significantly with hyper-tension (OR = 2.57; 95% CI: 1.53-4.32), while this association was slightly attenuated when adjusted for other variables (OR = 1.76; 95% CI: 1.01-3.07). When abdominal obesity was
de-Table 3
Crude and adjusted correlation coefficients comparing systolic blood pressure (SBP) and diastolic blood pressure (DBP) with waist circumference (WC), body mass index (BMI), and waist-to-hips ratio (WHR). Belo Horizonte, Minas Gerais, Brazil, 2000.
Anthropometric no. SBP DBP
variables Crude Adjusted1 Crude Adjusted1
WC (cm) 789 0.377 0.264 0.393 0.272 BMI (kg/m2) 790 0.414 0.319 0.413 0.308
WHR 790 0.236 0.115 0.273 0.152
1Adjusted for age, schooling, smoking, alcohol consumption, and physical activity. 2All correlations with p < 0.001.
105 115 125 135 145
57-64.99 65.00-69.99 70.0-73.99 74.0-77.99 78.0-81.99 82.0-85.99 86.0-89.99 90.0-93.99 94.0-104.99 ≥ 105.0 Waist circumference
Systolic blood pressure
65 75 85 95
57-64.99 65.00-69.99 70.0-73.99 74.0-77.99 78.0-81.99 82.0-85.99 86.0-89.99 90.0-93.99 94.0-104.99 ≥ 105.0 Waist circumference
Diastolic blood pressure
Figure 1
Mean values and 95% confidence intervals for systolic blood pressure (a) and diastolic blood pressure (b) in different waist circumference categories. Belo Horizonte, 2000.
Figure 1a
fined as WC ≥88cm, the association with hy-pertension was also statistically significant ac-cording to both bivariate analysis (OR = 4.75; 95% CI: 3.08-7.31) and adjusted analysis (OR = 2.88; 95% CI: 1.77-4.67).
Table 5 shows the predictive capacity (posi-tive and nega(posi-tive predic(posi-tive values) for two WC levels in relation to hypertension. Sensitivity in detecting hypertension was moderate for ac-tion level 1 (63.8%; 95% CI: 55.1-71.7) and low for action level 2 (42.8%; 95% CI: 34.5-54.5), re-spectively. Specificity was lower for action level 1 (68.0%; 95% CI: 64.2-71.5) as compared to ac-tion level 2 (83.3%; 95% CI: 80.2-86.0). In rela-tion to predictive capacity, the positive predic-tive values were low and similar for both levels. Negative predictive values were high and were also similar for both levels.
Discussion
Recent Brazilian and international research has called attention to the secular increase in the prevalence of overweight in various mod-ern societies currently in transition (WHO, 1998). This increase has led to great concern among governments and international public health agencies.
A study by Vague (1956) was the first to dif-ferentiate the risk of abnormal regional fat de-posits, identifying the risk of abdominal fat ac-cumulation. Recent data show that waist cir-cumference is adequately correlated with fat located in the abdominal region (Despres et al., 1991; Lemieux et al., 1996; Pouliot et al., 1994), which in turn is associated with various health problems (Folson et al., 1990; Han et al., 1998). This measurement was recently identified as the best indicator for evaluating the risk of car-diovascular diseases in epidemiological studies (Mollarius & Seidell, 1998). However, there is still no consensus concerning the definition of cut-off points for abdominal adiposity to adequate-ly identify the risk of cardiovascular diseases.
The data presented in this study support and strengthen the validity of using WC to identify overweight and obesity, with the ad-vantage of being a simple and easy measure-ment. Waist circumference sensitivity, speci-ficity, and predictive values proved satisfactory for diagnosing overweight and obesity at the levels proposed in the literature. However, it is important to exercise caution in using these findings, since in a US population of white, black, and Hispanic women, the WC values corresponding to overweight and obesity var-ied considerably, ranging from 80 to 90cm,
which can lead to a major reduction in the pre-cision of estimates (Okosun et al., 2000).
In this study, WC, BMI, and WHR showed a positive correlation with blood pressure. It was interesting to note that WC showed a correla-tion quite similar to that of BMI, while the cor-relation was weaker for WHR, confirming re-sults from previous studies (Mollarius & Sei-dell, 1998; Pouilot et al., 1994). The odds ratio for hypertension after adjusting for covariables was 2.88 for women with WC ≥88cm. The group of women with intermediate WC levels showed an excess risk of 76% as compared to women with WC less than 80cm. However, the positive predictive value of WC for hypertension can be considered low. Sensitivity was moderate for action level 1 and low for level 2.
Two similar population-based studies have been conducted in Brazil. In one, hypertension was associated equally with abdominal obesity, WHR, and overweight (Gus et al., 1998). In the other, a WHR of 0.80 adequately differentiated women at risk of hypertension (Pereira et al., 1999).
Table 5
Sensitivity, specificity, and positive and negative prediction for hypertension according to waist circumference (WC) action levels. Belo Horizonte, Minas Gerais, Brazil, 2000.
Prediction WC ≥80cm WC ≥88cm
% 95% CI % 95% CI
Sensitivity 63.8 55.1-71.7 42.8 34.5-54.5 Specificity 68.0 64.2-71.5 83.3 80.2-86.0 Positive predictive value 29.6 24.6-35.2 35.1 28.0-42.9 Negative predictive value 89.9 86.8-92.3 87.3 84.4-89.8 Table 4
Crude and adjusted odds ratios (OR) and 95% confidence intervals (95% CI) for hypertension and two waist circumference action levels. Belo Horizonte, Minas Gerais, Brazil, 2000.
Waist circumference (cm) Hypertension
Crude Adjusted1
OR 95% CI OR 95% CI
< 80 1.00 – 1.00 –
80 to 87 2.57 1.53-4.32 1.76 1.01-3.07 ≥88 4.75 3.08-7.31 2.88 1.77-4.67
Some limitations to this study should be identified. First, the research was conducted with volunteers and non-probabilistic sam-pling, a factor that could limit extrapolation of the findings. Second, it only presents data for women.
In general, waist circumference with rec-ommended cut-off points (Han et al., 1995; WHO, 1998) presents adequate power to differ-entiate individuals with overweight and obesi-ty, with the advantage of not using mathemati-cal formulas or ratios to define it, like BMI and WHR. Although WC was significantly associat-ed with hypertension in the current study, the WC cut-off points evaluated here (80 and 88cm) showed moderate and low sensitivity,
respectively, and low positive predictive values for hypertension, which would lead to a rea-sonable number of individuals inadequately identified for risk of hypertension, thus limit-ing the use of these cut-off points for proper, low-cost screening of health risks in popula-tion groups.
In short, we conclude that further studies are needed, simultaneously evaluating sets of cut-off points in various Brazilian population groups from different age brackets and both sexes, especially investigating the balance be-tween sensitivity and specificity, allowing for the identification of more appropriate cut-off points for the overall national population.
Acknowledgments
We wish to thank the Office of the Dean of Research at Universidade Federal de Minas Gerais and the Brazilian National Research Council – CNPq (Grant No. 300721/94-3) for funding this project.
References
DESPRES, J. P.; PRUD’HOMME, D.; POULIOT, M. C.; TREMBLAY, A. & BOUCHARD, C., 1991. Estima-tion of deep abdominal adipose tissue anthropo-metric measurements in men. American Journal of Clinical Nutrition, 54:471-477.
FLACK, V. F. & EUDEY, T. L., 1993. Sample size deter-minations using logistic regression with pilot da-ta. Statistics in Medicine, 12:1079-1084.
FOLSON, A. R.; KUSHI, L. H.; ANDERSON, K. E.; MINK, P. J.; OLSON, J. E.; HONG, C. P.; SELLERS, T. A.; LAZOVICH, D. & PRINEAS, R. J., 2000. Asso-ciations of general abdominal obesity with multi-ple health outcomes in older women: The Iowa Women’s Health Study. Archives of Internal Medi-cine, 160:2117-2128.
FOLSON, A. R.; PRINEAS, R. J.; KAYE, A. S. & MUNGER, R., 1990. Incidence of hypertension and stroke in relation to body fat distribution and other risk factors in older women. Stroke, 21:701-706. GUS, M.; MOREIRA, L. B.; PIMENTEL, M.;
HAN, T. S.; FESKENS, E. J.; LEAN, M. E. & SEIDELL, J. C., 1998. Associations of body composition with type 2 diabetes mellitus. Diabetes in Medicine, 15:129-135.
HAN, T. S.; VAN LEER, E. M.; SEIDELL, J. C. & LEAN, M. E., 1995. Waist circumference action levels in the identification of cardiovascular risk factors: Prevalence study in a random sample. BMJ, 311: 1401-1405.
JNC ( Joint National Committee), 1997. The sixth re-port of the Joint National Committee on preven-tion, detecpreven-tion, evaluapreven-tion, and treatment of high blood pressure. Archives of Internal Medicine, 157:2413-2445.
INAN (Instituto Nacional de Alimentação e Nutrição), 1991. Pesquisa Nacional sobre Saúde e Nutrição. Condições Nutricionais da População Brasileira: Adultos e Idosos. Brasília: INAN/Ministério da Saúde.
LAPIDUS, L.; BENGTSSON, C.; LARSSON, B.; PEN-NERT, K.; RYBO, E. & SJOSTROM, L., 1984. Distri-bution of adipose tissue and risk of cardiovascu-lar disease and death: A 12-year follow-up of par-ticipants in the study of women in Gothenburg, Sweden. BMJ, 289:1261-1263.
LEAN, M. E.; HAN, T. S. & MORRISON, C. E., 1995. Waist circumference as a measure for indicating need for weight management. BMJ, 311:158-161. LEMIEUX, S.; PRUD’HOMME, D.; BOUCHARD, C.;
TREMBLAY, C. & DESPRÉS, J. P., 1996. A single threshold value of waist girth identifies normal-weight and overnormal-weight subjects with excess vis-ceral adipose tissue. American Journal of Clinical Nutrition, 64:685-693.
LOHMAN, T. G.; ROCHE, A. F. & MARTORELL, R., 1988. Anthropometric Standardization Reference Manual. Champaign: Human Kinetics Books. MOLARIUS, A. & SEIDELL, J. C., 1998. Selection of
an-thropometric indicators for classification of ab-dominal fatness – A critical review. International Journal of Obesity, 22:719-727.
MONTEIRO, C. A. & CONDE, W. L., 1999. A tendência secular da obesidade segundo estratos sociais: Nordeste e Sudeste do Brasil, 1975-1989-1997. Ar-quivos Brasileiros de Endocrinologia e Metabolo-gia, 43:186-194.
MONTEIRO, P. O. A.; VICTORA, C. G.; BARROS, C. B. & TOMASI, E., 2000. Diagnóstico de sobrepeso em adolescentes: Estudo do desempenho de diferen-tes critérios para o Índice de Massa Corporal. Re-vista de Saúde Pública, 34:506-513.
OKOSUN, I. S.; ROTIMINI, C. N.; FORRESTER, T. E.; FRASE, H.; OSOTIMEHIN, B.; MUNA, W. F. & OOPER, R. S., 2000. Predictive value of abdominal obesity cut-off points for hypertension in Blacks from West African and Caribbean island nations. International Journal of Obesity, 24:180-186. PEREIRA, R. A.; SICHIERI, R. & MARINS, V. M., 1999.
Razão cintura/quadril como preditor de hiper-tensão arterial. Cadernos de Saúde Pública, 15: 333-344.
POULIOT, M. C.; DESPRES, J. P.; LEMIEUX, S.; MOOR-JANI, S.; BOUCHARD, C.; TREMBLAY, A.; NADEAU, A. & LUPIEN, P. J., 1994. Waist circum-ference and abdominal sagittal diameter: Best simple anthropometric indexes of abdominal vis-ceral adipose tissue accumulation and related cardiovascular risk in men and women. American Journal of Cardiology, 73:460-468.
VAGUE, J., 1956. The degree of masculine differentia-tion of obesity: A factor determining predisposi-tion to diabetes, arteriosclerosis, gout, and uric calculous disease. Journal of Clinical Nutrition, 4:20-34.
VELASQUEZ-MELENDEZ, G.; MARTINS, I. S.; CER-VATO, A. M.; FÓRNES, N. S.; MARUCCI, M. F. N. & COELHO, L. T., 1999. Relationship between stature, overweight and central obesity in the adult population in São Paulo, Brazil. Interna-tional Journal of Obesity, 23:639-644.
WHO (World Health Organization), 1990. Diet, Nutri-tion, and the Prevention of Chronic Diseases. WHO Technical Report Series 797. Geneva: WHO. WHO (World Health Organization), 1998. Preventing
and Managing the Global Epidemic. Report of a WHO Consultation on Obesity. Geneva: WHO.
Submitted on 20 March 2001