Adv. Sci. Res., 12, 97–101, 2015 www.adv-sci-res.net/12/97/2015/ doi:10.5194/asr-12-97-2015
© Author(s) 2015. CC Attribution 3.0 License.
EMS
Ann
ual
Meeting
&
10th
European
Conf
erence
on
Applied
Climatology
(ECA
C)
The benefits of emergency rescue and reanalysis data in
decadal storm damage assessment studies
P. Jokinen, A. Vajda, and H. Gregow
Finnish Meteorological Institute, P.O. Box 503, 00101 Helsinki, Finland
Correspondence to:P. Jokinen ([email protected])
Received: 23 January 2015 – Revised: 17 April 2015 – Accepted: 13 May 2015 – Published: 1 June 2015
Abstract. Studying changes in storm-induced forest damage in Finland has not been possible previously due to the lack of continuous, long series of impact data. We overcome this by combining emergency rescue data from the Finnish rescue services “PRONTO” (2011-) with ERA-Interim reanalysis data of wind gusts and soil temperatures to define exceedance thresholds for potential forest damage days. These thresholds were applied as a proxy for the period 1979–2013 in order to study the spatial and decadal characteristics of forest damage in Finland due to windstorms.
The results indicated that the area most impacted by potential forest damage was the south-western part of Finland along the coast, with 1–10 damaging storm cases per year. A decadal examination highlighted a lull period in the number of potential forest damage days during the 1990s compared to the 1980s and 2000s, albeit no trend was evident.
The inclusion of emergency rescue data allowed us for the first time to estimate the spatial distribution and decadal variations of potential forest damage days due to windstorms in Finland. The results achieved will encourage further development of thresholds for potential forest damage by including additional data sources and applying them to future climate scenarios.
1 Introduction
Extratropical storms can cause extensive socioeconomic im-pacts, by damaging infrastructure, disrupting society for sev-eral days or weeks, and even causing fatalities. Europe has experienced several high-impact storms in the past decade, such as “Kyrill” in 2007 (Levinson and Lawrimore, 2008), “Xynthia” in 2010 (Blunden et al., 2011) and “Dagmar” in 2011 (Blunden and Arndt, 2012). In fact, storms are the main natural hazard affecting Europe in terms of insured losses (Munich-Re, 2013).
Recent studies have indicated a decrease in the total num-ber of extratropical cyclones, but an increase in the numnum-ber of extreme cyclones over western and central Europe that enhance damage and economical losses (e.g. Donat et al., 2011; Zappa et al., 2013; Pinto et al., 2013). Thus, informa-tion about changes in storm impacts on infrastructure, soci-ety and economy in present and future climates is essential when planning adaptation and mitigation strategies for future adverse weather.
Storm-induced economic losses include damage to the forestry sector and infrastructure losses caused by fallen trees over power lines that then lead to power outages. In this study we will concentrate on the forest damage risks due to extra-tropical windstorms. Our study area is Finland, which is the most heavily forested country in Europe (FAO, 2010).
from a reanalysis dataset. This will additionally demonstrate the benefits of including and combining new types of datasets within the larger context of improving and diversifying cli-mate services.
2 Data and methods
ERA-Interim reanalysis data was used to create thresholds for wind gusts and soil temperatures on the days when for-est damage occurred in Finland. These thresholds were then used as a proxy to utilise 35 years of ERA-Interim reanaly-sis data in order to obtain the decadal and spatial variation in potential forest damage days.
2.1 Rescue data and fallen trees
The statistics system of the Finnish rescue services, “PRONTO”, stores information on various emergency rescue related incidents in Finland such as first response operations and building fires, that is when e.g. ambulances or the fire de-partment are called to a location (Pronto, 2015). In addition, it includes cases related to natural disasters categorized ac-cording to different causes. Strong wind events were selected from this dataset, and it is estimated that at least 75 % of these wind-related events were due to fallen trees that either fell over roads or downed power lines (A.-J. Punkka, personal communication, 10 December 2014). Thus, they were con-sidered to be a good indicator of forest (tree) damage. The term “forest damage” is used although it is acknowledged that not all reported wind-related events were necessarily due to forest damage.
This dataset provided information on the place and time of forest damage caused by storms since the coordinates and times were included for each event reported to the emer-gency response centres. The rescue dataset starts in 2011, with data up until summer of 2014 used in this study. Since wind speeds related to small-scale summertime convective events are not captured by the coarse resolution reanalysis data, they were not included in our study. Therefore, only the months September to April were considered when defining the thresholds.
2.2 Reanalysis data
ERA-Interim reanalysis data (Dee et al., 2011) was used to define exceedance thresholds for wind gusts and soil temper-atures on the days when forest damage occurred in Finland. ERA-Interim output covers the time period from 1979 on-wards at a spatial resolution of 0.7◦, which is approximately
80 km at the equator. Since the main contributors to possi-ble forest damage conditions are wind speed and soil state (unfrozen conditions induce high risk), we utilise the ERA-Interim 12 h forecasts of 10 m maximum wind gusts, and temporally-averaged soil temperature data provided at four levels: 0–7, 7–28, 28–100 and 100–255 cm.
2.3 Combining the datasets
The reanalysis maximum wind gust and average soil tem-peratures were extracted from two days prior to and includ-ing the day of the reported damage time in the “PRONTO” dataset by using the closest reanalysis grid point to the loca-tion of observed impact. Histograms of these variables were created that depicted the conditions leading to forest dam-age based on the overlapping time period of the two datasets (January 2011–April 2014). A combination of these thresh-olds was used as a proxy when selecting similar weather con-ditions in the ERA-Interim dataset from 1979 to 2013. The days when wind gusts at 10 m and soil temperatures at the four mentioned depths met or exceeded the defined thresh-olds were considered to be potential forest damage days.
3 Results
3.1 Forest damage thresholds
The histogram of ERA-Interim peak wind gusts correspond-ing to the days with observed wind damage is shown in Fig. 1. Although most damage reports given to the rescue services are logged almost immediately after the wind dam-age has occurred, there can sometimes be a much longer lag time between event and logging of the report, with no ex-act knowledge of when the damage occurred (e.g. people travelling to their summer cabins and finding damage that had occurred during the previous months). This is thought to explain some of the weaker wind speed values in the his-togram. We therefore selected 19 m s−1as the threshold for
wind gusts as a clear jump in the number of damage events was observed above this value.
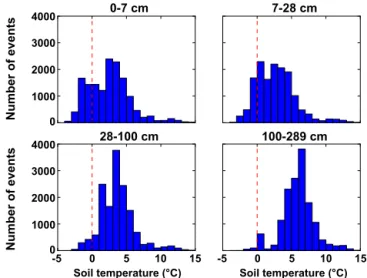
The histograms for the soil level temperatures at different levels depicted in Fig. 2 reveal that forest damage can occur even though the near surface layer temperature (0–7 cm) is slightly below freezing. However, on moving to deeper soil levels, the bulk of the histogram shifts to higher tempera-tures. These results suggest that trees can be uprooted when the near-surface level, down to a depth of 28 cm, is frozen, but not when the deeper soil layers (28–100 cm) are frozen anchoring trees more securely to the ground; there were only few cases reported for frozen deep soil layers. This is in agreement with the earlier findings of Gregow (2013) sug-gesting that frozen soil conditions at a depth of 30 cm sub-stantially reduced the risk of uprooting.
Table 1.The forest damage probability thresholds defined for the ERA-Interim dataset.
ERA-Interim parameter Threshold
Wind gusts ≥19 m s−1
0–7 cm soil temperature ≥ −2◦C 7–28 cm soil temperature ≥ −1◦C 28–100 cm soil temperature ≥1◦C 100–289 cm soil temperature ≥3◦C
10 15 20 25 30
2000
1500
1000
500
0
Number of events
Maximum wind gust (m s )-1
Figure 1.Histogram of the ERA-Interim maximum simulated wind gusts leading to observed forest damage.
3.2 Potential forest damage days
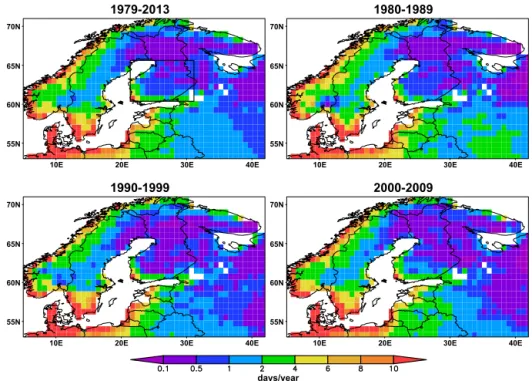
The average number of annual potential forest damage days in 1979–2013 is shown in Fig. 3. It indicates that the high-est frequency is in the south-whigh-estern parts of Finland along the coasts with values ranging between 1 and 10 per year. The lowest frequencies were found in the northern inland areas where forest damage conditions occurred on average less than once per year. This difference is most likely due to the longer duration of frozen ground in the north during the windy winter season and to the lower intensity of wind gusts in the more continental stable conditions. The spatial map in Fig. 3 also covers areas around Finland, although we must stress that the forest damage criteria was calibrated for Finland only and therefore values shown elsewhere are only suggestive; the thresholds would presumably require modifi-cation to accommodate different land surface and tree type.
Decadal maps in Fig. 3 as well as a time series of the areal average in southern and central parts of Finland (Fig. 4) in-dicate that the highest frequencies of potential forest damage conditions occurred in the mid-1980s and close to the year 2010 with a clear lull period during the 1990s. If the gust threshold only was considered, the number of damage days in the 1990s would have seen a peak. Thus the drop in the 1990s was due to lower soil temperatures on stormy days. There was also considerable variability from year to year, but no statistically significant trend existed for the time pe-riod covered in this study.
Number of events
Number of events
4000
3000
2000
1000
0
4000
3000
2000
1000
0
Soil temperature (°C) Soil temperature (°C)
-5 0 5 10 15
-5 0 5 10 15
0-7 cm 7-28 cm
28-100 cm 100-289 cm
Figure 2.Histograms of ERA-Interim temperatures for four differ-ent soil levels leading to observed forest damage. The red dashed line highlights the 0◦C temperature.
4 Discussion and conclusions
In this work, the benefits of combining emergency rescue data with reanalysis data were studied within the context of potential forest damage days in Finland. Although the calibration period for this study was relatively short, from 2011 to 2014, it did include six high-impact named storms in the study area (Tapani, 26 December 2011; Hannu, 27 De-cember 2011; Antti, 30 November 2012; Eino, 17 Novem-ber 2013; Oskari, 1 DecemNovem-ber 2013; Seija, 13 Decem-ber 2013). Naturally, the thresholds will become more ac-curate as more data becomes available in the future. Further-more, other weather factors such as wind direction and storm duration could be included in the list of parameters (Kupfer et al., 2008).
Future improvements in this method would include using the detailed impact data to calibrate the threshold values sep-arately for each area (grid point) to account for the fact that forest type, and therefore damage conditions, vary from one location to another. For example, using Finnish thresholds would most likely not lead to similar damage in Germany. Additionally, the thresholds were specifically calibrated for ERA-Interim reanalysis data, which does not necessarily rep-resent the thresholds that would be derived based on actual wind gust observations.
1979-2013 1980-1989
1990-1999 2000-2009
10E 20E 30E 40E 10E 20E 30E 40E
10E 20E 30E 40E 10E 20E 30E 40E
70N
65N
60N
55N
70N
65N
60N
55N
70N
65N
60N
55N
70N
65N
60N
55N
days/year
Figure 3.Potential forest damage days per year (days when the threshold levels are met or exceeded) in ERA-Interim during 1979–2013 (upper left panel) and decadal averages. The black box indicates the region over which the areal average in Fig. 4 is calculated.
0.5
0 1 1.5
2 2.5
3
1980 1990 2000 2010
5
4 6 7
3
2
1
0
A
v
er
age numb
er of da
y
s
(includes gust and soil thr
esholds)
A
v
er
age numb
er of da
y
s
(includes gust thr
eshold only)
Average number of potential forest damage days Southern & Central Finland
Figure 4.Blue columns are the average number of potential forest damage days in southern and central Finland based on ERA-Interim when wind gust and soil thresholds are met or exceeded. Vertical axis is on the left, and the red line is the 5-year running mean. The green dashed line is a 5-year running mean that uses the wind gust threshold only (vertical axis on the right). The values are calculated for the area depicted in Fig. 3.
assessment is a major improvement over using a wind-gust threshold only.
The most significant Finnish forest damage and rescue op-erations due to windstorms occurred during the Pyry-storm, 31 October 2001, and Janika-storm, 15 November 2001 (to-tal forest damage 7.3 Mm3). Additionally, the Tapani-storm (also called Dagmar) on 26 December 2011 caused 3.5 Mm3 in forest damage (Gregow, 2013). Both these years were
above average in our assessment of the number of poten-tial forest damage days, although it should be noted that our methodology does not attempt to estimate the damage sever-ity of individual storms.
effective-ness of weather and climate services in Finland. Since the aim of National Hydrological and Meteorological Services is also to serve the private sector, more cooperation in data shar-ing is required in this regard; for example, data from energy or telecommunication companies would be very valuable in storm-related impact research. As the data from private com-panies is rarely available, more effort is needed to collect valuable data from multiple sources, including the general public, in order to gain the most comprehensive view on past and future storm impacts.
Based on the present results we plan to develop the method further and apply it to future climate scenarios. With an ac-curate forest damage model we can then estimate how forest damage conditions in Finland are expected to change in the upcoming decades, providing useful information for adapta-tion and mitigaadapta-tion strategies.
Author contributions. Pauli Jokinen has prepared the manuscript and conducted the analyses. Andrea Vajda and Hilppa Gregow have supervised, commented and participated in writing.
Acknowledgements. This work was financially supported by the EU FP7 CORE-CLIMAX project. We are grateful to Ewan O’Connor for proofreading the manuscript. We also thank Carin Nilsson and one anonymous reviewer for their helpful comments.
Edited by: T. Cegnar
Reviewed by: two anonymous referees
References
Blunden, J. and Arndt, D.: State of the climate in 2011, B. Am. Meteorol. Soc., 93, S1–S282, doi:10.1175/2012BAMSStateoftheClimate.1, 2012.
Blunden, J., Arndt, D. S., and Baringer, M. O.: State of the climate in 2010, B. Am. Meteorol. Soc., 92, S1–S236, doi:10.1175/1520-0477-92.6.S1, 2011.
Dee, D. P., Uppala, S. M., Simmons, A. J., Berrisford, P., Poli, P., Kobayashi, S., Andrae, U., Balmaseda, M. A., Balsamo, G., Bauer, P., Bechtold, P., Beljaars, A. C. M., van de Berg, L., Bid-lot, J., Bormann, N., Delsol, C., Dragani, R., Fuentes, M., Geer, A. J., Haimberger, L., Healy, S. B., Hersbach, H., Hólm, E. V., Isaksen, L., Kllberg, P., Köhler, M., Matricardi, M., McNally, A. P., Monge-Sanz, B. M., Morcrette, J.-J., Park, B.-K., Peubey, C., de Rosnay, P., Tavolato, C., Thépaut, J.-N., and Vitart, F.: The ERA-Interim reanalysis: Configuration and performance of the data assimilation system, Q. J. Roy. Meteorol. Soc., 137, 553-597, doi:10.1002/qj.828, 2011.
Donat, M. G., Leckebusch, G. C., Wild, S., and Ulbrich, U.: Future changes in European winter storm losses and ex-treme wind speeds inferred from GCM and RCM multi-model simulations, Nat. Hazards Earth Syst. Sci., 11, 1351–1370, doi:10.5194/nhess-11-1351-2011, 2011.
FAO: Global Forest Resources Assessment 2010, Food and Agri-culture Organization of the United Nations, Rome, Italy, avail-able at: http://www.fao.org/forestry/fra/fra2010/en/ (last access: 10 January 2015), 2010.
Gregow, H.: Impacts of strong winds, heavy snow loads and soil frost conditions on the risks to forests in northern Europe, Ph.D. thesis, contributions 94, Finnish Meteorological Institute, Finland, 178 pp., 2013.
Kupfer, J., Myers, A., McLane, S., and Melton, G.: Patterns of For-est Damage in a Southern Mississippi Landscape Caused by Hur-ricane Katrina, Ecosystems, 11, 45–60, doi:10.1007/s10021-007-9106-z, 2008.
Levinson, D. H. and Lawrimore, J. H.: State of the climate in 2007, B. Am. Meteorol. Soc., 89, S1–S179, doi:10.1175/BAMS-89-7-StateoftheClimate, 2008.
Munich-Re: Topics Geo Natural Catastrophes: Analyses, assess-ments, positions, Munich Re Publications, Munich, Germany, 64 pp., 2013.
Peltola, H., Kellomäki, S., and Väisänen, H.: Model computations of the impact of climatic change on the windthrow risk of trees, Climatic Change, 41, 17–36, 1999.
Pinto, J. G., Bellenbaum, N., Karremann, M. K., and Della-Marta, P. M.: Serial clustering of extratropical cyclones over the North Atlantic and Europe under recent and future cli-mate conditions, J. Geophys. Res.-Atmos., 118, 12476–12485, doi:10.1002/2013JD020564, 2013.
Pronto: http://www.pelastusopisto.fi/fi/tutkimus-_jatietopalvelut/ tutkimus-_ja_kehittamispalvelut/tilastotpronto, last access: 10 January 2015.
Schmoeckel, J. and Kottmeier, C.: Storm damage in the Black Forest caused by the winter storm “Lothar” – Part 1: Airborne damage assessment, Nat. Hazards Earth Syst. Sci., 8, 795–803, doi:10.5194/nhess-8-795-2008, 2008.
Ylitalo, E. (Ed.): Finnish Statistical Yearbook of Forestry 2010, Finnish Forest Research Institute, Sastamala, Finland, 2010. Zappa, G., Shaffrey, L. C., Hodges, K. I., Sansom, P. G., and