www.ocean-sci.net/10/947/2014/ doi:10.5194/os-10-947-2014
© Author(s) 2014. CC Attribution 3.0 License.
Influence of frontal cyclone evolution on the 2009 (Ekman) and
2010 (Franklin) Loop Current eddy detachment events
Y. S. Androulidakis1,*, V. H. Kourafalou1, and M. Le Hénaff1
1University of Miami, Rosenstiel School of Marine and Atmospheric Science (RSMAS/MPO 4600), Rickenbacker Cswy, Miami, FL 33149, USA
*now at: Laboratory of Maritime Engineering and Maritime Works, Civil Engineering Department, Aristotle University of Thessaloniki, 54124, Thessaloniki, Greece
Correspondence to: Y. S. Androulidakis ([email protected])
Received: 5 June 2014 – Published in Ocean Sci. Discuss.: 31 July 2014
Revised: 29 September 2014 – Accepted: 24 October 2014 – Published: 27 November 2014
Abstract. The anticyclonic Loop Current Eddy (LCE) shed-ding events are strongly associated with the evolution of Loop Current Frontal Eddies (LCFEs) over the eastern Gulf of Mexico (GoM). A numerical simulation, in tandem with in situ measurements and satellite data, was used to inves-tigate the Loop Current (LC) evolution and the surround-ing LCFE formation, structure, growth and migration dur-ing the Eddy Ekman and Eddy Franklin shedddur-ing events in the summers of 2009 and 2010, respectively. During both events, northern GoM LCFEs appeared vertically coherent to at least 1500 m in temperature observations. They propagated towards the base of the LC, where, together with the migra-tion of Campeche Bank (southwest GoM shelf) eddies from south of the LC, contributed to its “necking-down”. Growth of Campeche Bank LCFEs involved in Eddy Franklin was partially attributed to Campeche Bank waters following welling events. Slope processes associated with such up-welling included offshore exports of high positive potential vorticity that may trigger cyclone formation and growth. The advection and growth of LCFEs, originating from the north-ern and southnorth-ern GoM, and their interaction with the LC over the LCE detachment area favor shedding conditions and may contribute to the final separation of the LCE.
1 Background
The Loop Current (LC) is the fraction of the North At-lantic western boundary current inside the Gulf of Mexico (GoM), which carries waters from the Caribbean Sea that
enter the southern GoM from the Yucatan Channel. Anticy-clonic rings, shed by the LC, are usually formed over the eastern GoM region and circulate warmer and more saline waters than the surrounding GoM waters, as they propagate westward into the GoM. The LC exits the GoM through the Straits of Florida, forming the Florida Current (FC) and feed-ing the Gulf Stream over the western and northern Atlantic (Sturges and Evans, 1983). The LC–FC system is the ma-jor connectivity pathway between the Caribbean Sea and the North Atlantic Ocean. This connectivity is thus strongly in-fluenced by changes in the LC extension inside the GoM and especially by the shedding of the anticyclonic ring, or Loop Current Eddy (LCE), from the LC main body (e.g., Oey et al., 2005). The ring shedding processes were first re-ferred to by Ichiye (1962) and studied with numerical mod-eling 20 years later by Hurlburt and Thompson (1982). In many LCE formation sequences, the LCE reattaches to the main LC body and detaches several times, before its fi-nal separation and westward propagation toward the west-ern GoM (Sturges and Leben, 2000; see also detailed discus-sion in Schmitz Jr., 2005). Furthermore, dismemberments of the westward-propagating LCEs may also take place. These temporary detachments and full separations are largely in-fluenced by cyclonic eddies (Biggs et al., 1996), also known as Loop Current Frontal Eddies (LCFEs; Fratantoni et al., 1998), associated with the LC front. The LC and associated LCEs and LCFEs are the main factors influencing the GoM mesoscale variability.
separation period. The intrusion of the LC, toward the north-western GoM, is a basic requirement for the potential sepa-ration of warm-core eddies (Schmitz Jr., 2005). Chérubin et al. (2005) found that the LCE separation process is related to LC instability. Using numerical modeling, Ezer et al. (2003) related the eddy shedding events to variability in the transport intensity of the Yucatan Current. In addition to the potential effect of the transport, observations showed that the shedding of LCEs is preceded by periods of diminished negative hori-zontal vorticity flux into the GoM (Candela et al., 2002). The effect of remote winds was studied by Oey (1996) and Chang and Oey (2012), who argued that the weakening of the wind over the Caribbean Sea leads to the decrease of the Yucatan transport, providing favorable conditions for the separation of the LCE. The separation of the LCE thus appears as the combination of various processes, both locally and remotely. Von Arx et al. (1955) were the first to mention the pres-ence of cyclonic eddies in the GoM region, but the role of these cold, cyclonic eddies in the LCE formation was first discussed by Cochrane (1972), based on in situ data. The sys-tem formed between the LC and the associated eddy field is a complex one, where cyclonic LCFEs and the anticy-clonic LC or LCE influence each other. The synergy between the peripheral LCFE cyclones and the LC – and their re-lation with the LC northward propagation, contraction, de-tachments, and final separation of the LCE anticyclone – have been highlighted in several studies (e.g., Kenelly et al., 1985; Zavala-Hidalgo et al., 2003; Schmitz Jr., 2005; Chéru-bin et al., 2005, 2006; Le Hénaff et al., 2012a). Around the LC, various types of cyclonic LCFEs interact with the LC and influence its propagation inside the GoM. Follow-ing Schmitz Jr. (2005), the first group of LCFEs consists of the cyclones west and south of the LC, along the Campeche Bank (southwest GoM shelf), thus forming the CB group. They usually move northward towards the central GoM and sometimes intrude into the LCE separation area over the deep eastern GoM (Zavala-Hidalgo et al., 2003; Athié et al., 2012). The cyclones along the northern edge of the LC form the second group (hereafter N Group) of eddies around the LC front. These cyclones appear to be affected by local to-pography that favors eddy intensification, due to the bottom of the northern GoM shelf slope (Le Hénaff et al., 2012a), and by local eddy merging (Walker et al., 2011; Le Hénaff et al., 2012a). These studies illustrated how such LCFEs can play a role in an LCE shedding sequence. A third group of LCFEs consists of eddies along the eastern side of the ex-tended LC, along the west Florida Shelf. These have long been considered as the main LCFEs driving the LCE shed-ding (Vukovich and Maul, 1985), until long series of ob-servations, mostly based on remote sensing, showed the full complexity of this process and the involvement of LCFEs from all above groups (Schmitz Jr., 2005). LCFEs may cover a large part of the water column (Cochrane, 1972). Moreover, several cyclones have been observed and simulated numeri-cally over the deeper layers (> 1000 m); these also interact
with the LC evolution and its shedding events (Hamilton et al., 2011; Oey, 2008). An important site for the formation of these deep cyclones is the area north of Campeche Bank, around 23.5–25◦N, 87–88◦W (Oey, 2008).
2 Study objectives
We investigate the contribution of LCE to major LCFE shed-ding events during the summers of 2009 (Eddy Ekman event) and 2010 (Eddy Franklin event). In particular, we seek to identify the major cyclones that participated in the detach-ment processes; examine their sub-surface characteristics; and investigate the conditions that contribute to their advec-tion, growth, and/or intensification. Both study periods are characterized by a marked LC intrusion into the northern Gulf of Mexico (NGoM), and several detachments preced-ing the formation of an anticyclonic eddy and southward re-treat of the Loop Current main body (Hamilton et al., 2011). Eddy Ekman formed during the summer of 2009 and finally separated on 10 September 2009, when it started moving to-ward the western gulf; the separation led to an extensive re-treat of the Loop Current main body to 24.74◦N (Hamilton et
al., 2011). The detachment and separation events of summer 2010 led to the formation of Eddy Franklin, which played an important role in the Deepwater Horizon oil spill extension (Walker et al., 2011; Le Hénaff et al., 2012b). Eddy Franklin detached and reattached several times before it finally sepa-rated from the Loop Current on 29 September 2010. Hamil-ton et al. (2011) showed that deep cyclones north of the Yu-catan Peninsula (CB Group) might have participated in the shedding sequence of Eddy Franklin.
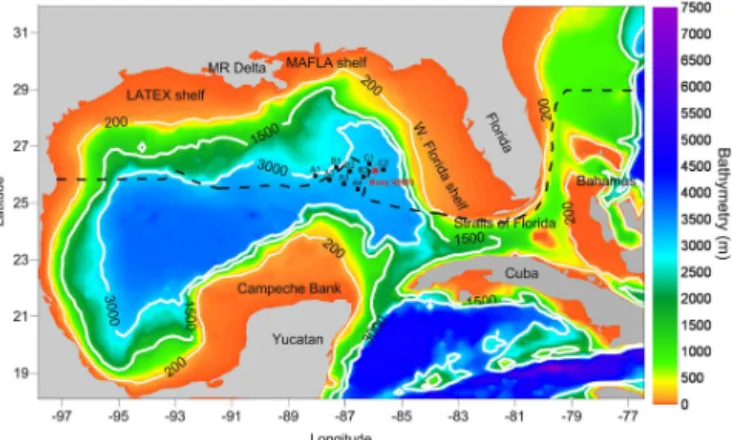
Here, we examine the identification of the LCFE tracks and their synergy during the detachment and separation peri-ods with the use of simulation results from a regional model, aided by satellite altimetry, satellite sea surface temperature (SST), and in situ measurements. We use a unique data set of buoys located along the US–Mexico boundary of the ex-clusive economic zone (EEZ; Fig. 1), over the area where the Loop Current extends and LCEs tend to detach (Hamilton et al., 2011). The buoys also cover some of the pathways of N Group cyclones.
Figure 1. The Gulf of Mexico (GoM) bathymetry (contours in m)
and GoM-HYCOM model domain. Black square dots mark the tall mooring deployment sites. The red star indicates the NOAA 42003 Buoy. White lines are the 200, 1500, and 3000 m isobaths. The black dashed line is the US–Mexico boundary of the exclusive economic zone. Shelf areas: Campeche Bank, LATEX (Louisiana–Texas) shelf, MAFLA (Mississippi–Alabama–Florida) shelf, west Florida shelf. Land areas: Yucatan Peninsula, Florida Peninsula, Bahamas islands, Cuba island. The Straits of Florida are between Florida, Cuba, and the Bahamas.
periods include major detachments before the final separa-tions of Eddy Ekman and Eddy Franklin (which took place in September of each year). We seek to address three main questions related to the role of the frontal cyclones during the two shedding periods:
– What was the evolution of the Loop Current Frontal Ed-dies, and how did they relate to the Eddy Ekman and Eddy Franklin shedding sequences?
– What are the characteristics of the vertical structure for N Group Loop Current Frontal Eddies?
– Is the CB Group Eddy evolution influenced by local at-mospheric forcing and shelf slope exchanges?
Section 3 describes the work methods comprising the model characteristics, the in situ measurements, and the satellite data. The model evaluation with available observa-tions is presented in Sect. 4. Section 5 discusses the evolu-tion of the Loop Current, the associated eddy field during Eddy Ekman and Eddy Franklin shedding events, the verti-cal characteristics and structure of the N Group cyclones, and the influence of environmental conditions on CB Group cy-clone evolution, during the Loop Current Eddy detachment events of 2009 and 2010. Section 6 provides a summary and concluding remarks.
3 Methodology 3.1 Model simulations
The regional Gulf of Mexico Hybrid Coordinate Ocean Model (GoM-HYCOM; www.hycom.org) has been run in near-real time at the Naval Oceanographic Office (NAVO-CEANO) since 2004, assimilating daily available near-real-time data through the Navy’s Code for Data Assimilation (NCODA; Cummings, 2005). Since in situ data are usually quite sparse in the Gulf of Mexico (in particular, very few Argo floats reach the GoM), the data assimilation is mostly driven by remotely sensed observations (satellite altimetry and SST). Moreover, the 2010 simulation has benefited from the assimilation of in situ data associated with the monitor-ing of the Deepwater Horizon oil spill. However, data from the Loop Current buoy program (see Sect. 3.2) were not as-similated (as not available in real time during the simula-tion); therefore, this is a suitable data set for our model-independent analyses (see Sect. 4). We note that the buoy program is independent from the monitoring of the Deep-water Horizon accident, it started in 2009 and it was not designed to report in real time. GoM-HYCOM was first employed to examine the evolving three-dimensional GoM response to Hurricane Ivan during 14–16 September 2004 (Prasad and Hogan, 2007; Zamudio and Hogan, 2008). Since then, it has been used in several GoM simulation studies, ei-ther providing boundary and initial conditions to shelf mod-els (Schiller et al., 2011; Kourafalou and Kang, 2012; An-droulidakis and Kourafalou, 2013) or investigating physical or biological processes of the entire GoM region (Mariano et al. 2011; Le Hénaff et al., 2012b; Paris et al., 2012; Valentine et al., 2012).
The GoM-HYCOM has a resolution of 1/25◦(
∼4 km) and extends from 77.36 to 98◦W and from 18.09 to 30.71◦N
(Fig. 1) with 20 hybrid layers in the vertical (Prasad and Hogan, 2007; Kourafalou et al., 2009). The hybrid coor-dinate system is a unique capability of the HYCOM code (hycom.org), especially suitable for topographically com-plex areas, such as the GoM. The minimum and maximum depths are 2 m near the coastline and 7814 m south of Cuba, respectively (Fig. 1). GoM-HYCOM uses boundary condi-tions over the Caribbean and Atlantic boundaries from a simulation of the 1/12◦North Atlantic HYCOM, performed
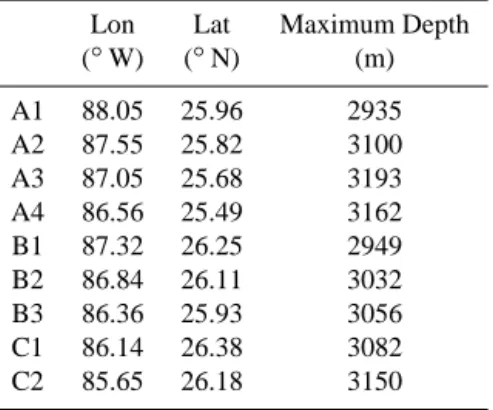
Table 1. Location (longitude and latitude) and maximum depth (m)
of the moorings along the US–Mexico boundary of the EEZ.
Lon Lat Maximum Depth (◦W) (◦N) (m)
A1 88.05 25.96 2935 A2 87.55 25.82 3100 A3 87.05 25.68 3193 A4 86.56 25.49 3162 B1 87.32 26.25 2949 B2 86.84 26.11 3032 B3 86.36 25.93 3056 C1 86.14 26.38 3082 C2 85.65 26.18 3150
simulation has been employed to analyze the LCE shedding events, focusing on the LCFE evolution.
3.2 Observations
LCE detachments and separations usually take place over the central, deep part of the eastern GoM, along the US–Mexico boundary of the EEZ boundary; this guided the position of the 2009–2011 LC study moorings (Hamilton et al., 2011). In situ measurements of temperature, salinity, pressure, and current velocities were derived from several stations from a grid of nine full-depth sub-surface moorings (Fig. 1), cover-ing the study period from April 2009 to July 2010; it is noted that these data are not assimilated in the model. The location and the maximum depth of each mooring are presented in Ta-ble 1. The locations of the moorings cover an area of about 13 000 km2and a perimeter of almost 640 km. The nine tall moorings carry point temperature sensors at 75, 150, 250, 350, 525, 600, 750, 900, 1100, 1300, and 2000 m depth and 100 m above the bottom (∼3000 m). The temporal resolu-tion of this data set is 60 minutes, producing very dense time series. The moorings cover the main region of the N Group cyclone pathways and interaction with the LC during both Eddy Ekman and Eddy Franklin periods, offering detailed information about their vertical structure and migration (see Sect. 5.3).
Maps of Absolute Dynamic Topography (ADT), derived from the AVISO data set (http://www.aviso.oceanobs.com/) were extracted for the summers of 2009 and 2010, for com-parison to model Sea Surface Height (SSH) fields during the Eddy Ekman and Eddy Franklin shedding periods. AVISO weekly ADT maps with resolution of 1/3◦ are the sum of
the sea level anomaly, calculated from altimetry measure-ments, and the mean dynamic topography, evaluated from historical in situ data sets and other data (Rio et al., 2011). The mean dynamic topography is an essential component for capturing dynamical features whose time average has intense signature, such as the incoming flow in the Yucatan Chan-nel or the Florida Current. In addition, SST satellite data
produced by NASA’s Advanced Microwave Scanning Ra-diometer (AMSR) were also used to evaluate the respective GoM-HYCOM SST and to detect specific surface features related to temperature, such as coastal upwelling events (see Sect. 5.4.1). The GoM-HYOM model (as Oceanic General Circulation Models generally do) assimilates along-track al-timetric, and not the AVISO mapped data. The AVISO ADT maps are projected from the original along-track data. The assimilated altimetry data and AVISO maps are thus not the same product. Of course, since along-track altimetry is as-similated, one expects common features with AVISO maps, but not necessarily a perfect match, as the interpolation that leads to AVISO maps also makes hypotheses on the data and might degrade part of the information. Therefore, we have two altimetric data sets, one that is assimilated (along track) and one that can be used for analyses (AVISO).
4 Model evaluation during Eddy Ekman and Eddy Franklin shedding sequences
The in situ temperature measurements (Sect. 3.2) were com-pared to the GoM-HYCOM-simulated values (Sect. 3.1) at the mooring locations, during the summers of 2009 and 2010. The model–in situ data comparison is based on identifying sudden changes in the temperature evolution. Following the focus of this study, the formation and propagation of the LCFE (cold) and LCE (warm) eddies were compared and contrasted, as they are well characterized by their temper-ature. The GoM-HYCOM performance has been evaluated in previous studies (e.g., Kourafalou et al., 2009). Here, we focus on the model performance over the LCE detachment area, during the two study periods. The evolution of daily model and in situ temperature at 75 and 150 m of the A1 and C1 moorings (Fig. 1) is presented in Fig. 2. A1 and C1 are the most western and northern moorings, capturing the LCFE intrusions into the mooring grid, from west and north, respectively.
The simulated temperature evolution for all cases follows most of the major highs and lows of the measured time se-ries, generally exhibiting a satisfactory agreement in temper-ature variability tendencies, keeping in mind the challenge of a point-to-point comparison (Fig. 2). It is noted that the comparison is performed at 75 and 150 m depth, i.e., below the mixed layer. Since the assimilation of SST fields into the model mostly impacts its surface temperature, the analysis of the model temperature at these depths is relevant for eval-uating the model performance beyond the direct influence of data assimilation. The sharp temperature increase at 75 m during June 2009 and the high warm temperatures (> 24◦C)
Figure 2. Daily GoM-HYCOM (red) and in situ (black)
temper-ature time series for the summers of 2009 (left) and 2010 (right) at 75 m (top panels) and 150 m (bottom panels), at the A1 and C1 moorings (single model node closest to mooring position used). The correlation coefficients between the two time series (r) are also pre-sented for each case.
thus the temperature increased, as derived from both model and in situ time series (Fig. 2). In addition, the north side of the grid (Fig. 2; Station C1) revealed a strong temperature low (∼16◦C) during August 2009, apparent in both
mod-eled and observational data, indicating the intrusion of a cy-clonic cold eddy from the north (see Sects. 5.2 and 5.3). This specific temperature effect was also observed over greater depths (C1, 150 m). Both model and observations show very low values (∼12◦C) during mid-August 2009 (Eddy Ekman
period) along the northern boundary of the moorings grid. Almost all Pearson correlation coefficients (Pearson, 1903) between model and observations of the two study periods for both stations and both depths are generally higher than 0.50; especially at the C1 150 m depth during summer 2009, the correlation is significantly high (r=0.77). The lowest corre-lation (r=0.41) was calculated for the upper layer (75 m) of the C1 mooring during summer 2010. In general, the data and model patterns are in good agreement. Moreover, the lower-level temperature at mooring C1 (150 m) reveals high cor-relation between model and observations during June 2010 (Eddy Franklin period, r=0.62), showing a trend to lower temperature, which is related to the intrusion of a cold cy-clonic eddy from the north (see Sects. 5.2 and 5.3). Both model and data depict the different water masses surrounding A1 and C1 during the two events.
The detachments of the LCE rings from the main LC sys-tem during the two study periods are apparent in both model simulations and AVISO satellite altimetry products (Fig. 3); these satellite altimetry data are also not assimilated in the model. The simulated SSH at the end of August 2009 and in the beginning of July 2010 show high sea level eleva-tions associated with Eddy Ekman and Eddy Franklin, re-spectively, both located over the deep eastern GoM. There is a clear ring separation from the LC body which, in both cases, is restricted west of the 86◦W meridian; the satellite
ADT maps present similar results. Both SSH and ADT maps show that Eddy Ekman was located between 24 to 26◦N
and 86 to 89◦W. Approximately 1 year later, Eddy Franklin
was located over the same area, as captured by both model and satellite data. In addition, both fields show two distinct LCFEs to the north and south of the narrow area between the LCE and LC. These are cyclones that have contributed to the detachment process, following a sequence similar to the one analyzed by Le Hénaff et al. (2012a). This sequence incor-porates N Group eddies (here represented by the LCFE that has migrated south from the NGoM region) and CB Group eddies (here represented by the second LCFE, which has mi-grated north from the Campeche Bank region); see Fig. 3. The evolution of these LCFEs during the two study periods is presented in Sect. 5.2.
5 Results and discussion
5.1 Loop Current evolution in summers of 2009 and 2010
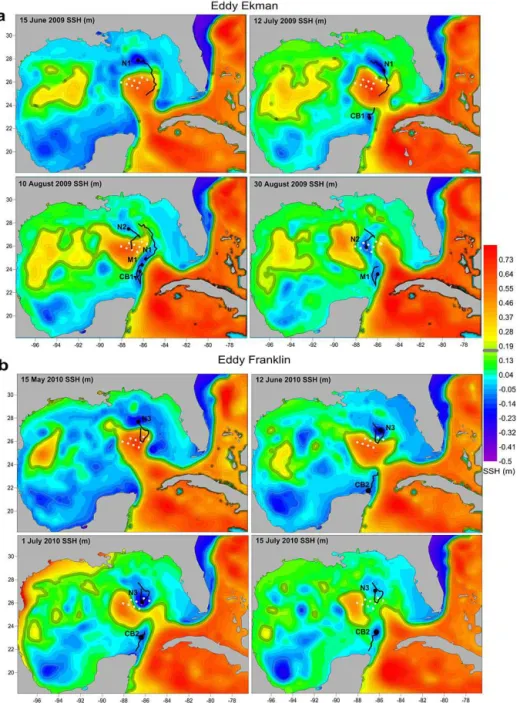
Figure 3. (left) Daily GoM-HYCOM Sea Surface Height (SSH, cm) for two characteristic LCE separation dates of (a) the Eddy Ekman
event (26 August 2009) and (b) the Eddy Franklin event (8 July 2010), as well as (right) the respective weekly AVISO ADT (cm). The large cyclonic LCFEs between the anticyclonic LCEs and the main LC body are of N Group type (migrating southward from the northern GoM) and of CB Group type (migrating northward from the vicinity of the Campeche Bank).
Figure 4. Latitude of furthest northward penetration of the LC,
derived from the GoM-HYCOM 17 cm Sea Surface Height con-tour (black line) and adapted from Fig. 4 of Hamilton et al. (2011, grey line) during (a) August 2009 (Eddy Ekman event) and (b) June–July 2010 (Eddy Franklin event). Eddy detachment dates are indicated with vertical dashed red lines.
During the summer of 2010, two major detachment events took place in the beginning of July, which led to an exten-sive period of detachment between Eddy Franklin and the LC body. The GoM-HYCOM simulation agrees with obser-vations from Hamilton et al. (2011), showing that the long
detachment period began in early July, after two successive separations, lasted approximately 1 month and finally led to the reattachment of the LCE at the end of July 2010. On 15 July 2010, the LCE was completely detached from the LC body, located east of 86◦W and around 24◦N.
5.2 Tracks of frontal cyclones during Eddy Ekman and Eddy Franklin events
Figure 5. Sea Surface Height (SSH, m) distribution from GoM-HYCOM for four characteristic dates of the (a) Eddy Ekman and (b) Eddy
Franklin case studies. The major LCFE tracks (when present on the four selected dates) are indicated with black lines. The black dots indicate the position of each cyclonic eddy on the specific panel date. The cyclonic LCFEs (total duration dates) are 15 June–10 Au-gust 2009 (N1), 12 July–10 AuAu-gust 2009 (CB1), 10 AuAu-gust–3 September 2009 (N2), and 10–30 AuAu-gust 2009 (M1) in the upper panels and 15 May –15 July 2010 (N3), and 12 June–15 July 2010 (CB2) in the lower panels (in Table 2). The moorings grid is also shown, marked with white dots. The 17 cm SSH contour is indicated with a thick grey line on the color bar. (Note: the SSH color scale is different than in Fig. 3).
days of August. The merging of N1 and CB1 formed the cy-clone named M1, during the LCE detachment event (around 10 August 2009). A second N Group cyclone (hereafter N2) was detected in the beginning of August and very quickly propagated southward. Based on the decreasing values in the related SSH signal, N2 intensified in the vicinity of the reat-tached but weak LC neck on 20 August 2009 and merged
with the pre-existing M1 cyclone during the last days of August, inducing the final separation of the LCE; SSH at the N2 core was around−0.10 m on 10 August and lower than−0.20 m on 30 August (Fig. 5a). The merged cyclone remained over 87◦W longitude (Table 2) during the final
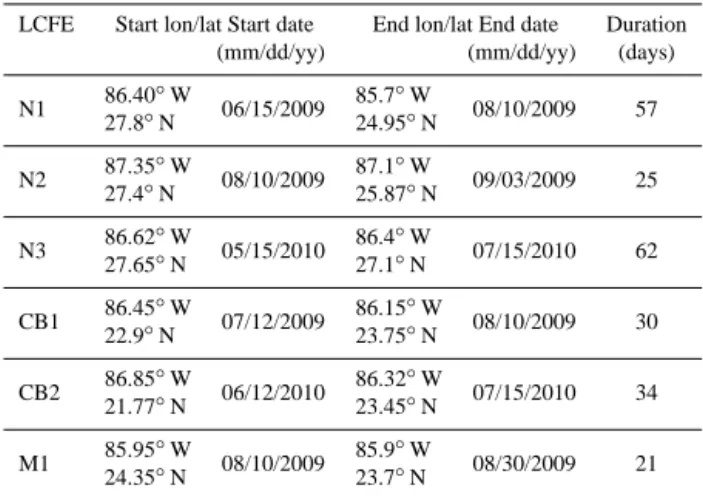
Table 2. LCFE attributes during the Eddy Ekman and Eddy Franklin
events. LCFEs are characterized as “N” when in the “N Group” (northern GoM eddies), “CB” when in the “CB Group” (Campeche Bank eddies), and “M” when in the “M Group” (Merged eddies).
LCFE Start lon/lat Start date End lon/lat End date Duration (mm/dd/yy) (mm/dd/yy) (days)
N1 86.40 ◦W 06/15/2009 85.7 ◦W 08/10/2009 57 27.8◦
N 24.95◦
N N2 87.35 ◦ W 08/10/2009 87.1 ◦ W 09/03/2009 25 27.4◦
N 25.87◦
N N3 86.62 ◦ W 05/15/2010 86.4 ◦ W 07/15/2010 62 27.65◦
N 27.1◦
N CB1 86.45 ◦ W 07/12/2009 86.15 ◦ W 08/10/2009 30 22.9◦
N 23.75◦
N CB2 86.85 ◦ W 06/12/2010 86.32 ◦ W 07/15/2010 34 21.77◦
N 23.45◦
N M1 85.95 ◦ W 08/10/2009 85.9 ◦ W 08/30/2009 21 24.35◦
N 23.7◦
N
separation of Eddy Ekman caused the LC body to retreat southward (not shown).
In 2010, Eddy Franklin began to form at the end of May, detached during the first days of June, and reattached and detached again in the middle and end of July, respectively. Finally, it separated completely from the LC by the end of September (Hamilton et al., 2011). Two major LCFEs sur-rounded the LC during the May–June period: N3 was de-tected initially along the northern LC boundary (N Group) in mid-May, while CB2 was detected in the vicinity of the Campeche Bank (CB Group) in mid-June (Fig. 5b). The in-tense and large N3 eddy was actually formed after the merg-ing of three smaller pre-existmerg-ing N Group cyclonic eddies (similar to observations by Walker et al., 2011). N3 lasted approximately 2 months (Table 2) and intruded southward at the end of June, contributing to the “necking-down” of Eddy Franklin in July. At the same time, CB2 was detected over the Campeche Bank in mid-June and slowly propagated northward, toward the LC body, until the end of the month. The necking-down of the LC started in the beginning of June, with several short-term detachments, followed by a longer detachment of Eddy Franklin in mid-July (in agreement with Hamilton et al., 2011).
5.3 Structure and migration of northern gulf frontal cyclones
We have presented LCFE migration from the northern GoM toward the south during both summer events. We analyze the vertical structure of N Group LCFEs, by employing the unique data set from the GoM moorings. As shown in Sect. 5.2, N Group cyclones propagated towards the south and intruded toward the neck of the LC, contributing to the detachment process during the summer periods of 2009 and 2010. Both N1 and N2 LCFEs covered a long distance from
their formation site over the NGoM toward the ring detach-ment area during the summer of 2009 (Fig. 5a). N1 cov-ered more than 3◦of latitude southward, from mid-June to
early August. Then, N2 propagated rapidly towards the south during 20 days and ended up between the LC main body and the detached LCE at the end of August 2009. The N Group cyclone of the 2010 event (N3) lasted approximately 1.5 months, moving southward during the first few days and then northward until mid-July, when its intensity declined until it was finally eroded.
The unique set of measurements from the moorings over the US–Mexico EEZ boundary (Sect. 3.2) mainly detected the southward migration of N2 and N3 eddies, while the N1 cyclone propagated around and east of the mooring grid (Fig. 5a). However, its southward track was partially recorded by the most eastern moorings. The in situ tempera-ture measurements at several depths down the water column from surface to bottom allow the detailed and precise de-scription of the vertical structure of the N Group cyclones under study. We use in situ measurements to describe the cyclone deep vertical structure, while the use of model re-sults is better suited at the surface, where the cyclone’s ex-act position can be accurately retrieved, as the model assim-ilates near-surface fields. Mesoscale eddies are associated with a substantial vertical movement of water masses; cy-clonic LCFEs are associated with the shoaling of isotherms at the core of the eddy. The presence of cyclonic eddies in the GoM may thus form temperature lows at all depths, with values lower than those associated with the LC removal away from the mooring area.
By mid-July 2009, the N1 eddy was blocked between the LC front and the northeastern corner of the GoM shelf break, formed where the west Florida shelf and the NGoM shelf meet. N1 propagated around and east of the moorings until it reached the neck of the LC in early August 2009 (Fig. 5a). The track of the LCFE was partially recorded by the most eastern C1 and C2 moorings, located close to the west Florida shelf (Fig. 1) in mid-July, revealing tempera-ture drops, especially at depths shallower that 750 m (Fig. 6). The core of the cyclone was outside the mooring grid dur-ing the entire N1 period, and, therefore, it is not possible to draw clear conclusions about the vertical structure and co-herence of this particular LCFE. However, the most eastern C2 mooring measured the lowest temperature values of the entire summer during mid-July at both upper (250 m) and lower (1500 m) sensors, capturing the passage of the cyclone (Fig. 6b). The drop in temperature is almost 10◦C in the
up-per sensor. The upup-per part of N1 passed closer to C2, record-ing a temperature reduction larger than in C1. The drop in temperature measured by the 750 and 900 m sensors (∼3◦C)
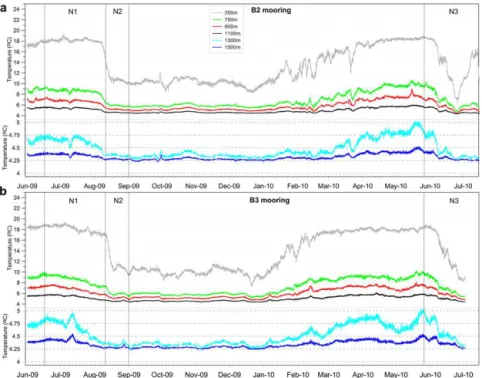
Figure 6. Sea temperature (◦C) temporal evolution at several depths (250, 750, 900, 1100, 1300, and 1500 m) from (a) C1 and (b) C2
moorings (Fig. 1) from June 2009 to mid-July 2010. The 1300 and 1500 m time series are plotted with a differentyaxis for clarity reasons. The LCFE N1, N2, and N3 periods are indicated with black solid vertical lines.
(Fig. 8a). All layers at A3 were inside the LC extension, with high temperature values during the entire month.
As presented in Sect. 5.2, the N2 eddy intruded in the cen-tral area of the mooring grid. It was initially well formed over the northern Gulf shelf slope and approached the deep GoM at the northern edge of the LC extension (Fig. 5a). At first, the eddy approached the C1 mooring, lowering the temperature levels at all depths in mid- and late August 2009 (Fig. 6a), in agreement with the simulated surface SSH fields presented in Sect. 5.2 (Fig. 5a). The vertical coherence of the eddy is also apparent at the B3 mooring in late August and early September, when a temperature low was measured at depths greater than 1300 m (Fig. 7b). The southward propagation of the eddy was also detected by the most southern A4 moor-ing at the end of August and in the beginnmoor-ing of September (Fig. 8b), when cooler waters occurred in comparison with the rest of the time series at all depths (250–1500 m), indi-cating that the temperature drops were due to a cyclone, in addition to the LC being away from the moorings. This is re-flected by the SSH distribution, presented in Fig. 5a, where the surface signal of N2 is clearly seen over the central moor-ings after its southward migration. This LCFE finally reached the A3 mooring in early September (Fig. 8a), when it ered the temperature at all depths as well, showing the low-est values of the entire time series. The most wlow-estern A1 and A2 moorings also partially captured the upper layer’s tem-perature decrease due to the cyclone intrusion (not shown). Then, the vertically coherent N2 cyclone moved southward
and merged with CB1, leading to the Eddy Ekman detach-ment (Fig. 5a).
Figure 7. Sea temperature (◦C) temporal evolution at several depths (350, 750, 900, 1100, 1300, and 1500 m) from (a) B2 and (b) B3 moorings (Fig. 1) from June 2009 to mid-July 2010. The 1300 and 1500 m time series are plotted with a differentyaxis for clarity reasons. The LCFE N1, N2, and N3 periods are indicated with black solid vertical lines.
Figure 8. Sea temperature (◦C) temporal evolution at several depths (350, 750, 900, 1100, 1300, and 1500 m) from (a) A3 and (b) A4
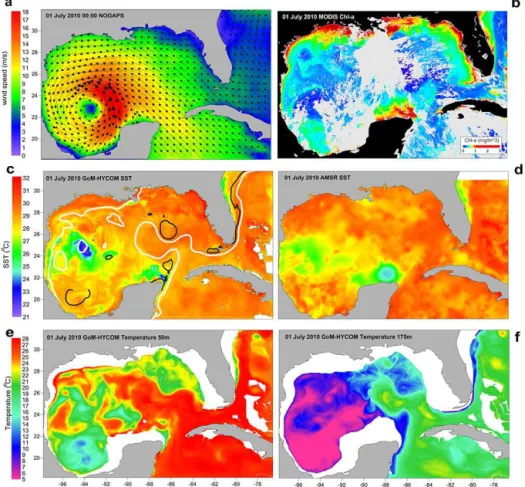
Figure 9. Horizontal distribution over the GoM-HYCOM region on 1 July 2010 of (a) wind stress (vectors, m2s−1) and wind speed magnitude (colors, m s−1) from the NOGAPS model, (b) satellite MODIS chla (mg m−3), (c) model Sea Surface Temperature (SST,
◦C) with superimposed model Sea Surface Height (SSH) contours (white lines: 17 cm; black lines:−8 cm), (d) satellite AMSR SST (◦C),
(e) model temperature (◦C) at 50 m, and (f) model temperature (◦C) at 175 m.
5.4 Campeche Bank Loop Current Frontal Eddy evolution and growth
We investigate if shelf processes along the Campeche Bank may contribute to adjacent CB Group LCFE evolution. In particular, an event of export of shelf waters from the Campeche Bank to the CB2 LCFE during an upwelling event is analyzed. As shown in Sect. 5.2, CB2 was formed over the Campeche Bank, close to the Yucatan Peninsula; propagated northward, and intruded toward the LC neck, contributing to the detachment of Eddy Franklin in July 2010. An impor-tant environmental condition during the formation, intensi-fication, and northward propagation of the CB2 eddy was the upwelling event on the Campeche Bank due to the pas-sage of Hurricane Alex over the GoM region in June–July 2010 (Stewart and Cangialosi, 2012). Possible implications for CB2 evolution are examined here.
5.4.1 Upwelling event over the Campeche Bank The coastal and shelf waters over the Campeche Bank are frequently subject to upwelling-favorable winds, due to the
Figure 10. Campeche Bank temperature (◦C) along the S1 vertical
section (GoM insert: green line) on 1 July 2010.
the Campeche Bank. Such phenomena are locally frequent (Martinez-López and Zavala-Hidalgo, 2009).
The upwelling event was successfully represented in the GoM-HYCOM simulation. Surface waters of quite low tem-perature (< 25◦C) were estimated over the Campeche Bank
(as compared to∼30◦C ambient waters) during the passage
of Hurricane Alex (Fig. 9c), in agreement with the AMSR SST fields (Fig. 9d). The strongest impact of the upwelling was on the eastern part of the Campeche Bank (∼87◦W),
where the lowest near-surface temperatures of the entire GoM were both measured and simulated on 1 July 2010. Low temperatures were also simulated at 50 m (Fig. 9e) and 175 m (Fig. 9f), showing the presence of colder waters from the deeper layers along the eastern Campeche Bank slope. A north–south vertical cross section of temperature (Fig. 10) gives additional details. Low-temperature water masses (∼10◦C) were detected in the intermediate layers
(∼175 m) at 24◦N latitude. Low temperatures (17◦C) were
also found closer to the surface (∼50 m) at 22◦N latitude,
above a shallow area (150 m) over the Campeche Bank. In contrast, the upper layers of the LC pattern (23–26◦N) carry
significantly warmer water masses (∼30◦C); the warm
sur-face waters spread southward, reaching the continental shelf slope area.
As CB2 eventually involved in the shedding of Eddy Franklin by mid-July, we seek to further examine the con-nection between the winds that induced upwelling over the Campeche Bank and the export of shelf waters across the shelf break slope that may lead to the growth of CB Group cyclonic eddies. We note that these cyclones are LCFEs, which generally travel around the LC. They experience in-tensification when they migrate further north along the LC edge (Oey, 2008; Le Hénaff et al., 2012a). Here we exam-ine an additional process that may enhance the growth of CB Group eddies, with implications for promoting their role on LCE formation, detachment, and separation.
5.4.2 Contribution of slope processes to Campeche Bank cyclone evolution and growth
The proximity of the Campeche Bank slope to the LC front and associated LCFEs provides the unique opportunity to ex-amine if shelf processes may interact with and impact the deep basin mesoscale variability. We focus on the poten-tial role of cold shelf waters resulting from wind-driven up-welling in the evolution of CB2. We employ an analysis of the associated Potential Vorticity (PV) field, based on the GoM-HYCOM simulation. Since in geostrophic balance an eddy is associated with a local extremum of PV (Ertel, 1942), such a PV analysis is suited for investigating the evolution of the CB2 eddy. In addition, PV analysis has been used in the past to investigate upwelling-related shelf processes, in sim-plified model studies (e.g., Rossi et al., 2010). Appendix A presents the detailed description of our PV analysis method, which leads us to look for a PV anomaly in the water column, associated with CB2. We derive three simplified model lay-ers (based on density levels): the upper layer extends from 0 to 50 or 100 m in the study area; the intermediate layer, where the high-PV core associated with CB2 is located, is about 100 m thick inside the eddy; and the deep layer below extends to the bottom. We now present results based on the analysis of the PV field in these simplified layers.
Figures 11 and 12 show snapshots of the PV in the sim-plified layers 1 and 2, respectively. They show that filaments exporting high PV from the Campeche Bank to the GoM in-terior are often seen in the upper layer (Fig. 11), for example on 31 May or 13 June, but these filaments do not aggregate into a coherent structure. On the other hand we see a core of high PV forming and growing along the Campeche Bank slope in the intermediate layer 2 (Fig. 12). There is no such core in early May, but episodes of export of high PV from the eastern Campeche Bank are observed between mid- and late May, for example on 18 and 26 May. These lead to the for-mation of a core of high PV on the continental shelf slope, lo-cated around (86.5◦W, 23.5◦N) on 31 May. This core of high
PV keeps growing by aggregating high PV not only from the Caribbean, flowing into the GoM along the Campeche Bank, but also from the Campeche Bank itself, in intense episodes of export, such as on 13 and 30 June. During June, the area covered by the eddy increases, and the eddy extends north-eastward. Then, between late June and mid-July, the core of high PV separates from the Campeche Bank, forming a closed, circular pattern, reflecting an isolated cyclone. Be-tween early and mid-July, the core of high PV moves north-ward, toward the GoM interior.
Figure 11. Snapshots of PV in layer 1 (of three-layer simplified analysis of model outputs), on 8, 18, 26, and 31 May; 8, 13, 25, and 30
June; 6 and 14 July 2010. Thick black lines are the 200, 2000, and 3000 m isobaths. White patches are areas where layer 1 vanishes, which happens when there is no water of density in the range defining the simplified isopycnal layer 1 (see Appendix A).
Figure 12. Snapshots of PV in layer 2 (of three-layer simplified analysis of model outputs), on 8, 18, 26, and 31 May; 8, 13, 25, and 30 June;
6 and 14 July 2010. Thick black lines are the 200, 2000, and 3000 m isobaths. White patches are areas where layer 2 vanishes, which happens when there is no water of density in the range defining the simplified isopycnal layer 2 (see Appendix A).
interacting with the northern N3 eddy, which leads to the LCE detachment (see discussion based on the Fig. 5b SSH-derived sequence in Sect. 5.2). From both Figs. 11 and 12, it is evident that the PV anomaly associated with CB2 is lo-cated in intermediate layer 2, and we will focus on the
evolu-tion of PV within that layer. We now examine the role of the wind-driven upwelling in this LCFE growth process.
Figure 13. (a) Topography detail around Campeche Bank (CB), marking the slope (along the 200 m isobath, from 21.6 to 23.9◦N: red line)
and the Yucatan Channel (YC; extended from the CB slope to 85.5◦W: blue line). Time series of (b) magnitude of along-shore wind speed
(m s−1) at the northern coast of the Yucatan Peninsula, (c) positive part of the transport (Sv) exported through CB in simplified layer 2; (d) same as (c); but for PV positive (offshore) transport (m2s−2); and (e) ratio (%) of the PV positive transport in layer 2 from the CB to the GoM interior, over the combined positive transport from the CB and YC sections. (b–e) Vertical lines are on the 1st, 5th, 10th, 15th, 20th, and 25th day of each month.
Figure 14. Lag correlation between the magnitude of along-shore
wind for the northern coast of the Yucatan Peninsula and the PV positive (offshore) transport from the Campeche Bank (CB section, Fig. 14a) to the GoM interior in layer 2 (of three-layer simplified analysis of full model outputs).
at the 200 m isobath (red line in Fig. 13a). The positive, off-shore transport tends to respond to the easterly winds (up-welling favorable for the northern coast of the Yucatan Penin-sula), with a time lag (Fig. 13b and c). Based on the direction of these westward winds, an induced Ekman transport is
ex-pected to the north, which should lead to an export of waters from the Campeche Bank toward the GoM interior. Indeed, peaks of layer 2 offshore transport tend to take place a few days after easterly wind bursts. This is the case in early July, following the passage of Hurricane Alex in late June. A pre-vious peak of upwelling winds around 13 May also led to a peak of positive transport a few days later (21 May). Then, the evolution of the offshore advection of PV by this posi-tive transport (Fig. 13d) is driven by the changes in offshore transport, modulated by changes in the PV values. Figure 13e provides a comparison between the PV transport exported through the Campeche Bank slope (red line in Fig. 13a) and the total PV transport, which includes the contribution from the Caribbean through the Yucatan Channel (blue line in Fig. 13a). At times following upwelling-favorable winds, the contribution of the Campeche Bank to the layer 2 PV core can reach up to 38 % of the total PV transport. This PV flux has the potential to feed the CB2 eddy core, although during that period (May–June 2010) the PV flux was mostly due to import from the Caribbean.
Figure 15. (a) Snapshots of simulated Sea Surface Height (SSH, m) and the section (black line) where the vertical distribution of (b) Potential
Vorticity (PV m−1s−1)and (c) temperature (◦C) are presented, for 3 July 2010 (left) and 14 July 2010 (right). PV is given in the three layers
of the simplified analysis of model outputs (black lines indicate layer thickness), while temperature is given over the full range of model layers (same black lines added for reference).
Fig. 14 shows that upwelling-favorable winds promote the transport of high PV from the Campeche Bank to the GoM interior, where it participates in the growth of the core of high PV associated with CB2.
The evolution of CB2 from the shelf slope to the offshore GoM is presented in a cross-slope vertical section along the direction of the CB2 eddy pathway (Fig. 15), for two snap-shots (3 and 14 July 2010). The corresponding model SSH maps illustrate the presence of the eddy first along the CB slope on 3 July and then offshore to the north on 14 July
thin-ner over the CB than in the deeper GoM, which, based on the definition of PV (Eq. A1), favors its role as a reservoir of high PV. Episodes of upwelling-favorable winds lead to the offshore export of these high-PV waters.
Although the contribution of the positive PV flux from Campeche Bank to the growth of the LCFE is not domi-nant, it is not negligible. This analysis offers novel evidence on the contribution of upwelling-favorable winds over the Campeche Bank to the growth of adjacent LCFEs, in addi-tion to other processes contributing to their cyclonic vorticity. It also shows an interesting aspect of slope processes, where the impact is felt far beyond the shelf break, on the mesoscale variability of the deep basin interior. Although we examined an event in the wake of a hurricane, periods of strong and sus-tained upwelling-favorable winds are locally common, sug-gesting that we have identified a process that merits further study, during several episodes of similar conditions.
6 Conclusions
A numerical simulation with the regional GoM-HYCOM model (realistic forcing and data assimilation), in tandem with in situ measurements and satellite altimetry and tem-perature data, have provided a comprehensive description of changes in the LC system during two summer periods. In par-ticular, changes associated with the position and evolution of cyclonic LCFEs during two sequences of anticyclonic LCE shedding were studied. These LCFEs were from two char-acteristic GoM groups: N Group (migrating southward from the northern GoM) and CB Group (migrating northward from the vicinity of the Campeche Bank). The data have revealed unprecedented details on the three-dimensional changes of water properties marked by LC evolution, where LCFEs and LCEs play a dominant role. The model results have corrob-orated findings from the observations and have allowed for the additional study of eddy history and transformations, un-der the complex GoM circulation forcing mechanisms and topographic controls. Advection, growth, and intensification of the LCFEs are notable factors favoring their involvement in the anticyclonic ring shedding process.
Cyclonic LCFEs were involved in the detachment events during Eddy Ekman and Eddy Franklin, shedding from the main LC body during the summers of 2009 and 2010, re-spectively. We have identified two N Group LCFEs during the Ekman period and one during the Franklin period as the main ones contributing to LCE detachment from the north, and we studied their sub-surface characteristics based on new in situ temperature data. All N Group LCFEs that partici-pated in the two detachment events were vertically coherent to at least 1500 m, as shown by in situ measurements that captured their southward propagation. We showed that the LCE detachment was aided by the combination of N Group and CB Group LCFE activity.
The indirect effect of the winds on the growth of the Campeche Bank LCFEs was found to be related to the Eddy Franklin detachment process. Strong upwelling-favorable winds, which are locally common but can be particularly in-tensified during tropical storms and hurricanes, may bring colder deep waters over the Campeche Bank upper layers. We have shown that such upwelling is the source for the transfer of high PV from the Campeche Bank to the conti-nental slope, which was associated with the formation and growth of the CB Group LCFE under study. This enlarged LCFE moved northward, toward the LC extension area, con-tributing to the narrowing of the LC neck and, together with N Group LCFEs, to the detachment of the anticyclonic ring. We deduce that such a sequence could be typical during episodes of strong and sustained upwelling-favorable winds. Our findings suggest that the study of several such periods should be pursued.
Appendix A: Potential vorticity analysis
In geostrophic balance, an eddy is associated with a local extreme of Potential Vorticity (Ertel, 1942). An eddy is as-sociated with a PV anomaly that can be located in a specific part of the water column, but which can influence the whole eddy (Herbette et al., 2003; Meunier et al., 2010). We have undertaken a PV analysis, seeking such a PV anomaly signa-ture in the water column, associated with the cyclone under study. This analysis is based on the archived outputs from the GoM-HYCOM simulation. As described in Sect. 3.1, this simulation uses 20 hybrid vertical layers. We first project the model outputs onto purely isopycnal layers, using the same number of layers, as well as the same target densities, as the native GoM-HYCOM grid. This choice leads to the interpo-lation of fields only from the layers that were not isopycnal in the HYCOM configuration, i.e., layers that were based on zlevels (mostly near the surface) and sigma layers near steep topography. The projection on purely isopycnal layers is nec-essary, because the PV calculation requires the knowledge of isopycnal layer thicknesses. The new fields in the purely isopycnal layers are interpolated linearly between adjacent depths from the original HYCOM grid. The fields in the new layer that is the closest to the surface are calculated based on the average of the original HYCOM archives, from the sur-face down to the bottom of that new layer, in order to keep most of the information on near-surface ocean parameters, as represented in the original HYCOM simulation.
This projection onto purely isopycnal layers leads to er-rors in the oceanic field estimates. In our case, the error in total depth-averaged current induced by this interpolation is on the order of 2 % in areas deeper than 100 m, whereas it is around 12 % in areas shallower than 100 m, with peaks reach-ing 25 % at times. This larger value over shelf areas is likely due to the loss of information during the projection step, near the surface, or in low-stratified areas, where the use of isopy-cnal layers is less adapted than the original HYCOMzlevels. The small error in deep parts makes this analysis suitable for studying the PV evolution over the continental shelf slope and the deep ocean. In our case, this means that the PV anal-ysis is well suited for studying PV anomalies evolving along the Campeche Bank slopes and in the Gulf interior.
We estimate the PV in each isopycnal layer, based on the interpolated currents, and the layer thicknesses:
PV=ς+f
h , (A1)
Acknowledgements. This research was funded by the Na-tional Science Foundation (NSF OCE – 0929651) and by the National Atmospheric and Oceanic Administration (NOAA NA13OAR4830224 and NA12OAR4310073). The Loop Current buoy data were kindly provided by P. Hamilton (Science Appli-cations International Corporation: SAIC) and A. Lugo-Fernández (Bureau of Ocean Energy Management: BOEM). We are grateful to the productive collaboration with P. Hogan and O. M. Smedstad (Naval Research Laboratory–Stennis Space Center: NRL-SSC), who provided the GoM-HYCOM archives on the native model grid.
Edited by: J. M. Huthnance
References
Androulidakis, Y. S. and Kourafalou, V. H.: On the processes that influence the transport and fate of Mississippi waters under flood-ing outflow conditions, Ocean Dynam., 63, 143–164, 2013. Athié, G., Candela, J., Ochoa, J., and Sheinbaum, J.:
Im-pact of Caribbean cyclones on the detachment of Loop Current anticyclones, J. Geophys. Res., 117, C03018, doi:10.1029/2011JC007090, 2012.
Biggs, D., Fargion, G., Hamilton, P., and Leben, R.: Cleavage of a Gulf of Mexico Loop Current eddy by a deep water cyclone, J. Geophys. Res., 101, 20629–20620, 1996.
Candela, J., Sheinbaum, J., Ochoa, J., Badan, A., and Leben, R.,: The potential vorticity flux through the Yucatan Channel and the Loop Current in the Gulf of Mexico, Geophys. Res. Lett., 29, 2059, doi:10.1029/2002GL015587, 2002.
Canuto, V., Howard, A., Cheng, Y., and Dubovikov, M.: Ocean tur-bulence. Part I: One-point closure model-momentum and heat vertical diffusivities, J. Phys. Oceanogr., 31, 1413–1426, 2001. Canuto, V., Howard, A., Cheng, Y., and Dubovikov, M.: Ocean
tur-bulence. Part II: Vertical diffusivities of momentum, heat, salt, mass, and passive scalars, J. Phys. Oceanogr., 32, 240–264, 2002. Chang, Y. L. and Oey, L. Y.: Why does the Loop Current tend to shed more eddies in summer and winter?, Geophys. Res. Lett., 39, L05605, doi:10.1029/2011GL050773, 2012.
Chérubin, L. M., Sturges, W., and Chassignet, E. P.: Deep flow variability in the vicinity of the Yucatan Straits from a high-resolution numerical simulation, J. Geophys. Res., 110, C04009, doi:10.1029/2004JC002280, 2005.
Chérubin, L. M., Morel, Y., and Chassignet, E. P.: Loop Current ring shedding: the formation of cyclones and the effect of topography, J. Phys. Oceanogr., 36, 569–591, 2006.
Cochrane, J. D.: Separation of an anticyclone and subsequent de-velopments in the Loop Current (1969), Contributions on the Physical Oceanography of the Gulf of Mexico, Tex. A&M Univ., Oceanogr. Stud., 2, 91–106, 1972.
Cummings, J. A.: Operational multivariate ocean data assimilation, Q. J. Roy. Meteor. Soc., 131, 3583–3604, 2005.
Ertel, H.: Ein neuer hydrodynamischer Wirbelsatz, Meteorol. Z., 59, 277–281, 1942.
Ezer, T., Oey, L. Y., Lee, H. C., and Sturges, W.: The variabil-ity of currents in the Yucatan Channel: Analysis of results from a numerical ocean model, J. Geophys. Res., 108, 3012, doi:10.1029/2002JC001509, 2003.
Fratantoni, P. S., Lee, T. N., Podesta, G. P., and Muller-Karger, F. E.: The influence of Loop Current perturbations on the forma-tion and evoluforma-tion of Tortugas eddies in the southern Straits of Florida, J. Geophys. Res., 103, 24759, doi:10.1029/98JC02147, 1998.
Hamilton, P., Donohue, K., Leben, R., Lugo-Fernández, A., and Green, R.: Loop Current observations during spring and summer of 2010: Description and historical perspective, Geoph. Monog. Series, 195, 117–130, 2011.
Herbette, S., Morel, Y., and Arhan, M.: Erosion of a surface vortex by a seamount, J. Phys. Oceanogr., 33, 1664–1679, 2003. Hurlburt, H. and Thompson, J. D.: A numerical study of Loop
Current intrusions and eddy shedding, J. Phys. Oceanogr., 10, 1611–1651, 1980.
Hurlburt, H. E. and Thompson, J. D.: The dynamics of the Loop Current and shed eddies in a numerical model of the Gulf of Mexico, Oceanography Series 34, 243–297, 1982.
Ichiye, T.: Circulation and water mass distribution in the Gulf of Mexico, Geofis. Int., 2, 47–76, 1962.
Kennelly, M. A., Evans, R. H., and Joyce, T. M.: Small-scale cy-clones on the periphery of a Gulf Stream warm-core ring, J. Geo-phys. Res., 90, 8845–8857, 1985.
Kourafalou, V. H., Peng, G., Kang, H., Hogan, P. J., Smedstad, O. M., and Weisberg, R. H.: Evaluation of global ocean data as-similation experiment products on south florida nested simula-tions with the hybrid coordinate ocean model, Ocean Dynam., 59, 47–66, 2009.
Kourafalou, V. H. and Kang, H.: Florida Current meandering and evolution of cyclonic eddies along the Florida Keys Reef Tract: are they inter-connected?, J. Geophys. Res., 117, C05028, doi:10.1029/2011JC007383, 2012.
Le Hénaff, M., Kourafalou, V. H., Morel, Y., and Srinivasan, A.: Simulating the dynamics and intensification of cyclonic Loop Current Frontal Eddies in the Gulf of Mexico, J. Geophys. Res., 117, C02034, doi:10.1029/2011JC007279, 2012a.
Le Heìnaff, M., Kourafalou, V. H., Paris, C. B., Helgers, J., Aman, Z. M., Hogan, P. J., and Srinivasan, A.: Surface Evolution of the Deepwater Horizon Oil Spill Patch: Combined Effects of Circulation and Wind-Induced Drift, Environ. Sci. Technol., 46, 7267–7273, 2012b.
Leben, R.: Altimeter-derived Loop Current metrics, in: Circula-tion in the Gulf of Mexico: ObservaCircula-tions and Models, edited by: Sturges, W. and Lugo-Fernandez, A., American Geophysi-cal Union, 181–201, 2005.
Mariano, A., Kourafalou, V., Srinivasan, A., Kang, H., Halliwell, G., Ryan, E., and Roffer, M.: On the modeling of the 2010 Gulf of Mexico Oil Spill, Dynam. Atmos. Oceans, 52, 322–340, 2011. Martínez-López, B. and Zavala-Hidalgo, J.: Seasonal and interan-nual variability of cross-shelf transports of chlorophyll in the Gulf of Mexico, J. Marine Syst., 77, 1–20, 2009.
Meunier, T., Rossi, V., Morel, Y., and Carton, X.: Influence of bot-tom topography on an upwelling current: Generation of long trapped filaments, Ocean Model., 35, 277–303, 2010.
Oey, L. Y.: Simulation of mesoscale variability in the Gulf of Mexico: Sensitivity studies, comparison with observations, and trapped wave propagation, J. Phys. Oceanogr., 26, 145–175, 1996.
Oey, L. Y., Ezer, T., and Lee, H. C.: Loop current, rings and re-lated circulation in the Gulf of Mexico: A review of numerical models and future challenges, in: Circulation in the Gulf of Mex-ico: Observations and Models, edited by: Sturges, W. and Lugo-Fernandez, A., American Geophysical Union, 31–56, 2005. Paris, C. B., Le Hénaff, M., Aman, Z., Suramaniam, A., Helgers, J.,
Wang, D. P., Kourafalou, V. H., and Srinivasan, A.: Evolution of the Macondo Well Blowout: Simulating the Effects of the Circu-lation and Synthetic Dispersants on the Subsea Oil Transport, En-viron. Sci. Technol., 46, 13293–13302, doi:10.1021/es303197h, 2012.
Pearson, K.: Mathematical contributions to the theory of evolution. XI. On the influence of natural selection on the variability and correlation of organs, Philos. T. R. Soc. Lond., 200, 1–66, 1903. Prasad, T. and Hogan, P. J.: Upper-ocean response to Hurricane Ivan in a 1/25 nested Gulf of Mexico HYCOM, J. Geophys. Res., 112, C04013, doi:10.1029/2006JC003695, 2007.
Rio, M., Guinehut, S., and Larnicol, G.: New CNES-CLS09 global mean dynamic topography computed from the combination of GRACE data, altimetry, and in situ measurements, J. Geophys. Res., 116, C07018, doi:10.1029/2010JC006505, 2011.
Rossi, V., Morel, Y., and Garcon, V.: Effect of the wind on the shelf dynamics: formation of a secondary upwelling along the continental margin, Ocean Model., 31, 51–79, doi:10.1016/j.ocemod.2009.10.002, 2010.
Schiller, R., Kourafalou, V., Hogan, P., and Walker, N.: The dynam-ics of the Mississippi River plume: Impact of topography, wind and offshore forcing on the fate of plume waters, J. Geophys. Res., 116, C06029, doi:10.1029/2010JC006883, 2011.
Schmitz Jr., W. J.: Cyclones and westward propagation in the shedding of anticyclonic rings from the Loop Current, Geoph. Monog. Series, 161, 241–261, 2005.
Sturges, W. and Evans, J. C.: On the variability of the Loop Current in the Gulf of Mexico, J. Mar. Res., 41, 639–653, 1983. Sturges, W. and Leben, R.: Frequency of ring separations from the
Loop Current in the Gulf of Mexico: A revised estimate, J. Phys. Oceanogr., 30, 1814–1819, 2000.
Stewart, S. R. and Cangialosi, J. P.: Eastern North Pacific Hurricane Season of 2010, Mon. Weather Rev., 140, 2769–2781, 2012. Valentine, D. L., Mezic, I., Macesic, S., Crnjaric-Zic, N., Ivic,
S., Hogan, P. J., Fonoberov, V. A., and Loire, S.: Dynamic au-toinoculation and the microbial ecology of a deep water hydro-carbon irruption, P. Natl. Acad. Sci. USA, 109, 20286–20291, doi:10.1073/pnas.1108820109, 2012.
Von Arx, W., Bumpus, D., and Richardson, W.: On the fine-structure of the Gulf Stream front, Deep-Sea Res. Pt. II, 3, 46–65, 1955. Vukovich, F. M. and Maul, G. A.: Cyclonic eddies in the eastern
Gulf of Mexico, J. Phys. Oceanogr., 15, 105–117, 1985. Walker, N. D., Pilley, C., Raghunathan, V., D’Sa, E., Leben, R.,
Hoffmann, N., Brickley, P., Co-holan, P., Sharma, N., Graber, H., and Turner, R.: Impacts of Loop Current frontal cyclonic eddies and wind forcing on the 2010 Gulf of Mexico oil spill, Geoph. Monog. Series, 195, 103–116, 2011.
Zamudio, L. and Hogan, P. J.: Nesting the Gulf of Mexico in At-lantic HYCOM: oceanographic processes generated by Hurri-cane Ivan, Ocean Model., 21, 106–125, 2008.
Zavala-Hidalgo, J., Morey, S. L., and O’Brien, J. J.: Cyclonic eddies northeast of the Campeche Bank from altimetry data, J. Phys. Oceanogr., 33, 623–629, 2003.