Activation of AMP-Activated Protein Kinase
and Stimulation of Energy Metabolism by
Acetic Acid in L6 Myotube Cells
Hitomi Maruta1, Yukihiro Yoshimura2, Aya Araki1, Masumi Kimoto2, Yoshitaka Takahashi2, Hiromi Yamashita2*
1Graduate School of Health and Welfare Science, Okayama Prefectural University, Soja-shi, Okayama, Japan,2Department of Nutritional Science, Faculty of Health and Welfare Science, Okayama Prefectural University, Soja-shi, Okayama, Japan
*yamashit@fhw.oka-pu.ac.jp
Abstract
Previously, we found that orally administered acetic acid decreased lipogenesis in the liver and suppressed lipid accumulation in adipose tissue of Otsuka Long-Evans Tokushima Fatty rats, which exhibit hyperglycemic obesity with hyperinsulinemia and insulin resis-tance. Administered acetic acid led to increased phosphorylation of AMP-activated protein kinase (AMPK) in both liver and skeletal muscle cells, and increased transcripts of myoglo-bin and glucose transporter 4 (GLUT4) genes in skeletal muscle of the rats. It was sug-gested that acetic acid improved the lipid metabolism in skeletal muscles. In this study, we examined the activation of AMPK and the stimulation of GLUT4 and myoglobin expression by acetic acid in skeletal muscle cells to clarify the physiological function of acetic acid in skeletal muscle cells. Acetic acid added to culture medium was taken up rapidly by L6 cells, and AMPK was phosphorylated upon treatment with acetic acid. We observed increased gene and protein expression of GLUT4 and myoglobin. Uptake of glucose and fatty acids by L6 cells were increased, while triglyceride accumulation was lower in treated cells com-pared to untreated cells. Furthermore, treated cells also showed increased gene and protein expression of myocyte enhancer factor 2A (MEF2A), which is a well-known transcription factor involved in the expression of myoglobin and GLUT4 genes. These results indicate that acetic acid enhances glucose uptake and fatty acid metabolism through the activation of AMPK, and increases expression of GLUT4 and myoglobin.
Introduction
Obesity and type 2 diabetes are increasing throughout the world. The International Diabetes Federation Diabetes Atlas reported that there were 382 million people living with diabetes in the world in 2013. This number is expected to rise to 592 million by 2035 [1].
Obesity leads to excess lipid accumulation in adipose tissue, skeletal muscle, and liver. Lipid accumulation in muscle causes a decline of insulin sensitivity [2–5].
a11111
OPEN ACCESS
Citation:Maruta H, Yoshimura Y, Araki A, Kimoto M, Takahashi Y, Yamashita H (2016) Activation of AMP-Activated Protein Kinase and Stimulation of Energy Metabolism by Acetic Acid in L6 Myotube Cells. PLoS ONE 11(6): e0158055. doi:10.1371/journal. pone.0158055
Editor:David Wai Chan, The University of Hong Kong, HONG KONG
Received:March 9, 2016
Accepted:June 9, 2016
Published:June 27, 2016
Copyright:© 2016 Maruta et al. This is an open access article distributed under the terms of the
Creative Commons Attribution License, which permits unrestricted use, distribution, and reproduction in any medium, provided the original author and source are credited.
Data Availability Statement:All relevant data are within the paper.
Funding:This work was supported by the following sources of funding: JSPS KAKENHI 15K07437 for Grant-in-Aid for Scientific Research (C) and JSPS KAKENHI 26850087 for Grant-in-Aid for Young Scientists (B).
Previously, we found that orally administered acetic acid decreased lipogenesis in the liver and suppressed lipid accumulation in adipose tissue of Otsuka Long-Evans Tokushima Fatty rats, which exhibit hyperglycemic obesity with hyperinsulinemia and insulin resistance [6]. Acetic acid is a metabolite formed viaβ-oxidation of fatty acid in the liver mitochondria under starved conditions and is utilized in extrahepatic tissues as a biological fuel [7]. Under fed conditions, orally administered acetic acid is rapidly absorbed from the digestive organs and released into the blood stream [6]. Acetic acid absorbed into tissues is converted to acetyl-CoA with a formation of AMP via the activity of ace-tyl-CoA synthetase, leading to the activation of AMP-activated protein kinase (AMPK) [6]. Acetic acid contributed to protection against the accumulation of abdominal fat and of lipid in the liver.
AMPK, a heterotrimeric protein kinase, has been found to play a key role in regulation of whole-body energy balance by phosphorylating key metabolic enzymes in both biosynthetic and oxidative pathways [8–14]. AMPK is activated by a high AMP/ATP ratio in the cytosol, which occurs under heat shock, hypoxia, starvation, or physical exercise. AMPK activation results both from phosphorylation of Thr172 on AMPK’sα-subunits via upstream AMPK kinase and by way of allosteric activation of phosphorylated AMPK by 5’-AMP [8–15]. Admin-istered acetic acid increased AMP concentration, resulting in an increase of the AMP: ATP ratio, and led to the activation of AMPK in skeletal muscle [15]. This phenomenon is very simi-lar to that induced by endurance exercise training. Furthermore, treatment with acetic acid increased the gene expression of myoglobin and GLUT4 in skeletal muscle of rats. GLUT4 is a well-known gene that is induced by activation of AMPK in skeletal muscle [16]. Expression of the myoglobin gene is modulated by environmental stimuli including chronic hypoxia or endurance exercise training [17–20]. Mutational analysis of the myoglobin promoter con-firmed that A/T-rich myocyte enhancer factor 2 (MEF2)-binding motifs were important in its gene regulation [21]. The human GLUT4 promoter is also regulated by the cooperative func-tion of MEF2A [22], which is a transcription factor that plays a key role in skeletal muscle dif-ferentiation [23–25]. In differentiated myotubes, MEF2 is localized to the nucleus, indicating the importance of this transcription factor in specific skeletal muscle gene expression [26].
To investigate the function of acetic acid on AMPK activation and expression of genes such as myoglobin and GLUT4 that are involved with energy metabolism of skeletal muscle, we used L6 myotube cells and examined the effect of acetic acid. When added to the culture medium, acetic acid was rapidly taken up by L6 cells, and the phosphorylation of AMPK was stimulated. Transcripts and protein levels of myoglobin and GLUT4 were increased upon treat-ment with acetic acid. Furthermore, MEF2A levels in the nuclear fraction were increased. The uptake of glucose and fatty acid by cells were increased, while triglyceride accumulation was decreased upon treatment with acetic acid. These results indicate that treatment with acetic acid increases the expression of myoglobin and GLUT4 via the activation of AMPK and MEF2A, thus enhancing fatty acid metabolism and glucose uptake.
Materials and Methods
Materials
adenine 9-β-D-arabinofuranoside (araA) were purchased from Sigma-ALDRICH (MO, USA). AMPK inhibitor Compound C was purchased from Merck (DA, Germany)
L6 cell culture
L6 myoblasts were grown in DMEM containing 10% (v/v) FBS, 100 units/ml penicillin, and 100μg/ml streptomycin in 5% CO2at 37°C. For myotube differentiation, the medium was
changed to DMEM containing 2% (v/v) horse serum when myoblasts were 80% confluent. Myo-tubes were harvested 8–11 days after differentiation, and experimental procedures were initiated.
Amount of acetic acid incorporated in cells
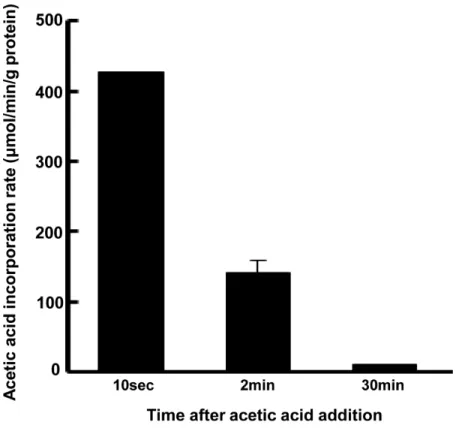
Differentiated L6 myotube cells were treated with 0.5 mM (1μmol/2ml) acetic acid for 0–30 min, and then the each conditioned medium that treated with acetic acid for each time period was collected and measured the concentration of acetic acid. The concentration of acetic acid remaining in the media was measured using the acetic acid UV-method kit (R-Biopharm AG, Darmstadt, Germany) according to the manufacturer’s instructions. The rates of acetic acid uptake were calculated by using the amount of acetic acid remaining in the medium, which averaged 473.1μM (ca. 0.95μmol/2ml), 394.0μM (ca. 0.79μmol/2ml), 390.0μM (ca. 0.78μmol/2ml) in 10sec, 2min, 30min of the treatment of acetic acid, respectively.
Amount of glucose uptake into cells
Differentiated L6 myotube cells were treated with 0.5 mM acetic acid and 100 nM insulin for 24 and 48 hrs in the medium that the glucose concentration was 25 mM (50μmol/2ml). Each conditioned medium that treated with acetic acid or insulin for 24 and 48 hrs was collected and measured the concentration of glucose. The concentration of glucose remaining in the media was measured using a commercial assay kit (Glucose CII-Test Wako; Wako Pure Chemical Industries Ltd., Osaka, Japan). The amount of glucose uptake was calculated by using the amount of glucose remaining in the medium, which averaged 39μmol and 32μmol in 24 hr and 48 hr of the treatment of acetic acid, respectively, and 34μmol and 20μmol in 24 hr and 48 hr of the treatment of insulin, respectively. The amount of glucose remaining in the control medium averaged 44μmol and 40μmol in 24 hr and 48 hr, respectively.
Amounts of fatty acid uptake and triglyceride accumulation
Differentiated L6 myotube cells were incubated with the medium containing 0.6μmol palmitic acid (300μmol/L) for 24 and 48 hrs in the presence or absence of 0.5 mM acetic acid or 0.5 mM AICAR. After the incubation, mediums and cells were collected separately and the concentration of NEFA in the mediums and the concentration of TG in the cells were determined by using commer-cial assay kits (NEFA C-Test Wako and Triglyceride E-Test Wako, respectively; Wako Pure Chem-ical Industries Ltd., Osaka, Japan). The amount of fatty acid uptake was calculated by using the concentration of fatty acid remaining in the medium, which averaged 0.263μmol and 0.075μmol in 24 hr and 48 hr of the treatment of acetic acid, respectively, and 0.183μmol and 0.149μmol in 24 hr and 48 hr of the treatment of AICAR, respectively. The amount of fatty acid remaining in the control medium averaged 0.316μmol and 0.159μmol in 24 hr and 48 hr, respectively.
Nucleotide assay
(SPD-10A, respectively; Shimazu, Kyoto, Japan) with an ODS column (HPLC PACKED COL-UMN C18 CAPCELLPAK, respectively; Shimadzu Corporation, Kyoto, Japan). The mobile phase consisted of 100 mM phosphate buffer, pH 6.3 and 0.89% methanol. Quantification was performed atλ=259 nm. All chromatographic assays were carried out at room temperature with a flow of 1.0 ml/min. Adenosine nucleotides (ATP, ADP, and AMP) were identified and quantified based on the corresponding standard compounds.
Nuclear extraction
Myotubes were grown in 10-cm dishes, treated with acetic acid or AICAR as described above, and then washed immediately with ice-cold PBS. Hypotonic buffer (10 mM HEPES pH 7.9, 1.5 mM MgCl2, 0.1 mM EDTA, 0.1% NP-40, 1 mM DTT, 1 mM PMSF, and protease inhibitors (Nacalai Tesque, Kyoto, Japan)) were added and the cells were collected. After homogenization, the extract was centrifuged for 5 min at 3,000 rpm at 4°C, and the supernatant (cytoplasmic frac-tion) was collected. The nuclear pellet was resuspended in hypertonic buffer (20 mM HEPES pH 7.9, 1.5 mM MgCl2, 400 mM NaCl, 0.1 mM EDTA, 0.1% NP-40, 10% glycerol, 1 mM DTT, 1 mM PMSF, and protease inhibitors) by pipetting. The suspension was incubated and shaken for 1 hr on ice. Then the supernatant (nuclear fraction) was collected by centrifugation at 15,000 rpm for 5 min. Protein concentration of the nuclear extract was determined by Bradford assay.
AMPK activity
To measure AMPK activity, AMPK was immunoprecipitated from cell extracts with specific antibodies against theα2-subunits bound to protein G agarose beads. The kinase activity of the immunoprecipitates was measured using SAMS peptide [HMRSAMSGLHLVKRR] and the Kinase-Glo Luminescent Kinase Assay kit (Promega, Madison, USA) according to the manu-facturer’s instructions.
Western blotting
L6 myotube cells were washed with ice-cold PBS and lysed with RIPA buffer (1x TBS pH 7.4, 0.5% deoxycholic acid, 0.1% SDS, 1% NP-40, 1 mM PMSF, 1 mM Na3VO4, 10 mM NaF, and protease
inhibitors). Following centrifugation, supernatants were used for western blotting. Protein content of supernatants was determined by Bradford assay and an aliquot (15–30μg of protein) of each extract from L6 cells was used for western blot to determine the contents of total AMPKα, phosphorylated Thr-172 AMPKα, total ACC, phosphorylated ACC, myoglobin, GLUT4, MEF2A, PGC-1αandα -tubulin. Samples were applied to 10–15% SDS-PAGE, and then proteins on the gel were transferred onto a polyvinylidene difluoride membrane (Merck, DA, Germany). The membranes were first incubated with primary antibodies overnight at 4°C, washed three times with TBST, and they were incubated with HRP-conjugated secondary antibodies for 60 min. For highly sensitive system, after the membranes were incubated with primary antibodies, they were incubated with biotin-conjugated secondary antibodies for 15–30min, and they were incubated with HRP-conjugated streptavidin for 15min. After washing three times with TBST, the chemiluminescent reaction was performed for 5 min with ImmunoStar LD (Wako Pure Chemical Industries Ltd., Osaka, Japan), according to the protocol supplied by the manufacturer. Chemiluminescent signals were visualized and quantified with ImageQuant LAS-4000 and Multi Gauge V3.2 analyzing software (Fujifilm, Tokyo, Japan).
Quantitative RT-PCR analysis
for RNA extraction. Total RNA was isolated from L6 cells by using Sepasol RNA I super G (Nacalai Tesque, Kyoto, Japan), and RNase inhibitor (TOYOBO, Osaka, Japan) was added according to the manufacturer’s instructions. Total RNA concentration was measured and cDNA was prepared with PrimeScript RT Reagent Kit with gDNA Eraser (Takara Bio, Shiga, Japan) according to the manufacturer’s instructions. Real-time quantitative PCR analyses were performed using the StepOnePlus detection system (Applied Biosystems, CA, USA) with KAPA SYBR FAST qPCR Kits (Kapa Biosystems, Wilmington, MA) for quantification of specific mRNA content. Data were normalized toβ-actin mRNA and expressed relative to untreated control cells. The oligonucleotide primers were as follows: ratβ-actin (actb) forward: 5’-GGAGATTACTGCCCTGGCTCCTA-3’, reverse: 5’-GACTCATGTACTCCTGCTTGCT G-3’, rat GLUT4 (Slc2a4), forward: 5’-GGGCGATTTCTCCCACATAC-3’, reverse: 5’-CTCAT GGGCCTAGCCAATG-3’, rat MEF2A (mef2a), forward: 5’-ATGAGAGGAACCGACAGG TG-3’, reverse: 5’-TATCCGAGTTCGTCCTGCTT-3’, rat myoglobin (Mb), forward: 5’- CTA ACAGCCGGCCTACACTC-3’, reverse: 5’-CGTGCTTCTTCAGGTCCTCT-3’, PGC-1α (ppargc1a) forward: 5’-GACCCCAGAGTCACCAAATGA-3’, reverse: 5’-GGCCTGCAGTTC CAGAGAGT-3’.
Immunofluorescence
L6 cells were fixed with 4% formaldehyde solution, incubated with 0.1% Triton X-100/PBS for 3 min, and blocked with 3% BSA/PBS for 10 min. Samples were incubated at room temperature for 1 hr with primary anti-MEF2A antibody (Santa Cruz Biotechnology) and anti-skeletal myosin antibody (SIGMA-ALDRICH, MO, USA). Then samples were washed three times with PBS and incubated with secondary antibody conjugated to Alexa Fluor at room temperature for 1 hr. Samples were counterstained with Hoechst 33258 (Polysciences, Inc., PA, USA) for 5 min and imaged using a confocal microscope (OLYMPUS FLUOVIEW FV1000, respectively; OLYMPUS, Tokyo, Japan).
Statistical analysis
For analysis of AMPK activity, specific activities of AMPK were compared using unpaired Stu-dent’s t-test. For the remaining analysis, one-way ANOVA followed by the Tukey-Kramer post hoc test for multiple comparisons was performed. P values<0.05 were considered to represent
statistical significance (p<0.05,p<0.01 compared to control). Groups without the same
let-ter represent significantly different (p<0.05).
Results
Absorption of acetic acid by differentiated L6 myotube cells
To assess the ability of L6 myotubes to absorb acetic acid, 0.5 mM acetic acid was added to cul-tured cells and the amount of acetic acid taken up by the cells was measured. Acetic acid was immediately taken up within 2 min of incubation (Fig 1).
Acetic acid raises AMP concentration in differentiated L6 myotube cells
AMP:ATP ratio during incubation with acetic acid was significantly increased in 2 min of the addition of acetic acid.
Acetic acid induces phosphorylation of AMPK and ACC in differentiated
L6 cells
To determine whether the treatment with acetic acid can induce phosphorylation of AMPK at Thr172 in L6 cells, the change of phosphorylated AMPK levels was analyzed. Phosphorylation of AMPK was significantly increased in acetic acid-treated cells compared to in non-treated control cells. Ten minutes after the addition of the indicated amount of acetic acid to the cul-ture medium, phosphorylated AMPK increased in a dose-dependent manner (Fig 2A).
Fig 1. Uptake of acetic acid by L6 myotube cells.After treatment with acetic acid (0.5 mM), acetic acid content in the medium was determined at each indicated time point and the amount of uptake by the cells was calculated. Each value is shown as the mean±SE (n = 3–6).
doi:10.1371/journal.pone.0158055.g001
Table 1. Stimulation of the AMP/ATP ratio in L6 myotube cells by treatment with acetic acid. (μmol / g of protein)
Time ATP ADP AMP Total AMP/ATP
0 min 20.95±3.65 5.53±0.71 0.86±0.07 27.35±4.45 0.041±0.007
0.5 min 18.52±2.83 6.48±0.16 2.06±0.51 27.06±2.61 0.111±0.051
2 min 19.73±1.91 6.81±0.49 4.43±0.47* 30.96±1.17 0.224±0.061*
30 min 18.95±1.01 8.66±0.31* 3.38±1.43 30.99±0.57 0.179±0.018
Adenine nucleotides (μmol/g of protein) in L6 cells treated with 0.5 mM acetic acid for the indicated times. Each value is shown as the mean±SE (n = 3–4). Results were analyzed with one-way ANOVA followed by the Tukey-Kramer post hoc test for multiple comparisons. Statistical differences are shown as*p<0.05 compared to the 0 min time point.
A time-course study revealed that incubation with 0.5 mM acetic acid increased the phos-phorylation of AMPK after the addition of acetic acid (Fig 2B). Treatment with AICAR, an AMPK activator, also increased the phosphorylation of AMPK by about 2.2-fold at 12 hr after the addition. Pre-treatment of cells with compound C and araA, potent AMPK inhibitors, sup-pressed the acetic acid induced phosphorylation of AMPK (Fig 2C and 2D). Phosphorylation of AMPK was also analyzed after treatment with other acid compounds such as 0.5 mM lactic acid and 0.5 mM citric acid. Both compounds did not enhance the phosphorylation of AMPK (Fig 2E).
One downstream target of AMPK is phosphorylation of acetyl-CoA carboxylase (ACCβ) at Ser79. Phosphorylated ACC was significantly increased at 10 min after treatment with 0.5 mM acetic acid (Fig 2F), and the addition of compound C and araA together with acetic acid led to suppression of this phosphorylation (Fig 2F and 2G). This increase in phosphorylation was also seen in the treatment with AICAR, and inhibited by addition of compound C.
Moreover, we also conducted an evaluation of AMPK activity in L6 myotube cells using the SAMS peptide as a substrate of AMPK. AMPK activity was significantly increased in cells treated with acetic acid compared to non-treated control cells (Fig 2H).
Acetic acid treatment increases mRNA and protein expression of
myoglobin and GLUT4 in L6 myotube cells
Transcripts of myoglobin and GLUT4 were increased in cells treated with acetic acid. Time-course studies revealed that mRNA levels of myoglobin gene,Mband GLUT4 gene,Slc2a4
were significantly higher than those of non-treated steady state control cells (Fig 3A and 3B). Furthermore, pre-treatment with compound C or araA and acetic acid completely suppressed the increase in expression ofMbandSlc2a4genes (Fig 3C–3F). Expression of these proteins were also significantly increased and this stimulation was completely suppressed in the pres-ence of compound C and araA (Fig 3G–3J).
Acetic acid increases glucose and fatty acid uptake, and suppresses
triglyceride accumulation in L6 myotube cells
To investigate whether the activation of AMPK by acetic acid stimulates uptake of glucose, glu-cose clearance was examined in cells treated with acetic acid. After insulin treatment, gluglu-cose uptake was approximately 3 times higher than that of non-treated controls. Similarly, acetic acid as well as AICAR treatment significantly increased glucose uptake (Fig 4A). Treatment with ace-tic acid tended to increase the utilization of fatty acid, but reduced their accumulation as triglyc-eride in the cells compared to non-treated control or AICAR treatment (Fig 4B and 4C).
Acetic acid treatment increases mRNA and protein expression of
MEF2A in L6 myotube cells
Myocyte enhancer factor 2A (MEF2A) plays an important role in the regulation of gene expres-sion of myoglobin and GLUT4 in skeletal muscle [26]. MEF2 proteins are transcription factors involved in the differentiation of skeletal muscle, and possess diverse cellular functions in skele-tal muscles or neurons. We focused on MEF2A and hypothesized that the increase inmband AMPK was immunoprecipitated from cell extracts and AMPK activity was measured using the synthetic SAMS peptide as a substrate (50μM and 150μM) (H). Each bar represents the mean±SE (n = 3–4). Results were analyzed with one-way ANOVA followed by the Tukey-Kramer post hoc test for multiple comparisons (A-G), or analyzed by an unpaired Student’s t-test (H). Statistical differences are shown as*p<0.05,**p<0.01 compared to non-treated (A). Groups without the same letter are significantly different (p<0.05) (B-G).
Slc2a4gene expression by acetic acid treatment might be associated with the function of MEF2A, as well as with the activation of AMPK.
Transcript levels ofmef2awere significantly higher in cells treated with acetic acid than those of non-treated control (Fig 5A). Pre-treatment with compound C or araA completely suppressed the induction ofmef2amRNA by acetic acid (Fig 5B and 5C). Protein expression of MEF2A was also increased upon acetic acid treatment (Fig 5D and 5E), which was abolished by compound C and araA.
Acetic acid treatment increases mRNA and protein expression of
PGC-1
α
in L6 myotube cells
Peroxisome proliferator-activated receptor-γcoactivator-1α(PGC-1α) is a transcriptional coactivator that mediates many biological processes related to energy metabolism. PGC-1α and MEF2 form a positive feedback loop [27]. Activation of AMPK has been implicated to be involved in the upregulation ofppargc1aexpression [28].
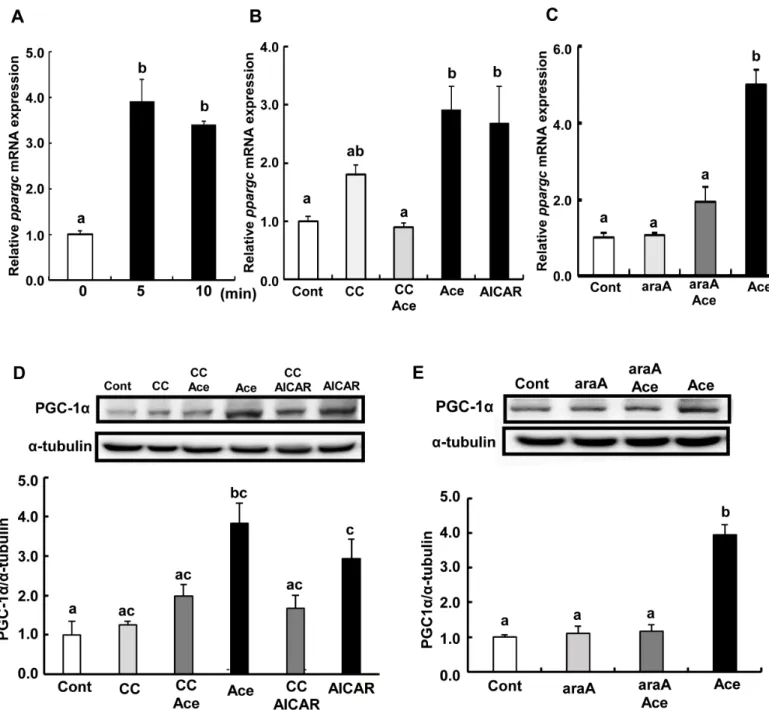
Transcript levels ofppargc1awere significantly higher in cells treated with acetic acid than in non-treated control (Fig 6A). Pre-treatment with compound C or araA, and acetic acid completely suppressed the induction ofppargc1amRNA (Fig 6B and 6C). Protein expression of PGC-1αwas also increased upon treatment with acetic acid (Fig 6D and 6E).
Acetic acid induces nuclear localization of MEF2A
The nuclear MEF2A protein level was measured by western blotting to see the nuclear localiza-tion of MEF2A. Nuclear MEF2A was significantly increased at 5 min (2.1-fold), 10 min (3.3-fold) and 30 min (2.3-fold) after treatment with acetic acid compared to non-treated con-trol (Fig 7A). In contrast, there was no change in the cytosolic MEF2A levels (Fig 7B). How-ever, nuclear localization of MEF2A was significantly reduced in the presence of compound C (Fig 7A). Furthermore, we analyzed L6 myotube cells by confocal immunofluorescence.Fig 7C is the typical image showing that MEF2A was localized in nucleus in L6 cells treated with acetic acid, while it was localized in the cytosol in the presence of compound C and in non-treated cells (Fig 7C). And the nuclear localization rate of MEF2A was significantly increased by the treatment of acetic acid (Fig 7D).
Discussion
Skeletal muscle is one of the most important insulin-responsive organs in the body [29,30], and an accumulation of locally derived fat metabolites in skeletal muscle is an important factor contributing to insulin resistance [29]. It has been demonstrated that AMPK plays a key role in regulating fat oxidation and glucose metabolism via upregulation of mitochondrial proteins, GLUT4, and several metabolic enzymes in mice, rats, or human skeletal muscles [8–14]. Pres-ent data indicate that acetic acid functions as an activator of AMPK and might be able to sup-press lipogenesis via enhancing lipid metabolism. When acetic acid is taken up into tissues, it is converted to acetyl-CoA with concomitant formation of AMP by the catalytic activity of
Fig 3. Effects of acetic acid on the expression of myoglobin and GLUT4 in L6 myotube cells.Total RNA was extracted from untreated L6 myotube cells or those treated with 0.5 mM acetic acid for the indicated time period (A;Mb, B;Slc2a4) or for 5 min after the addition of acetic acid (C;Mb, D; Slc2a4) or 0.5 mM AICAR for 12 hr, and 10μM compound C for 30 min or 2mM araA for 20min. Real-time PCR analysis was carried out for
determination ofMb(A, C, E) andSlc2a4(B, D, F) mRNA levels in L6 myotube cells. Myoglobin or GLUT4 proteins were analyzed by western blotting on the treatment of 0.5 mM acetic acid for 10 min, 0.5 mM AICAR for 12 hours, and 10μM compound C for 30 min (G, H) or 2 mM araA for 20 min (I, J). Each bar represents the mean±SE (n = 3–6). Results were analyzed with one-way ANOVA followed by the Tukey-Kramer post hoc test for multiple comparisons. Groups without the same letter are significantly different (p<0.05).
acetyl-CoA synthetase [31–36]. Acetic acid is easily absorbed by L6 myotube cells, and increases the AMP/ATP ratio in the cells. An increase in AMP/ATP ratio stimulates the phos-phorylation of AMPK. Phosphorylated AMPK increased in a dose-dependent manner with the concentration of acetic acid (Fig 2A), which was in the range of physiological blood
Fig 4. Effects of acetic acid treatment on glucose, fatty acid uptake and triglyceride accumulation in L6 myotube cells.(A)Glucose uptake by L6 cells. Differentiated L6 myotube cells were treated with 0.5 mM acetic acid and 100 nM insulin for 24 and 48 hrs in the medium (50μmol/ 2ml). Each conditioned medium was collected and measured the concentration of glucose. Amount of glucose uptake was calculated by using the amount of glucose remaining in the medium. (B) Fatty acid uptake by L6 cells. (C) TG accumulation in L6 cells. Differentiated L6 myotube cells were incubated with the medium containing 0.6μmol palmitic acid (300μmol/L) for 24 and 48 hrs in the presence or absence of 0.5 mM acetic acid or 0.5 mM AICAR. After the incubation, mediums and cells were collected separately and the concentration of NEFA in the mediums and the concentration of TG in the cells were determined. Each bar represents the mean±SE (n = 3–4). Results were analyzed with one-way ANOVA followed by the Tukey-Kramer post hoc test for multiple comparisons. Groups without the same letter are significantly different (p<0.05).
concentration of acetic acid. Pre-treatment of cells with compound C inhibited phosphoryla-tion of AMPK by acetic acid (Fig 2C). Moreover, other acids such as lactic acid or citric acid were unable to increase the phosphorylation of AMPK (Fig 2E). Activated AMPK leads to an inactivation of ACC via phosphorylation, a decrease in malonyl-CoA content, a subsequent increase in fatty acid oxidation, and a block in fatty acid synthesis. Phosphorylation of ACC significantly increased at 10 min of acetic acid treatment (Fig 2F) and it was inhibited by
pre-Fig 5. Effect of acetic acid on the expression of MEF2A in L6 myotube cells.Total RNA was extracted from untreated L6 myotube cells or cells treated with 0.5 mM acetic acid for the indicated time period (A). L6 cells were treated with 0.5 mM acetic acid for 5 min, 0.5 mM AICAR for 12 hours, and pre-treated with 10μM compound C for 30 min (B), and pre-treated with 2 mM araA for 20 min (C). Real-time PCR analysis was carried out for the determination ofmef2AmRNA level in L6 myotube cells. MEF2A protein was analyzed by western blotting in 10 min treatment of 0.5 mM acetic acid, 0.5 mM AICAR for 12 hours, and 10μM compound C for 30 min (D) or 2 mM araA for 20 min (E). Each bar represents the mean±SE (n = 3–6). Results were analyzed with one-way ANOVA followed by the Tukey-Kramer post hoc test for multiple comparisons. Groups without the same letter are significantly different (p<0.05).
treatment with compound C and araA (Fig 2F and 2G). In our previous study, chronic intake of acetic acid induced gene expression of myoglobin and GLUT4 in skeletal muscle of rats, and the rats showed a higher rate of oxygen consumption and a smaller size of lipid droplets in white adipose tissue [15]. In this study, transcripts and protein levels of myoglobin and GLUT4 were increased in acetic acid-treated L6 myotube cells. Pre-treatment of acetic acid treated cells
Fig 6. Effect of acetic acid on the expression of PGC-1αin L6 myotube cells.Total RNA was extracted from untreated L6 myotube cells or cells treated with 0.5 mM acetic acid for the indicated time period (A). L6 cells were treated with 0.5 mM acetic acid for 5 min, 0.5 mM AICAR for 12 hours, and pre-treated with 10μM compound C for 30 min (B) or 2 mM araA for 20 min (C), and total RNA were isolated. Real-time PCR analysis was carried out for the determination ofppargc1amRNA level in L6 myotube cells. PGC-1αprotein level was analyzed by western blotting in 5 min treatment with 0.5 mM acetic acid, 0.5 mM AICAR for 12 hours, and 10μM compound C for 30 min (D) or 2 mM araA for 20 min (E). Each bar represents the mean±SE (n = 3–6). Results were analyzed with one-way ANOVA followed by the Tukey-Kramer post hoc test for multiple comparisons. Groups without the same letter are significantly different (p<0.05).
with compound C and araA completely suppressed the increase of myoglobin and GLUT4 gene and protein expression (Fig 3C, 3E and 3D–3J), suggesting that acetic acid induces globin and GLUT4 transcription through the AMPK-mediated signaling pathway in L6 myo-tube cells. Myoglobin is expressed in cardiac and skeletal myocytes, and it plays a role in the diffusion of oxygen and to maintain mitochondrial respiration [37]. The myoglobin gene is expressed depending on myofiber subtypes, and the expression is regulated by environmental stimuli such as chronic hypoxia and endurance exercise training [17–20]. GLUT4 is one of the glucose transport proteins and is responsible for insulin-mediated glucose uptake in muscle and adipose tissue. It was shown that glucose homeostasis depends on the level of GLUT4 expression [38–40].
Transcription of myoglobin and GLUT4 genes is regulated by myocyte enhancer factor 2 (MEF2), which is a transcription factor involved in skeletal muscle differentiation [23–25,41–
44]. The MEF2 family is comprised of four members, MEF2A, B, C and D [26,45], and belongs to the MCM1-agamous-deficiens-serum response factor (MADS) supergene family of DNA binding proteins [45–47]. MEF2B is a unique member of the MEF2 gene family [48] and its expression is restricted to myogenic lineages during early embryo development [49]. MEF2D is expressed in proliferating myoblasts prior to the onset of differentiation [26,50]. MEF2C is expressed late in the differentiation program, and MEF2A protein appears in cells entering the differentiation pathway and the expression is regulated at multiple levels during development and differentiation [26]. The predominant MEF2 DNA-binding complex in muscle cells is composed of MEF2A homodimers [26]. There is a MEF2 binding site in GLUT4 promoters that contains the binding site of a MEF2A-MEF2D heterodimer [51]. Reduced MEF2A expres-sion accounts for the reduction in DNA binding activity and directly correlates with the decrease in GLUT4 gene expression [51]. MEF2A is a substrate for p38 mitogen-activated pro-tein (MAP) kinase (MAPK), and threonines 312 and 319 within the transcription activation domain of MEF2A are phosphorylated by p38 [52]. Phosphorylated MEF2A enhances MEF2--dependent gene expression. MAPK-inMEF2--dependent pathways such as the AMPK-associated path-way have also been implicated in the regulation of MEF2 [53]. Treatment of human skeletal muscle cells with AICAR, a pharmacological activator of AMPK, stimulated MEF2 DNA bind-ing activity [53]. AICAR-mediated MEF2 DNA binding was independent of p38 MAPK activa-tion, and it was completely inhibited by an AMPK inhibitor, compound C [53]. AICAR-injected rats showed increased nuclear MEF2 DNA binding activity, and chronic AICAR treat-ment dramatically increased the expression of glucose transport protein GLUT4 in muscle [54]. In this study, we observed that MEF2A nuclear localization was increased upon treatment with acetic acid and it was inhibited by pre-treatment with compound C (Fig 7). Furthermore, transcripts of MEF2A and PGC-1αgenes were significantly increased in cells treated with ace-tic acid (Fig 5A–5Cand6A–6C). PGC-1αplays a key role in the regulation of mitochondrial biogenesis and oxidative metabolism and its activity has been reported to be regulated by AMPK [55]. MEF2A and PGC-1αcontain a MEF2A binding site in their promoter sequences [27,56] and their gene expression was coordinated with one another [27]. Those findings implicate that acetic acid induced expression of both MEF2A and PGC-1αas well as of myo-globin and GLUT4 genes might be caused by an increase in nuclear localization of MEF2A via the activation of AMPK.
De Angelis et al. showed that transforming growth factorβ(TGF-β) inhibited myogenesis and prevented the activation of the transcriptional complex related to MEF2A through MEF2A was calculated (D). Each bar represents the mean±SE (n = 3–4). Results were analyzed with one-way ANOVA followed by the Tukey-Kramer post hoc test for multiple comparisons. Groups without the same letter are significantly different (p<0.05).
localization of MEF2A in the cytoplasm [57]. Furthermore, activated AMPK inhibited TGF-β, Smad3 gene expression, and TGF-β-induced myofibroblast differentiation [58–60]. In this study, MEF2A, which contains a nuclear localization sequence at its C-terminus [26,61], was localized in the nucleus shortly after treatment with acetic acid and exported to the cytoplasm 30 min after treatment. Investigation of the transport mechanism of MEF2A upon treatment with acetic acid is currently underway.
mRNA and protein expression levels of MEF2A were significantly increased upon treatment with acetic acid in L6 myotube cells (Fig 5). In addition, pre-treatment of acetic acid-treated cells with compound C completely suppressed the increase in MEF2A mRNA and protein expression levels (Fig 5B and 5D). A ChIP assay revealed that the MEF2A promoter contains a MEF2A binding site and that MEF2A would associate with the site to control the MEF2A tran-scription [56]. These results implicate that increased expression of MEF2A by acetic acid might be caused by increased nuclear localized MEF2A via the activation of AMPK.
Activation of AMPK is linked to lipid catabolism and improvement of insulin sensitivity [14]. Numerous AMPK activators have been described including adiponectine or berberine. Adiponectine, which is an adipocytokine preventing metabolic syndrome or atherosclerosis, activates AMPK in skeletal muscle and improves insulin sensitivity [28,62]. Berberine, a food component, has an effect on AMPK activation, adipose tissues, and macrophages [63,64]. In this study, acetic acid activated AMPK, induced gene and protein expression of myoglobin and GLUT4, stimulated glucose incorporation, and suppressed lipid accumulation in L6 cells. Thus, acetic acid has the potential to prevent metabolic disorders through the activation of AMPK.
Acknowledgments
This work was supported by JSPS KAKENHI Grant Number 15K07437 for Grant-in-Aid for Scientific Research (C) and 26850087 for Grant-in-Aid for Young Scientists (B). The founders had no role in study design, data collection and analysis, decision to publish, or preparation of the manuscript.
Author Contributions
Conceived and designed the experiments: HY. Performed the experiments: HM. Analyzed the data: HM YY AA. Contributed reagents/materials/analysis tools: MK YT. Wrote the paper: HM HY.
References
1. Guariguata L, Whiting DR, Hambleton I, Beagley J, Linnenkamp U, Shaw JE. Global estimates of dia-betes prevalence for 2013 and projections for 2035. Diadia-betes Res Clin Pract 2014 Feb; 103
2. Boden G, Jadali F, White J, Liang Y, Mozzoli M, Chen X, et al. Effects of fat on insulin-stimulated carbo-hydrate metabolism in normal men. J Clin Invest. 1991 Sep; 88(3):960–966 PMID:1885781
3. Roden M, Price TB, Perseghin G, Petersen KF, Rothman DL, Cline GW, et al. Mechanism of free fatty acid-induced insulin resistance in humans. J Clin Invest. 1996 Jun 15; 97:2859–2865. PMID:8675698
4. Magnan C, Gilbert M and Kahn BB. Chronic free fatty acid infusion in rats results in insulin resistance but no alteration in insulin-responsive glucose transporter levels in skeletal muscle. Lipids. 1996 Nov; 31(11):114–1149
5. Dresner A, Laurent D, Marcucci M, Griffin ME, Dufour S, Cline GW, et al. Effect of free fatty acids on glu-cose transport and IRS-1-associated phosphatidylinositol 3-kinase activity. J Clin Invest. 1999 Jan; 103(2):253–259 PMID:9916137
7. Yamashita H, Kaneyuki T, Tagawa K. Production of acetate in the liver and its utilization in peripheral tissues. Biochim Biophys Acta, 2001 May 31; 1532(1–2):79–87 PMID:11420176
8. Moore F, Weekes J, Hardie DG. Evidence that AMP triggers phosphorylation as well as direct allosteric activation of rat liver AMP-activated protein kinase. Eur J Biochem. 1999 Aug 1; 199(3):691–697
9. Winder WW and Harie DG. Inactivation of acetyl-CoA carboxylase and activation of AMP-activated pro-tein kinase in muscle during exercise. Am J Physiol. 1996 Feb; 270(2 Pt 1):E299–E304 PMID: 8779952
10. Winder WW and Harie DG. AMP-activated protein kinase, a metabolic master switch: possible roles in type 2 diabetes. Am. J. Physiol. 1999 Jul; 277(1 Pt 1):E1–E10 PMID:10409121
11. Hardie DG. The AMP-activated protein kinase cascade: the key sensor of cellular energy status. Endo-crinology. 2003 Dec; 144(12):5179–5183 PMID:12960015
12. Minokoshi Y, Kim YB, Peroni OD, Fryer LG, Müller C, et al. Leptin stimulates fatty-acid oxidation by acti-vating AMP-activated protein kinase. Nature. 2002 Jan 17; 415(6869):339–343. PMID:11797013
13. Hardie DG, Scott JW, Pan DA, Hudson ER. Management of cellular energy by the AMP-activated pro-tein kinase system. FEBS Lett. 2003 Jul 3; 546(1):113–120. PMID:12829246
14. Hardie DG. Sensing of energy and nutrients by AMP-activated protein kinase. Am J Clin Nutr. 2011 Apr; 93(4):891S–896S. doi:10.3945/ajcn.110.001925PMID:21325438
15. Yamashita H, Maruta H, Jozuka M, Kimura R, Iwabuchi H, Yamato M, et al. Effects of acetate on lipid metabolism in muscles and adipose tissues of type 2 diabetic Otsuka Long-Evans Tokushima Fatty (OLETF) rats. Biosci Biotechnol Biochem. 2009 Mar 23; 73(3):570–576 PMID:19270372
16. Hardie DG. Minireview: the AMP-activated protein kinase cascade: the key sensor of cellular energy status. Endocrinology. 2003 Dec; 144(12):5179–5183. PMID:12960015
17. Kanatous SB, DiMichele LV, Cowan DF, Davis RW. High aerobic capacities in the skeletal muscles of pinnipeds: adaptations to diving hypoxia. J Appl Physiol (1985). 1999 Apr; 86(4):1247–1256.
18. Neufer PD, Ordway GA, Williams RS. Transient regulation of c-fos,αB-crystallin, and hsp70 in muscle during recovery from contractile activity. Am J Physiol. 1998 Feb; 274(2 Pt 1):C341–C346. PMID: 9486122
19. Underwood LE, Williams RS. Pretranslational regulation of myoglobin gene expression. Am J Physiol. 1987 Apr; 252(4 Pt 1):C450–C453. PMID:3565559
20. Holloszy JO, Booth FW. Biochemical adaptations to endurance exercise in muscle. Annu Rev Physiol. 1976; 38:273–291. PMID:130825
21. Gossett LA, Kelvin DJ, Sternberg EA, Olson EN. A new myocyte-specific enhancer-binding factor that recognizes a conserved element associated with multiple muscle-specific genes. Mol Cell Biol. 1989 Nov; 9(11):5022–5033. PMID:2601707
22. Murgia M, Jensen TE, Cusinato M, Garcia M, Richter EA, Schiaffino S. Multiple signalling pathways redundantly control glucose transporter GLUT4 gene transcription in skeletal muscle. J Physiol. 2009 Sep 1; 587(Pt 17):4319–4327 doi:10.1113/jphysiol.2009.174888PMID:19596898
23. Black BL, Molkentin JD, Olson EN. Multiple roles for the MyoD basic region in transmission of transcrip-tional activation signals and interaction with MEF2. Mol Cell Biol. 1988 Jan; 18(1):69–77
24. Kaushal S, Schneider JW, Nadal-Ginard B, Mahdavi V. Activation of the myogenic lineage by MEF2A, a factor that induces and cooperates with MyoD. Science. 1994 Nov 18; 266(5188):1236–1240 PMID: 7973707
25. Molkentin JD, Black BL, Martin JF, Olson EN. Cooperative activation of muscle gene expression by MEF2 and myogenic bHLH proteins. Cell. 1995 Dec 29; 83(7):1125–1136 PMID:8548800
26. Black BL, Olson EN. Transcriptional control of muscle development by myocyte enhancer factor-2 (MEF2) proteins. Annu Rev Cell Dev Biol. 1998; 14:167–196 PMID:9891782
27. Handschin C, Rhee J, Lin J, Tarr PT, Spiegelman BM. An autoregulatory loop controls peroxisome pro-liferator-activated receptor gamma coactivator 1alpha expression in muscle. Proc Natl Acad Sci U S A. 2003 Jun 10; 100(12):7111–7116. PMID:12764228
28. Iwabu M1, Yamauchi T, Okada-Iwabu M, Sato K, Nakagawa T, et al. Adiponectin and AdipoR1 regulate PGC-1a and mitochondria by Ca2+and AMPK/SIRT1. Nature. 2010 Apr 29; 464(7293):1313
–1319. doi:10.1038/nature08991PMID:20357764
29. Kim JK, Fillmore JJ, Chen Y, Yu C, Moore IK, Pypaert M, et al. Tissue-specific overexpression of lipo-protein lipase causes tissue-specific insulin resistance. Proc Natl Acad Sci USA. 2001 Jun 19; 98 (13):7522–7527 PMID:11390966
31. Ballard FJ. Supply and utilization of acetate in mammals. Am J Clin Nutr. 1972 Aug; 25(8):773–779. PMID:4558368
32. Knowles SE, Jarrett IG, Filsell OH, Ballard FJ. Production and utilization of acetate in mammals. Bio-chem J. 1974 Aug; 142(2):401–411. PMID:4441381
33. Skutches CL, Holroyde CP, Myers RN, Paul P, Reichard GA. Plasma acetate turnover and oxidation. J Clin Invest. 1979 Sep; 64(3):708–713. PMID:468985
34. Bremer J., and Osmundsen H., Fatty acid oxidation and its regulation. In“Fatty Acid Metabolism and Its Regulation,”ed. Numa S., Elsevier Science Publishers, Amsterdam, pp. 113–154 (1984).
35. Pouteau E, Piloquet H, Maugeais P, Champ M, Dumon H, et al. Kinetic aspect of acetate metabolism in healthy humans using [1-13C] acetate. Am J Physiol. 1996 Jul; 271(1 Pt 1):E58–E64. PMID:8760082 36. Mittendorfer B, Sidossis LS, Walser E, Chinkes DL, Wolfe RR. Regional acetate kinetics and oxidation
in human volunteers. Am J Physiol. 1998 Jun; 274(6 Pt 1):E978–E983. PMID:9611145
37. Wittenberg BA, Wittenberg JB. Transport of oxgen in muscle. Annu Rev Physiol. 1989; 51:857–878. PMID:2653210
38. Tsao TS, Burcelin R, Katz EB, Huang L, Charron MJ. Enhanced insulin action due to targeted GLUT4 overexpression exclusively in muscle. Diabetes. 1996 Jan; 45(1):28–36. PMID:8522056
39. Treadway JL, Hargrove DM, Nardone NA, McPherson RK, Russo JF, et al. Enhanced peripheral glu-cose utilization in transgenic mice expressing the human GLUT4 gene. J Biol Chem. 1994 Nov 25; 269 (47):29956–29961. PMID:7961994
40. Shepherd PR, Gnudi L, Tozzo E, Yang H, Leach F, et al. Adipose cell hyperplasia and enhanced glu-cose disposal in transgenic mice overexpressing GLUT4 selectively in adipose tissue. J Biol Chem. 1993 Oct 25; 268(30):22243–22246. PMID:8226728
41. Lin J, Wu H, Tarr PT, Zhang CY, Wu Z, et al. Transcriptional co-activator PGC-1αdrives the formation of slow-twitch muscle fibres. Nature. 2002 Aug 15; 418(6899):797–801. PMID:12181572
42. Thai MV, Guruswamy S, Cao KT, Pessin JE, Olson AL. Myocyte enhancer factor 2 (MEF2)-binding site is required for GLUT4 gene expression in transgenic mice. Regulation of MEF2 DNA binding activity in insulin-deficient diabetes. J Biol Chem. 1998 Jun 5; 273(23):14285–14292 PMID:9603935
43. Holmes BF, Sparling DP, Olson AL, Winder WW, Dohm GL. Regulation of muscle GLUT4 enhancer factor and myocyte enhancer factor 2 by AMP-activated protein kinase. Am J Physiol Endocrinol Metab. 2005 Dec; 289(6):E1071–E1076. PMID:16105857
44. Liu ML, Olson AL, Edgington NP, Moye-Rowley WS, Pessin JE. Myocyte enhancer factor 2 (MEF2) binding site is essential for C2C12 myotube-specific expression of the rat GLUT4/muscle-adipose facili-tative glucose transporter gene. J Biol Chem. 1994 Nov; 269(45):28514–2821 PMID:7545962
45. Olson EN, Perry M, Schulz RA. Regulation of muscle differentiation by the MEF2 family of MADS box transcription factors. Dev Biol. 1995 Nov; 172(1):2–14 PMID:7589800
46. Pollock R, Treisman R. Human SRF-related proteins: DNA-binding properties and potential regulatory targets. Genes Dev. 1991 Dec; 5(12A):2327–2341 PMID:1748287
47. Yu YT, Breitbart RE, Smoot LB, Lee Y, Mahdavi V, Nadal-Ginard B. Human myocyte-specific enhancer factor 2 comprises a group of tissue-restricted MADS box transcription factors. Genes Dev. 1992 Sep; 6(9):1783–1798 PMID:1516833
48. Morisaki T, Sermsuvitayawong K, Byun SH, Matsuda Y, Hidaka K, Morisaki H, et al. Mouse Mef2b gene: unique member of MEF2 gene family. J Biochem. 1997 Nov; 122(5):939–946 PMID:9443808
49. Molkentin JD, Firulli AB, Black BL, Martin JF, Hustad CM, Copeland N, et al. MEF2B is a potent transac-tivator expressed in early myogenic lineages. Mol Cell Biol. 1996 Jul; 16(7):3814–3824 PMID: 8668199
50. Han TH, Prywes R., Regulatory role of MEF2D in serum induction of the c-jun promoter. Mol Cell Biol. 1995 Jun; 15(6): 2907–2915 PMID:7760790
51. Mora S, Pessin JE. The MEF2A isoform is required for striated muscle-specific expression of the insu-lin-responsive GLUT4 glucose transporter. J Biol Chem. 2000 May 26; 275(21):16323–16328 PMID: 10748204
52. Zhao M, New L, Kravchenko VV, Kato Y, Gram H, et al. Regulation of the MEF2 family of transcription factors by p38. Mol Cell Biol. 1999 Jan; 19(1):21–30. PMID:9858528
53. Al-Khalili L, Chibalin AV, Yu M, Sjödin B, Nylén C, et al. MEF2 activation in differentiated primary human skeletal muscle cultures requires coordinated involvement of parallel pathways. Am J Physiol Cell Physiol. 2004 Jun; 286(6):C1410–C1416. PMID:14960415
55. Irrcher I, Ljubicic V, Kirwan AF, Hood DA. AMP-activated protein kinase-regulated activation of the PGC-1alpha promoter in skeletal muscle cells. PLoS One. 2008; 3(10):e3614. doi:10.1371/journal. pone.0003614PMID:18974883
56. Ramachandran B, Yu G, Gulick T. Nuclear respiratory factor 1 controls myocyte enhancer factor 2A transcription to provide a mechanism for coordinate expression of respiratory chain subunits. J Biol Chem. 2008 May 2; 283(18):11935–11946. doi:10.1074/jbc.M707389200PMID:18222924
57. De Angelis L, Borghi S, Melchionna R, Berghella L, Baccarani-Contri M, Parise F, et al. Inhibition of myogenesis by transforming growth factor beta is density-dependent and related to the translocation of transcription factor MEF2 to the cytoplasm. Proc Natl Acad Sci U S A. 1998 Oct 13; 95(21):12358– 12363 PMID:9770491
58. Mishra R, Cool BL, Laderoute KR, Foretz M, Viollet B, Simonson MS., AMP-activated protein kinase inhibits transforming growth factor-beta-induced Smad3-dependent transcription and myofibroblast transdifferentiation. J Biol Chem. 2008 Apr 18; 283(16):10461–10469 doi:10.1074/jbc.M800902200 PMID:18250161
59. Akhmetshina A, Palumbo K, Dees C, Bergmann C, Venalis P, Zerr P, et al. Activation of canonical Wnt signalling is required for TGF-β-mediated fibrosis. Nat Commun. 2012 Mar 13; 3:735 doi:10.1038/ ncomms1734PMID:22415826
60. Sharma K. Obesity, oxidative stress, and fibrosis in chronic kidney disease. Kidney Int Suppl (2011). 2014 Nov; 4 (1):113–117
61. 61Yu YT. Distinct domains of myocyte enhancer binding factor-2A determining nuclear localization and cell type-specific transcriptional activity. J Biol Chem. 1996 Oct 4; 271(40):24675–24683 PMID: 8798735
62. Zhou L1, Deepa SS, Etzler JC, Ryu J, Mao X, et al. Adiponectin activates AMP-activated protein kinase in muscle cells via APPL1/LKB1-dependent and phospholipase C/Ca2+/Ca2+/calmodulin-dependent protein kinase kinase-dependent pathways. J Biol Chem. 2009 Aug 14; 284(33):22426–22435. doi: 10.1074/jbc.M109.028357PMID:19520843
63. Lee YS, Kim WS, Kim KH, Yoon MJ, Cho HJ, et al. Berberine, a natural plant product, activates AMP-activated protein kinase with beneficial metabolic effects in diabetic and insulin-resistant states. Diabe-tes. 2006 Aug; 55(8):2256–2264. PMID:16873688