O R I G I N A L A R T I C L E UDC: 355/359:61]::[613.25+616-008.9 DOI: 10.2298/VSP141120112F
Prevalence of overweight and obesity in professional soldiers of the
Czech Army over an 11-year period
Prevalencija prekomerne telesne mase i gojaznosti kod profesionalnih vojnika
Vojske
Č
eške u 11-godišnjem periodu
Jana Fajfrová*, Vladimír Pavlík*, Jan Psutka*, Michaela Husarová*, Pavla Krutišová*, Miroslav Fajfr†
*Faculty of Military Health Sciences, University of Defence, Hradec Kralove, Czech Republic; †6th Field Hospital, Hradec Kralové, Czech Republic
Abstract
Background/Aim. Obesity is currently considered to be the most frequent metabolic disease worldwide, not only in devel-oped but also in developing countries. The aim of this work was to describe the development of health status in soldiers of the Armed Forces of the Czech Republic (ACR) and to emphasize the markers of non-communicable diseases.Our study describes the anthropometric and biochemical parameters of a large group of Czech Army professional soldiers. Data were obtained over a period of 11 years. Methods. During the monitored period, from 1999 to 2009, military physicians carried out on the average 6,360 examinations on professional soldiers per year and moni-tored their health and nutritional status with the aim of prevent-ing the risk factors of non-communicable diseases. These exami-nations are compulsory for all professional soldiers at the age of 25, 30, 33, and 36 years. From the age of 39, these examinations are carried out every year till the end of their career. Besides tak-ing personal histories and carrytak-ing out standard physical exami-nations, blood was taken for biochemical examination. The fol-lowing anthropometric parameters were monitored: body consti-tution using body mass index (BMI) and waist circumference. Our study describes only part of the data concerning anthro-pometric and biochemical parameters of professional soldiers which were obtained over a period of 11 years. Results. Average BMI values in men were in the overweight range (26.5–27 kg/m2). Average values of waist circumference, however, ranged
from 91.9 cm to 93.4 cm. Between the first and the last year of monitoring a statistically significant decrease in these values rang-ing from 93.4 ± 9.8 cm to 92.7 ± 9.5 cm (p < 0.001) was
ob-served. All monitored anthropometric parameters in female pro-fessional soldiers were within normal limits. During the moni-tored period the proportion of overweight men gradually in-creased from 52% to 57.1% (p < 0.001). There were no statisti-cally significant changes in the prevalence of obesity in men (12– 15%). Average glycaemia levels were within normal range in both men and women. A statistically significant decrease in these lev-els, however, was observed in men (from 5.1 ± 0.9 mmol/L to 4.8 ± 0.7 mmol/L (p < 0.001) and in women (from 4.9 ± 0.6 mmol/L to 4.6 ± 0.6 mmol/L (p < 0.001). Concerning the lipid profile in men, a significant decrease in average values of total cholesterol, triglycerides and LDL cholesterol was observed; from 5.5 ± 1.1 mmol/L to 5.1 ± 1.0 mmol/L (p < 0.001), from 2.0 ± 1.6 mmol/L to 1.6 ± 1.2 mmol/L (p < 0.001) and from 3.4 ± 1.1 mmol/L to 3.2 ± 0.9 mmol/L (p < 0.001), respectively. Conclusion. During the monitored period only one-third of military professionals had normal body weight. More favorable situation was in female professional soldiers, two-thirds of them had normal body weight during the monitored period. Addition-ally, the increase in the number of individuals with BMI values in the overweight range was observed. Although the number of overweight soldiers was overestimated as a result of the inclusion of individuals with increased body weight due to well-developed musculature, the number of overweight and obese soldiers is still high.
Key words:
overweight; obesity; military personnel; prevalence; czech republic.
Apstrakt
Uvod/Cilj. Gojaznost se smatra najučestalijim metaboličkim obo-ljenjem u svetu, ne samo u razvijenim, već i u zemljama u razvoju. Cilj ove studije bio je da se analizira stanje zdravlja vojnika oruža-nih snaga Republike Češke (Armed Forces of the Czech Republic – ACR) i da se ukaže na markere nezaraznih bolesti. Ova studija opi-suje antropometrijske i biohemijske parametre velike grupe
fi-zikalnih pregleda, uzima se i krv za biohemijske analize. Kontroli-sani su sledeći antropometrijski parametri: građa tela pomoću in-deksa telesne mase (body mass index – BMI) i obima struka. Ova studija obuhvatila je samo jedan deo podataka o antropometrijskim i biohemijskim parametrima profesionalnih vojnika prikupljenih tokom 11 godina. Rezultati. Prosečne vrednosti BMI za muškarce bile su u opsegu prekomerne težine (26,5–27 kg/m2). Prosečne
vrednosti za obim struka, međutim, bile su od 91,9 cm do 93,4 cm. Između prve i poslednje godine praćenja, statistički značajan pad ovih vrednosti kretao se od 93,4 ± 9,8 cm do 92,7 ± 9,5 cm (p < 0,001). Svi posmatrani antropometrijski parametri kod ženskih profesionalnih vojnika bili su u granicama normale. U navedenom periodu proporcija gojaznih muškaraca postepeno je rasla od 52% do 57,1% (p < 0,001). Nije bilo statistički značajne promene preva-lencije gojaznosti muškaraca (12–15%). Prosečne glikemijske vred-nosti bile su u opsegu normalnih i za muškarce i za žene. Statistički značajan pad tih nivoa, međutim, ustanovljen je kod muškaraca (od 5,1 ± 0,9 mmol/L do 4,8 ± 0,7 mmol/L) (p < 0,001) i kod žena
(4,9 ± 0,6 mmol/L do 4,6 ± 0,6 mmol/L) (p < 0,001). Što se tiče lipidnog profila muškaraca, zapažen je značajan pad prosečnih vre-dnosti ukupnog holesterola, triglicerida i LDL holesterola (od 5,5 ± 1,1 mmol/L do 5,1 ± 1,0 mmol/L) (p < 0,001), od 2,0 ± 1,6 mmol/L do 1,6 ± 1,2 mmol/L) (p < 0,001) i od 3,4 ± 1,1 mmol/L do 3,2 ± 0,9 mmol/L (p < 0,001), redom. Zaključak. Tokom pe-rioda posmatranja samo je 1/3 vojnih profesionalaca imala nor-malnu telesnu masu. Mnogo povoljnija situacija bila je kod ženskih profesionalnih vojnika, te je 2/3 njih imalo normalnu telesnu masu tokom perioda praćenja. Osim toga, primećen je rast broja osoba sa vrednostima BMI izvan opsega prekomerne telesne masu. Iako je broj gojaznih vojnika precenjen kao posledica uključivanja osoba sa povećanom telesnom masom zbog dobro razvijene muskulatu-re, broj prekomerno teških i gojaznih vojnika ipak je veliki.
Ključne reči:
telesna masa, prekomerna; gojaznost; kadar, vojni; prevalenca; češka.
Introduction
Obesity is currently considered to be the most frequent metabolic disease worldwide, not only in developed but also in developing countries. Not only adults are affected, but al-so more and more often children and teenagers. Despite con-tinuous progress in treatment of obesity, the prevalence is constantly increasing 1–3. It is, thus, necessary to carry out preventive and interventional procedures aimed not only at individuals, but also at specific groups in the population 4.
The aim of this work was to describe the development of health status in soldiers of the Armed Forces of the Czech Republic (ACR). Our study describes anthropometric and biochemical parameters of a large group of Czech Army pro-fessional soldiers which were obtained over a period of 11 years. Before the introduction of the Programme of Extended Preventive Care into the Czech Army no valid data concer-ning overweight or obesity of soldiers were available. These data have been available only since 1999.
Methods
The Programme of Extended Preventive Care was in-troduced into the Czech Army in 1999 and has been imple-mented every year since then 5, 6. The programme is focused on detecting risk factors in professional soldiers. Examina-tions are carried out by military physicians at the Medical Service Centers of catchment areas. The examinations are compulsory for all professional soldiers at the age of 25, 30, 33, and 36 years. From the age of 39, these examinations are carried out every year till the end of their career. Besides tak-ing personal histories and carrytak-ing out standard physical ex-aminations, blood is sampled for a biochemical examination of glucose, lipid and protein metabolism and liver enzymes. The following biochemical parameters are assessed: fasting glycaemia, total cholesterol, high-density lipoprotein (HDL) cholesterol, low-density lipoprotein (LDL) cholesterol and triglyceride levels. A venous blood sample is taken on an empty stomach and the above-mentioned parameters are
de-termined in certified laboratories using standard laboratory techniques. The following anthropometric parameters are monitored: body constitution using body mass index (BMI) and waist circumference. Attention is focused especially on the risks factors of metabolic diseases, overweight and obe-sity and the comorbidities resulting from them. Our study de-scribes only part of the data concerning anthropometric and biochemical parameters of professional soldiers which were obtained over a period of 11 years. The obtained data are presented as an average, with a standard deviation, and a percentage representation of probands in individual catego-ries of the above-mentioned parameters. An assessment of the first and the last year of monitoring was performed using a Student`s t-test. In order to calculate the proportions of in-dividuals in selected categories contingency tables were used followed by the χ2 test for testing the difference in frequen-cies of the groups. A value ≤ 0.05 was considered as statisti-cally significant. Statistical analysis of data was performed using the Statistica CZ 12 software (the StatSoft, USA).
Results
During the monitored period, from 1999 to 2009, mili-tary physicians carried out on the average 6,360 examina-tions on professional soldiers per year. The number of sol-diers examined in the individual years of the monitored pe-riod gradually increased. In 2009 over 8,000 men and women were examined. The number of examined women gradually tripled. In 2009 there were 975 female soldiers in all age categories. Between the first and the last year of monitoring a statistically significant increase in BMI values and body weight in men was observed. On the contrary, waist circumference decreased.
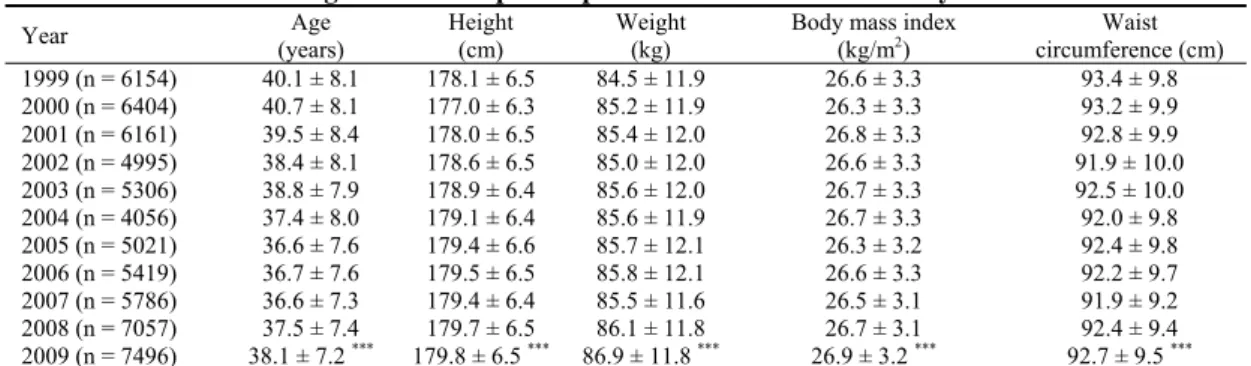
both genders (from 178.1 cm to 179.8 cm in men and from 165.9 cm to 167.1 cm in women). A statistically significant increase in body weight (from 84.5 kg to 86.9 kg; p < 0.001) was observed only inmen. Average values of BMI and waist circumference in male and female professional soldiers are shown in Tables 1 and 2. Average BMI values in men were constantly in the overweight range between the years 1999 and 2009 (26.5–27 kg/m2). During the monitored period a slight increase in BMI was observed (from 26.6 ± 3.3 kg/m2 to 26.9 ± 3.2 kg/m2; (p < 0.001). On the contrary, average values of waist circumference in men ranged from 91.9 cm
to 93.4 cm. There was a statistically significant decrease in waist circumference between the first and the last year of monitoring (from 93.4 ± 9.8 cm to 92.7 ± 9.5 cm; p < 0.001). The average BMI values in women ranged from 23.5 kg/m2 to 25 kg/m2.During the monitored period no statistically sig-nificant change in these values was observed. The average values of waist circumference ranged from 75.4 cm to 78.5 cm. A slight increase in these values ranging from 77.4 cm to 78.2 cm was observed. However, this increase was not statistically significant. Figures 1–4 show frequencies of BMI and waist circumference categories in both men and women.
Table 1 Average values of separate parameters in men within 11 years
Year Age
(years)
Height Weight
(cm) (kg)
Body mass index
(kg/m2) circumference (cm) Waist
1999 (n = 6154) 40.1 ± 8.1 178.1 ± 6.5 84.5 ± 11.9 26.6 ± 3.3 93.4 ± 9.8
2000 (n = 6404) 40.7 ± 8.1 177.0 ± 6.3 85.2 ± 11.9 26.3 ± 3.3 93.2 ± 9.9
2001 (n = 6161) 39.5 ± 8.4 178.0 ± 6.5 85.4 ± 12.0 26.8 ± 3.3 92.8 ± 9.9
2002 (n = 4995) 38.4 ± 8.1 178.6 ± 6.5 85.0 ± 12.0 26.6 ± 3.3 91.9 ± 10.0
2003 (n = 5306) 38.8 ± 7.9 178.9 ± 6.4 85.6 ± 12.0 26.7 ± 3.3 92.5 ± 10.0
2004 (n = 4056) 37.4 ± 8.0 179.1 ± 6.4 85.6 ± 11.9 26.7 ± 3.3 92.0 ± 9.8
2005 (n = 5021) 36.6 ± 7.6 179.4 ± 6.6 85.7 ± 12.1 26.3 ± 3.2 92.4 ± 9.8
2006 (n = 5419) 36.7 ± 7.6 179.5 ± 6.5 85.8 ± 12.1 26.6 ± 3.3 92.2 ± 9.7
2007 (n = 5786) 36.6 ± 7.3 179.4 ± 6.4 85.5 ± 11.6 26.5 ± 3.1 91.9 ± 9.2
2008 (n = 7057) 37.5 ± 7.4 179.7 ± 6.5 86.1 ± 11.8 26.7 ± 3.1 92.4 ± 9.4
38.1 ± 7.2 *** 179.8 ± 6.5 *** 86.9 ± 11.8 *** 26.9 ± 3.2 *** 92.7 ± 9.5 ***
2009 (n = 7496)
Statistical significance between the years 1999 and 2009 at the significance level – *p < 0.05, **p < 0.01, ***p < 0.001.
Table 2 Average values of separate parameters in women within 11 years
Years Age
(years)
Height (cm)
Weight (kg)
Body mass index (kg/m2)
Waist circumference (cm)
1999 (n = 330) 36.2 ± 7.2 165.9 ± 6.2 66.2 ± 12.2 24.0 ± 4.2 77.4 ± 10.9
2000 (n = 371) 36.7 ± 7.5 166.0 ± 6.1 67.9 ± 12.6 24.7 ± 4.5 78.5 ± 11.8
2001 (n = 431) 35.8 ± 7.0 166.6 ± 6.3 66.7 ± 11.4 24.0 ± 3.9 76.6 ± 10.7
2002 (n = 359) 35.1 ± 6.9 167.0 ± 6.2 65.7 ± 10.9 23.5 ± 3.6 75.4 ± 10.1
2003 (n = 524) 35.9 ± 7.1 167.0 ± 6.4 67.3 ± 12.1 24.1 ± 4.1 77.4 ± 11.1
2004 (n = 443) 34.8 ± 6.9 167.4 ± 6.5 66.5 ± 11.7 23.7 ± 3.9 76.2 ± 10.5
2005 (n = 540) 35.9 ± 7.0 167.0 ± 6.1 65.7 ± 11.0 23.6 ± 3.8 76.7 ± 9.8
2006 (n = 606) 35.9 ± 7.1 167.0 ± 6.2 66.6 ± 11.6 23.9 ± 3.9 77.6 ± 10.2
2007 (n = 671) 35.9 ± 7.1 167.2 ± 6.4 66.1 ± 10.8 23.6 ± 3.6 77.1 ± 9.9
2008 (n = 857) 37.5 ± 7.1 167.4 ± 6.3 67.2 ± 11.2 24.0 ± 3.7 77.5 ± 9.9
38.5 ± 6.8*** 167.1 ± 6.2** 67.7 ± 11.8 24.2 ± 3.9 78.2 ± 10.1
2009 (n = 975)
Statistical significance between the years 1999 and 2009 at the significance level – *p < 0.05, **p < 0.01, ***p < 0.001.
Fig. 1 – Distribution of men in the body mass index categories.
Statistical significance between the years 1999 and 2009 at the significance level – *p < 0.05, **p < 0.01, ***p < 0.001.
Fig. 2 – Distribution of women in the body mass index categories.
The dynamics of frequencies of BMI values in men led to an increase in the number of probands with a higher BMI value. During the monitored period the proportion of overweight men gradually increased from 52% to 57.1% (p < 0.001). There was no statistically significant change in the prevalence of obesity among men (12–15.6%). The same situation was seen in women. During the monitored period the number of female sol-diers in whom the BMI values were found to be in the overweight range increased from 19.8% to 26.2% (p < 0.05). The proportion of obese women varied ranging from 5% to 14%, however there was no significant trend. Metabolic risk was determined based on values of waist circumference. The men with a waist circumference ≥ 94 cm and the women with a waist circumference ≥ 80 cm (level I risk) were at moderate risk of developing metabolic disease. The men with a waist
circum-ference ≥ 102 cm and women with a waist circumference ≥ 88 cm were at high risk (level II risk) 7, 8. In men, comparing the first and the last year of monitoring, a statistically significant decrease in individuals with higher values of waist circumferen-ce was observed (43–40%) (p < 0.001). On the contrary, in women a slight statistically insignificant increase in individuals with higher values of waist circumference was seen (32–35%). The value of BMI in men was weakly associated with total cho-lesterol (r = 0.17), LDL cholesterol (r = 0.17), triglycerides (r = 0.28) and glycaemia (r = 0.16), all with statistical significance (p < 0.001). A similar situation was in women, BMI was weakly associated with total cholesterol (r = 0.16), LDL cholesterol (r = 0.22), triglycerides (r = 0.25) and glycaemia (r = 0.27), all with statistical significance (p < 0.001). Average values of bioc-hemical parameters are shown in Tables 3 and 4.
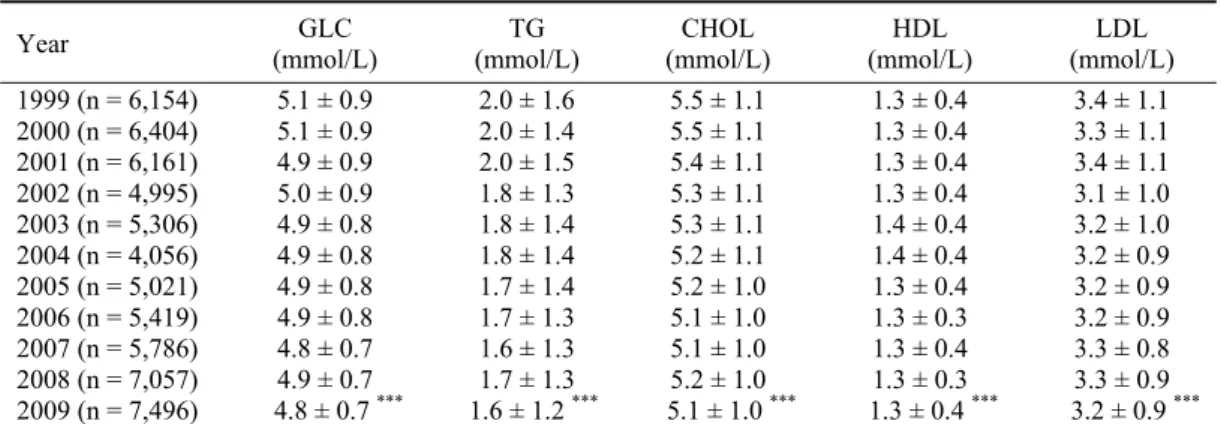
Table 3 Average values of biochemical parameters in men within 11 years
Year GLC
(mmol/L)
TG (mmol/L)
CHOL (mmol/L)
HDL (mmol/L)
LDL (mmol/L) 1999 (n = 6,154) 5.1 ± 0.9 2.0 ± 1.6 5.5 ± 1.1 1.3 ± 0.4 3.4 ± 1.1 2000 (n = 6,404) 5.1 ± 0.9 2.0 ± 1.4 5.5 ± 1.1 1.3 ± 0.4 3.3 ± 1.1 2001 (n = 6,161) 4.9 ± 0.9 2.0 ± 1.5 5.4 ± 1.1 1.3 ± 0.4 3.4 ± 1.1 2002 (n = 4,995) 5.0 ± 0.9 1.8 ± 1.3 5.3 ± 1.1 1.3 ± 0.4 3.1 ± 1.0 2003 (n = 5,306) 4.9 ± 0.8 1.8 ± 1.4 5.3 ± 1.1 1.4 ± 0.4 3.2 ± 1.0 2004 (n = 4,056) 4.9 ± 0.8 1.8 ± 1.4 5.2 ± 1.1 1.4 ± 0.4 3.2 ± 0.9 2005 (n = 5,021) 4.9 ± 0.8 1.7 ± 1.4 5.2 ± 1.0 1.3 ± 0.4 3.2 ± 0.9 2006 (n = 5,419) 4.9 ± 0.8 1.7 ± 1.3 5.1 ± 1.0 1.3 ± 0.3 3.2 ± 0.9 2007 (n = 5,786) 4.8 ± 0.7 1.6 ± 1.3 5.1 ± 1.0 1.3 ± 0.4 3.3 ± 0.8 2008 (n = 7,057) 4.9 ± 0.7 1.7 ± 1.3 5.2 ± 1.0 1.3 ± 0.3 3.3 ± 0.9 2009 (n = 7,496) 4.8 ± 0.7 *** 1.6 ± 1.2 *** 5.1 ± 1.0 *** 1.3 ± 0.4 *** 3.2 ± 0.9 *** GLC – glycaemia; TG – triglycerides; CHOL – total cholesterol; HDL – high density cholesterol; LDL – low density cholesterol; Statistical significance between the years 1999 and 2009 at the significance level – *p < 0.05, **p < 0.01, ***p < 0.001.
Fig. 3 – Distribution of men in separate risk categories according to the waist circumference.
Statistical significance between the years 1999 and 2009 at the significance level – *p < 0.05, **p < 0.01, ***p < 0.001.
Fig. 4 – Distribution of women in separate risk categories according to the waist circumference.
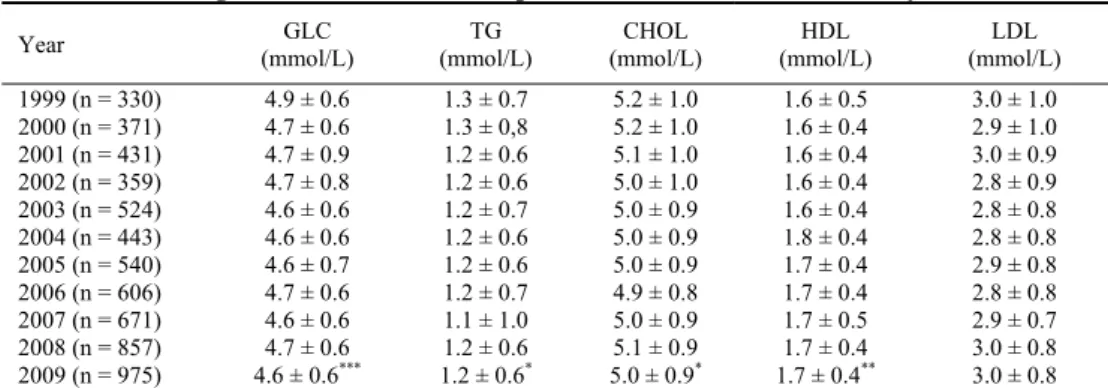
Table 4 Average values of biochemical parameters in women within 11 years
Year GLC
(mmol/L)
TG (mmol/L)
CHOL (mmol/L)
HDL (mmol/L)
LDL (mmol/L)
1999 (n = 330) 4.9 ± 0.6 1.3 ± 0.7 5.2 ± 1.0 1.6 ± 0.5 3.0 ± 1.0
2000 (n = 371) 4.7 ± 0.6 1.3 ± 0,8 5.2 ± 1.0 1.6 ± 0.4 2.9 ± 1.0
2001 (n = 431) 4.7 ± 0.9 1.2 ± 0.6 5.1 ± 1.0 1.6 ± 0.4 3.0 ± 0.9
2002 (n = 359) 4.7 ± 0.8 1.2 ± 0.6 5.0 ± 1.0 1.6 ± 0.4 2.8 ± 0.9
2003 (n = 524) 4.6 ± 0.6 1.2 ± 0.7 5.0 ± 0.9 1.6 ± 0.4 2.8 ± 0.8
2004 (n = 443) 4.6 ± 0.6 1.2 ± 0.6 5.0 ± 0.9 1.8 ± 0.4 2.8 ± 0.8
2005 (n = 540) 4.6 ± 0.7 1.2 ± 0.6 5.0 ± 0.9 1.7 ± 0.4 2.9 ± 0.8
2006 (n = 606) 4.7 ± 0.6 1.2 ± 0.7 4.9 ± 0.8 1.7 ± 0.4 2.8 ± 0.8
2007 (n = 671) 4.6 ± 0.6 1.1 ± 1.0 5.0 ± 0.9 1.7 ± 0.5 2.9 ± 0.7
2008 (n = 857) 4.7 ± 0.6 1.2 ± 0.6 5.1 ± 0.9 1.7 ± 0.4 3.0 ± 0.8
2009 (n = 975) 4.6 ± 0.6*** 1.2 ± 0.6* 5.0 ± 0.9* 1.7 ± 0.4** 3.0 ± 0.8
GLC – glycaemia; TG – triglycerides; CHOL – total cholesterol, HDL – high density cholesterol, LDL – low density cholesterol; Statistical significance between the years 1999 and 2009 at the significance level – *p < 0.05, **p < 0.01, ***p < 0.001.
Average glycaemia levels were in normal range in both men and women throughout the monitored period. However, a statistically significant decrease in these levels, from 5.1 ± 0.9 mmol/L to 4.8 ± 0.7 mmol/L (p < 0.001) in men and from 4.9 ± 0.6 mmol/L to 4.6 ± 0.6 mmol/L (p < 0.001) in women was seen. The percentage of men with the glycaemia levels in the range 5.6–6.9 mmol/L and above 7 mmol/L decreased, from 16% to 8.4% (p< 0.001) and from 2.2% to 0.5% (p < 0.001), respectively. Concerning the lipid profile in men, a significant decrease in average values of total cholesterol, triglycerides and LDL cholesterol was observed; from 5.5 ± 1.1 mmol/L to 5.1 ± 1.0 mmol/L (p < 0.001), from 2.0 ± 1.6 mmol/L to 1.6 ± 1.2 mmol/L (p < 0.001) and from 3.4 ± 1.1 mmol/L to 3.2 ± 0.9 mmol/L (p < 0.001), respectively. The percentage of men with the levels of total cholesterol above 5 mmol/L decreased very significantly, from 66–51.2% (p < 0.001). Similarly at the beginning of the monitored period there were 45.4% of men with triglyceride levels above 1.7 mmol/L. However, during the monitored period this percenta-ge decreased to 32.9% (p < 0.001). In women average levels of lipid profile also decreased, however not so significantly. On the contrary, a statistically significant decrease in the levels of total choleslerol and triglycerides was seen: from 5.2 ± 1.0 mmol/L to 5.0 ± 0.9 mmol/L (p < 0.05) and from 1.3 ± 0.7 mmol/L to 1.2 ± 0.6 mmol/L (p < 0.05), respectively.
Discussion
The work provides information about anthropometric and biochemical parameters in professional soldiers of the ACR within 11 years. It also evaluates the importance of BMI as an independent marker for the diagnosis of over-weight and obesity.
Other armies also struggle with overweight and obesity. Research performed in these armies has shown that the oc-currence of overweight and obesity corresponds with the situation in general population. The situation in the Czech Army is not different.
Considering the length of monitoring and the number of examined probands in the ACR, there are not many studies
in the prevalence of obesity in large groups in other armies. Only the work by British authors describing the prevalence of overweight and obesity in more than 50,000 British sol-diers is comparable 9. According to this work, overweight occurs in 56% of soldiers and obesity in 12% of soldiers in the monitored group. The work of American authors deals with the prevalence of obesity in American soldiers during a long period of time, within which (between the years 1988 and 2004) body weight in the monitored group significantly increased by 2.4 kg 10. Other American data present 50–54% of American soldiers in the range of overweight and obesity 11. Data about adult American population present 34% of over-weight and 34% of obesity 12. The work by Polish authors present the prevalence of overweight and obesity in the Pol-ish Armed Forces amounting to 14% 13.
The above-mentioned retrospective data analysis con-cerning the health and nutritional status of professional sol-diers shows that the average BMI values did not change sig-nificantly throughout the monitored period. In men they ranged from 26.5 kg/m2to 27 kg/m2, in women from 23.5 kg/m2 to 25 kg/m2. On the contrary, the number of over-weight soldiers gradually increased: from 52% to 57.1% (p < 0.001) in men and from 19.8% to 26.2% (p < 0.05) in women. The prevalence of obesity varied in both men and women, however without any significant trend. Obesity oc-curred in 12% to 15.6% of men and in 5% to 14% of women. One would assume that the occurrence of overweight soldi-ers would be significantly lower in the Czech Army than in the Czech population. However, even though the soldiers are a selected subpopulation, the results of research carried out among the Czech population repeatedly in the last 15 years show that this is not the case 14–16. The number of obese sol-diers is half the number of obese civilians. On the contrary, the number of overweight soldiers is twice as high as the number of overweight civilians.
sta-tistically significant decrease in with higher values of waist circumference was observed (from 43% to 40% (p < 0.001). On the contrary, in women a slight statistically insignificant increase in individuals with higher values of waist circum-ference was seen (from 32% to 35%).
However, the body weight according to BMI increased in more than 66% of men and more than 31% of women. Es-pecially in men there was a big disproportion between the calculated BMI and the measured waist circumference. The difference was observed only in individuals slightly exceed-ing the recommended values whose BMI was in the over-weight range and who were at moderate risk of developing metabolic diseases. From 52% to 57% of men were over-weight. However, a higher values of waist circumference in the range of moderate risk were observed only in 23–27% of men. When the values of BMI and waist circumference were in the range of obesity, both parameters had the same result. On the contrary, in female subpopulation with lower amount of muscular mass, both the BMI values and the values of waist circumference in percentage were the same.
The above-mentioned results confirm the assumption that also individuals with a normal amount of body fat and an in-creased muscular mass are ranged into the overweight cate-gory and in some cases into Class I obesity. A system evaluat-ing the health capability of professional soldiers to carry out their military duties has been introduced into the Czech Army. One of the evaluation criteria of this system is the soldier´s nu-tritional status assessed according to BMI values. Based on the current legislature BMI values in the range of 30–39.9 kg/m2 mean that the health capability of soldiers is ranged into a lower classification and that prevents them from carrying out certain military duties (special force units, paratrooper units, participation in military missions abroad).
Long-term assessments of health condition of military pro-fessionals have shown that the BMI criterion itself is not suffici-ent, especially for evaluating overweight. Therefore, in the fu-ture it will be necessary to include the waist circumference and total body fat in the diagnostic criteria for obesity 17–19. These two parameters can be additional parameters to BMI and can help identify individuals at risk of developing obesity and asso-ciated complications. The before-cited studies 17–19 prove on dif-ferent groups of probands that using more anthropometric meth-ods for determining total nutritional status of the organism is ad-vantageous. The work of Belgian authors compares two anthro-pometric methodologies – BMI and impedance for determining total body fat in Belgian recruits 20.
Despite seemingly high occurrence of overweight and obesity calculated using BMI, the number of individuals with increased values of biochemical parameters was significantly lower. During the monitored period there was an additional decrease in the values of the above-mentioned parameters. The most significant decrease was seen in glycaemia levels which were within normal range in both men and women. In most professional soldiers, both males and females, glycae-mia levels were within normal range. The glycaeglycae-mia levels in the range of prediabetes were observed in only 10% of monitored soldiers (fasting glyceamia above 5.6 mmol/L) 21.
A return to normal levels of total cholesterol and triglyc-erides was observed in approximately 15% of men. The number of men with cholesterol levels within normal range increased from one-third to one-half. Similar situation was seen in triglyc-erides. At the beginning of the monitored period only half of male soldiers had normal triglyceride levels. However, the num-ber gradually increased up to two-thirds which is a favorable trend, especially in prevention of cardiovascular diseases 22, 23.
Conclusion
Military professionals are a selected subpopulation repre-sented partly by young, physically fit individuals without any serious health problems. Thus, a high number of overweight and obese soldiers is very alarming. Throughout the monitored period only one third of military professionals had a normal body weight. Furthermore, the number of individuals with BMI values in the overweight range increased during this pe-riod. More favorable situation was in female professional sol-diers, two-thirds of them had normal body weight during the monitoring period. However, it is necessary to take into con-sideration the limitations of BMI as a tool for evaluating the nutritional status, especially for the overweight category. The number of overweight soldiers was overestimated as a result of inclusion of individuals with increased body weight due to well-developed musculature. Therefore, in the future it will be necessary to include the waist circumference and total body fat in the diagnostic criteria for obesity used in evaluating health capability of professional soldiers.
Within the Czech Army we now have the opportunity to influence a large population group by providing primary pre-vention of non-communicable diseases. Using the Pro-gramme of Extended Preventive Care we can detect indi-viduals at risk of developing non-communicable diseases early and begin targeted intervention.
R E F E R E N C E S
1. Ogden CL, Carroll MD, Curtin LR, McDowell MA, Tabak CJ, Flegal KM. Prevalence of Overweight and Obesity in the United States, 1999-2004. JAMA 2006; 295(13): 1549−55.
2. Yoon K, Lee J, Kim J, Cho JH, Choi Y, Ko S, et al. Epidemic obesity and type 2 diabetes in Asia. Lancet 2006; 368(9548): 1681−8. 3. Frühbeck G, Toplak H, Woodward E, Yumuk V, Maislos M, Oppert
J. Obesity: the gateway to ill health - an EASO position state-ment on a rising public health, clinical and scientific challenge in Europe. Obes Facts 2013; 6(2): 117−20.
4. James WP. The epidemiology of obesity: the size of the problem. J Intern Med 2008; 263(4): 336−52.
5. Chaloupka J, Býma S, Hlúbik P. Advanced Preventive Care Pro-gram in the Army of the Czech Republic. Voj Zdrav Listy 2000; 69(2): 57−62. (Czech)
6. Pavlík V, Fajfrová J, Husárová M, Hlúbik P. Prevention of over-weight and obesity in the Army of the Czech Republic. Hygiena 2011; 56(3): 85−7. (Czech)
8. Alberti KG, Eckel RH, Grundy SM, Zimmet PZ, Cleeman JI, Donato KA, et al. Harmonizing the metabolic syndrome: a joint interim statement of the International Diabetes Federation Task Force on Epidemiology and Prevention; National Heart, Lung, and Blood Institute. Circulation 2009; 120(16): 1640−5.
9. Sanderson PW, Clemes SA, Biddle SJ. Prevalence and socio-demographic correlates of obesity in the British Army. Ann Hum Biol 2014; 41(3): 193−200.
10. Yokota M, Bathalon GP, Berglund LG. Assessment of male an-thropometric trends and the effects on simulated heat stress re-sponses. Eur J Appl Physiol 2008; 104(2): 297−302.
11. Lindquist CH, Bray RM. Trends in Overweight and Physical Ac-tivity among U.S. Military Personnel, 1995-1998. Prev Med 2001; 32(1): 57−65.
12. Flegal KM, Carroll MD, Ogden CL, Curtin LR. Prevalence and trends in obesity among US adults, 1999-2008. JAMA 2010; 303(3): 235−41.
13. Tomczak A, Bertrandt J, Kłos A. Physical fitness and nutritional status of polish ground force unit recruits. Biol Sports 2012; 29(4): 33−6.
14. Matoulek M, Svačina Š, Lajka J. The incidence of obesity and its complications in the Czech Republic. Vnitř Lék 2010; 56(10): 1019−27. (Czech)
15. Poledne R, S̆kodová Z. Changes in nutrition, cholesterol concentra-tion, and cardiovascular disease mortality in the czech popula-tion in the past decade. Nutripopula-tion 2000; 16(9): 785−6.
16. Fried M, Hainer V, Basdevant A, Buchwald H, Deitel M, Finer N, et al. Interdisciplinary European guidelines on surgery of severe obesity. Obes Facts 2008; 1(1): 52−9.
17.Kruschitz R, Wallner-Liebmann SJ, Hamlin MJ, Moser M, Ludvik B, Schnedl WJ, et al. Detecting Body Fat–A Weighty Problem BMI versus Subcutaneous Fat Patterns in Athletes and Non-Athletes. PLoS One 2013; 8(8): e72002.
18.Flegal KM, Shepherd JA, Looker AC, Graubard BI, Borrud LG, Ogden CL, et al. Comparisons of percentage body fat, body mass index, waist circumference, and waist-stature ratio in adults. Am J Clin Nutr 2009; 89(2): 500−8.
19.Lean ME, Han TS, Morrison CE. Waist circumference as a measure for indicating need for weight management. BMJ 1995; 311(6998): 158−61.
20.Mullie P, Vansant G, Hulens M, Clarys P, Degrave E. Evaluation of body fat estimated from body mass index and impedance in Belgian male military candidates: comparing two methods for estimating body composition. Mil Med 2008; 173(3): 266−70.
21.World Health Organization. Definition, Diagnosis, and Classifi-cation of Diabetes Mellitus and Its CompliClassifi-cations: Report of a WHO Consultation. Part 1: Diagnosis and Classification of Diabetes Mellitus. Geneva: World Health Organization; 1999.
22.ESC/EAS Guidelines for the management of dyslipidemias.
Eur Heart J 2011; 32: 1769−818.
23.Heinecke J. HDL and cardiovascular-disease risk--time for a new approach. N Engl J Med 2011; 364(2): 170−1.