The role of the northward-directed (sub)surface limb of the Atlantic
Meridional Overturning Circulation during the 8.2 ka event
A. D. Tegzes1, E. Jansen2, and R. J. Telford3
1UNI Research and Bjerknes Centre for Climate Research, Allégaten 55, 5007 Bergen, Norway 2Department of Earth Science and Bjerknes Centre for Climate Research, University of Bergen, Allégaten 55, 5007 Bergen, Norway
3Department of Biology and Bjerknes Centre for Climate Research, University of Bergen, Thormøhlensgt. 53 A/B, 5006 Bergen, Norway
Correspondence to:A. D. Tegzes ([email protected])
Received: 13 January 2014 – Published in Clim. Past Discuss.: 20 February 2014
Revised: 9 September 2014 – Accepted: 14 September 2014 – Published: 24 October 2014
Abstract. The so-called “8.2 ka event” is widely regarded as a major Holocene climate perturbation. It is most read-ily identifiable in the oxygen-isotope records from Green-land ice cores as an approximately 160-year-long cold inter-val between 8250 and 8090 years BP. The prevailing view has been that the cooling over Greenland, and potentially over the northern North Atlantic at least, was triggered by the catas-trophic final drainage of the Agassiz–Ojibway proglacial lake as part of the remnant Laurentide Ice Sheet collapsed over Hudson Bay at around 8420±80 years BP. The con-sequent freshening of surface waters in the northern North Atlantic Ocean and the Nordic Seas resulted in weaker over-turning, and hence reduced northward ocean heat transport. We have reconstructed variations in the strength of the east-ern branch of the Atlantic Inflow into the Nordic Seas around the time of the lake outbursts. While the initial freshwater forcing may have been even larger than originally thought, as the lake outbursts may have been accompanied by a major iceberg discharge from Hudson Bay, our proxy records from the mid-Norwegian Margin do not evidence a uniquely large slowdown in the eastern branch of the Atlantic Inflow at the time. Therefore, its main role in the 8.2 ka event may have been the (rapid) advection of fresh and cold waters to high northern latitudes, initiating rapid sea-ice expansion and an increase in surface albedo.
1 Introduction
The so-called “8.2 ka event” is widely regarded as a major Holocene climate perturbation. It is most readily identifiable in the oxygen-isotope records (δ18OICE) from Greenland ice
cores (Fig. 1a, b) as an approximately 160-year-long cold interval, which started abruptly at approximately 8250±49 years BP and ended similarly abruptly (NGRIP1, DYE-3) or somewhat more gradually (GRIP) at around 8090±45 years BP (Rasmussen et al., 2006; Rasmussen et al., 2007; Vinther et al., 2006). The corresponding dates in the GISP2 ice core are 8296±166 years BP and 8136±163 years BP, re-spectively (Grootes and Stuiver, 1997; Grootes et al., 1993; Meese et al., 1994; Steig et al., 1994; Stuiver et al., 1995).
The prevailing view has been that the cooling over Green-land, and potentially over the northern North Atlantic at least, was triggered by the catastrophic final drainage of the Agassiz–Ojibway meltwater lake as part of the rem-nant Laurentide Ice Sheet (LIS) collapsed over Hudson Bay (8470 years BP, ±1σ error range: 8740–8160 years
BP, Barber et al., 1999; 8420 years BP, ±1σ error range:
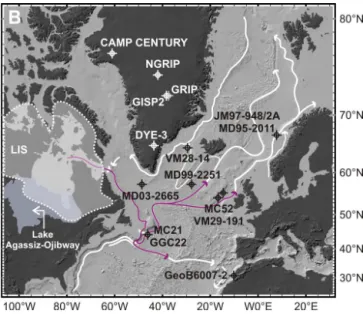
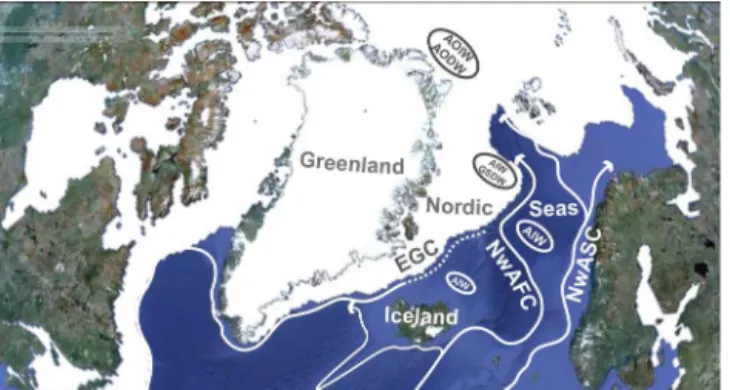
Figure 1a.The modern (sub)surface-current system in the north-ern North Atlantic Ocean and the Nordic Seas (Orvik and Niiler, 2002). CC: Canary Current. GS: Gulf Stream. NAC: North At-lantic Current (or North AtAt-lantic Drift). The two branches of the Atlantic Inflow into the Nordic Seas or the Norwegian Atlantic Cur-rent (NwAC) are the Norwegian Atlantic Slope CurCur-rent (NwASC) and the Norwegian Atlantic Front Current (NwAFC). NCC: Norwe-gian Coastal Current. EGC: East Greenland Current. LC: Labrador Current. The base map (identical in Fig. 1a–b) was generated by GeoMapApp©3.3.0 (Ryan et al., 2009).
Here we present new palaeoceanographic data which show that while the eastern branch of the Atlantic Inflow into the Nordic Seas did weaken concurrently with or immedi-ately following the collapse of the ice dam over Hudson Bay (Fig. 1a, b), its main role in the 8.2 ka event may have been the (rapid) advection of fresh and cold waters to high north-ern latitudes, initiating rapid sea-ice expansion and an in-crease in surface albedo.
Our interest in the eastern branch of the Atlantic Inflow (Fig. 1a) stems from the fact that, at least in modern times, it seems to be the main conduit for advected heat towards the Arctic (Orvik and Skagseth, 2003) and there is evidence for its existence from the beginning of the Holocene (Holtedahl, 1981; Risebrobakken et al., 2003c; Thomsen and Vorren, 1986; Vorren et al., 1984). Therefore, it must have played a key role in any AMOC-induced high-latitude climate change. Our current-strength reconstructions are based on two complementary sediment cores, IMAGES piston core MD95-2011 and box core JM97-948/2A (66◦58.19′N,
07◦38.36′E, water depth: 1048 m; Fig. 1b), which were
ex-tracted from a Holocene high-accumulation area (HA), lo-cated along the flow path of the eastern branch of the Atlantic Inflow, i.e. the Norwegian Atlantic Slope Current (NwASC, Fig. 1a), at the Vøring Plateau on the mid-Norwegian Mar-gin. Our choice of proxy is sortable silt, for the coarseness of the 10–63 µm terrigenous silt (i.e. sortable silt) fraction is
Figure 1b.Core sites mentioned in the text in relation to the modern (sub)surface-current system in the northern North Atlantic Ocean and the Nordic Seas (same as in Fig. 1a to the left) (Orvik and Niiler, 2002). The purple arrows indicate the possible trajectories of floodwaters and icebergs from Hudson Bay. LIS: Laurentide Ice Sheet (marked by the dashed white line). Lake Agassiz–Ojibway is also shown (Teller et al., 2002).
thought to vary independently of sediment supply in current-sorted and deposited muds, with coarser sediments indicat-ing relatively greater near-bottom flow speeds (McCave and Hall, 2006; McCave et al., 1995).
2 Oceanographic setting
Strong topographic control, evident both at the local and re-gional level in the Nordic Seas, indicates that flow patterns were likely very similar to the modern in the “post-deglacial” period (Blindheim, 1990; Fohrmann et al., 2001; Hass et al., 2001; Hebbeln et al., 1994; Laberg et al., 2005; Søiland et al., 2008; Voet et al., 2010).
Close to the continental slope at the mid-Norwegian Mar-gin, Atlantic waters occupy the upper 400–800 m of the water column (K. A. Mork, personal communication, 2012) over-lying Arctic Intermediate Waters and Norwegian Sea Deep Waters. Currents in these deeper water masses are guided along the western slope of the Vøring Plateau, not along the continental slope, which would affect our site (Søiland et al., 2008; Voet et al., 2010). While the Atlantic Inflow exerts a drag on the underlying water masses (Hjøllo, 1999), it seems that the HA is located at a depth and in an area where cur-rents tend to be too weak (≈0 cm.s−1)to sort the sediment (Voet et al., 2010).
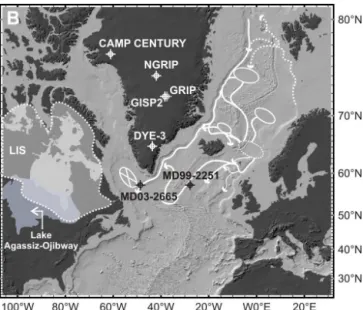
Figure 2a. Intermediate/deep-convection sites in the modern Nordic Seas are marked by ellipses. The one in dotted line is only a buffer region for ISOW (Hansen and Østerhus, 2000). GSDW: Greenland Sea Deep Water. NSDW: Norwegian Sea Deep Water. AIW: Arctic Intermediate Water. The modern deep circulation in the Nordic Seas and the northern North Atlantic is also shown (Hansen and Østerhus, 2000). DSOW: Denmark Strait Overflow Water. ISOW: Iceland–Scotland Overflow Water. NEADW: North-east Atlantic Deep Water. LNADW: Lower North Atlantic Deep Water. The white dotted arrows indicate the northernmost reaches of the NwASC (see Fig. 1a). The base map (identical in Fig. 2a–b) was generated by GeoMapApp©3.3.0 (Ryan et al., 2009).
over this gully (Søiland et al., 2008). Therefore, it likely de-posits parts of its load in the upper segment of the channel. These sediments carry the sortable-silt signal. We hypothe-sise, based on previous work by Fohrmann et al. (2001) and Rumohr et al. (2001), that these current-deposited muds are continuously being delivered down to the HA in internal-wave-generated, low-energy turbidity plumes, which are brought to an abrupt halt at our site. We think that the deliv-ery process adds only random noise to the sortable-silt signal, which averages out at the decadal to multidecadal resolution of our cores.
Therefore, although the NwASC has most probably not been in direct contact with the HA, we think that it has in-directly influenced sedimentation there and that past changes in its strength have been preserved by these deposits.
It is important to reiterate, however, that the following analysis and all our conclusions rest on the assumption that the downslope delivery and re-deposition of NwASC-sorted muds at the HA did not overprint the grain-size distributions of the primary deposits over the interval of interest (Tegzes et al., 2014a).
Figure 2b.Core sites mentioned in the text in relation to the modern convection sites in the Nordic Seas and the modern deep-current system in the northern North Atlantic Ocean and the Nordic Seas (same as in Fig. 2a to the left) (Hansen and Østerhus, 2000). As indicated, winter convection was unlikely to have occurred in the Labrador Sea before 7000 years BP (Hillaire-Marcel et al., 2007). LIS: Laurentide Ice Sheet (marked by the dotted white line). Lake Agassiz–Ojibway is also shown (Teller et al., 2002).
3 Methods
The age–depth model was constructed using mixed-effect re-gression, which relies on the midpoint estimates of the cal-ibrated ages (Heegaard et al., 2005). The two cores were treated independently. The age control for JM97-948/2A is based on nine210Pb and two accelerator mass spectrometry (AMS)14C dates (Andersson et al., 2003), and it represents the last 582 years. The age model for MD95-2011 rests on 29 AMS14C dates and the presence of the Vedde ash layer (Berner et al., 2011; Dreger, 1999; Grönvold et al., 1995; Risebrobakken et al., 2011; Risebrobakken et al., 2003c) and covers the rest of the Holocene.
The split cores were sampled at 1 cm intervals. Bulk sam-ples were wet-sieved to separate the fine (d <63 µm) from
the coarse fraction (d >63 µm). The dried and
excluding the fine-silt and clay component (McCave and Hall, 2006; McCave et al., 1995).
The pulse data (i.e. the raw Coulter counter output) were saved following each run, and were later converted into a dif-ferential volumeand adifferential numberdistribution, using 256 equal size bins. The size bins were defined in grain di-ameters (d)in micrometres.
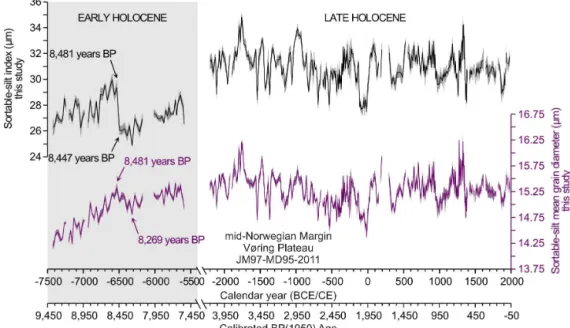
We present two alternative time series based on exactly the same set of measurements (Fig. 3). The two records are alternative representations of changes in the coarseness of the 10–63 µm terrigenous silt fraction of the sediments at our site through time.
Although the focus of the present study is the 8.2 ka event, in order to put the magnitude of coeval current-strength changes into a context, we have also included the late Holocene sections of these time series for reference (Tegzes et al., 2014a).
The traditionally used sortable-silt mean size (SS) is an
arithmetic average computed from the differential volume distribution of grains within a sample:
SS= 1 V
256 X
i=1
(Vi·di) , (1)
where di is the midpoint value of the ith size bin (i= 1,2,3, . . . ,256): 10µm <di< 63µm; Vi is the total
vol-ume of all the grains that fall into the ith size bin (i=
1,2,3, . . . ,256); and V is the total volume of all (i.e.
ap-prox. 70 000) grains measured per sample:
V =
256 X
i=1
Vi. (2)
In Eq. (1) the weights Vi V
of the individual size bins be-come increasingly disproportionate, with respect to the ac-tual number of grains within those size bins, towards the coarse end of the grain-size distribution. This does not only increase the absolute value of the apparent “mean size” within the 10–63 µm terrigenous silt fraction, but it may also affect the apparent pattern of relative changes in the coarseness of the sortable-silt fraction along the core (Fig. 3) (Tegzes et al., 2014b).
In order to avoid misleading or confusing terminology, and to emphasise thatSSdoes not reflect the actual physical size
of the average grain in the 10–63 µm terrigenous silt frac-tion, we will refer to this number as the sortable-silt index throughout the paper.
As shown in Fig. 3 we have also calculated “sortable-silt mean grain diameter” (dSS)for every sample, using exactly
the same pulse data as for computing the sortable-silt index. This is also an arithmetic average, but it is based on the dif-ferential numberdistribution of grains within a sample:
dSS=
1
N
256 X
i=1
(Ni·di) , (3)
where di is the midpoint value of the ith size bin (i=
1,2,3, . . . ,256): 10 µm <di< 63 µm; Ni is the number of
grains that fall into theith size bin (i=1,2,3, . . . ,256); and Nis the total number of grains measured per sample (i.e.
ap-prox. 70 000):
N=
256 X
i=1
Ni. (4)
Sortable-silt mean grain diameter better approximates the ac-tual physical size of the average grain in the 10–63 µm ter-rigenous silt fraction than the sortable-silt index. Hence,dSS
may be more closely related to the physical processes that produced the grain-size distribution of the sampled sediment horizon thanSS(Tegzes et al., 2014b).
Moreover, changes in dSS may better approximate
changes in the actual coarseness of the sortable-silt fraction than changes in SS. For example, considering the 9500–
7500 years BP interval, while SS most strongly correlates
with the number-percent-based enrichment of grains > 40– 45 µm (representing < 1.5 % of the sortable-silt fraction, i.e. a couple of hundred grains out of the more than 70 000 mea-sured per sample), dSS most strongly correlates with the
number-percent-based enrichment of grains >20 µm (repre-senting 10–16% of the 10–63 µm terrigenous silt fraction) (Tegzes et al., 2014b).
In general, the finer the sortable-silt fraction, the larger the impact of small changes in the relative number of the largest grains within that size fraction onSS. Therefore, while the
discrepancy is more subtle between thedSS andSSrecords
over the late Holocene, the difference between the two time series is more pronounced over the early Holocene (Tegzes et al., 2014b).
We includedSSinto our study in order to
– present our findings in a balanced and objective way, as the comparison of the two sortable-silt proxies (dSS
andSS)is based on samples from our site only, not an
extensive survey of sediment cores from different geo-graphical settings and time intervals;
– show how an alternative mathematical–statistical de-scription of the coarseness of the sediment can influence the outcome of a study;
– ensure that our results remain comparable with other (published) data sets that are based on the traditional
SSapproach.
4 The weakening of the NwASC concomitant with the lake outbursts
Figure 3.The two alternative sortable-silt time series from JM97-MD95-2011 (Vøring Plateau, mid-Norwegian Margin). Note the 4-fold
difference in scale between the records. The shaded envelopes indicate the spread of values resulting from repeated measurements. The mean ±1σerror in the age model is±128 years over the late Holocene and±201 years over the early Holocene.
8447 years BP (±1σ error range: 8725–8204 years BP,
Fig. 3), sortable-silt mean grain diameters exhibit a more gradual decline, reaching a minimum at 8269 years BP (±1σ error range: 8445–8093 years BP; Fig. 3). Not only
is the pattern of change different but also its relative am-plitude. Furthermore, the late Holocene segments of the re-spective records indicate comparable (sortable-silt index) or much larger (sortable-silt mean grain diameter) fluctuations in current strength than in the second half of the ninth mil-lennium BP (Fig. 3). Considering the above, there exists the possibility that the change in ocean circulation preceding the 8.2 ka event might not have been uniquely dramatic in the context of post-deglacial conditions.
Nonetheless, both time series suggest that the NwASC was overall weaker in the early Holocene than the late Holocene and that it recovered much more slowly following the col-lapse of the ice dam over Hudson Bay than after compara-ble (sortacompara-ble-silt index) or much larger (sortacompara-ble-silt mean grain diameter) slowdowns over the past 4200 years (Fig. 3). Whether this was due to the initial instability of the current in the early Holocene or the nature of the forcing is difficult to tell.
5 The relative timing of events at the Vøring Plateau Of the planktonic foraminiferan species Neogloboquadrina pachyderma (NP) and Neogloboquadrina incompta (NI) have already been analysed for oxygen isotopes from our cores (Risebrobakken et al., 2011; Risebrobakken et al., 2003c). All of the previous publications which we are going
to cite in the following discussion use the old classification of the above taxa. These authors refer to the dominantly left-coiling Neogloboquadrina pachyderma as Neogloboquad-rina pachydermasinistral, while the dominantly right-coiling Neogloboquadrina incompta as Neogloboquadrina pachy-dermadextral. We will adopt the new names, acknowledging the revised taxonomy of these morphospecies (Darling et al., 2006).
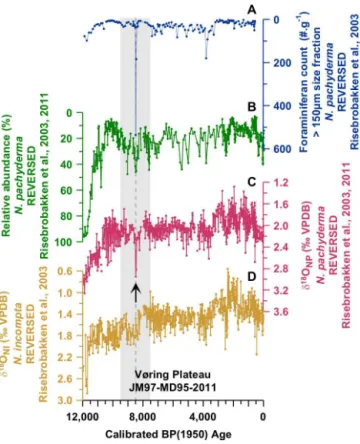
Of the two oxygen-isotope records, only the one based on N. pachyderma(δ18ONP)shows a uniquely large abrupt
pos-itive excursion with respect to the entire Holocene within the interval of interest (Fig. 4c, d). This morphospecies calcifies at greater depth and/or earlier in the season thanN. incompta (Andersson et al., 2010). Therefore, it is probably more sen-sitive to changes in the core temperatures of the NwASC.
JM97-MD95-2011 (Vøring Plateau, mid-Norwegian Mar-gin, Fig. 1b) has been referenced in several papers (e.g. LeGrande and Schmidt, 2008; LeGrande et al., 2006; Rohling and Pälike, 2005) as one of the few “North At-lantic”marinecores that actually recorded the 8.2 ka event. However, it is important to note the timing of this sharp and short-lived positive excursion inδ18ONP(between 8516
and 8412 years BP,±1σ error range: 8760–8182 years BP;
Fig. 5c). Firstly, it better corresponds to the best estimates for the timing of the final drainage of Lake Agassiz–Ojibway (8470 years BP,±1σ error range: 8740–8160 years BP,
Bar-ber et al., 1999; and 8420 years BP,±1σ error range: 8500–
Figure 4. The unique (sub)surface-ocean cold event at the
mid-Norwegian Margin.(a)N. pachydermacount in the >150 µm size fraction (Risebrobakken et al., 2003a, b).(b)Relative abundance of
N. pachydermain the >150 µm size fraction (Risebrobakken et al.,
2003a, b). Oxygen-isotope ratios from (c)N. pachyderma
(Rise-brobakken et al., 2003d, e) and (d) N. incompta(Risebrobakken
et al., 2003d, e). The arrow and the dashed vertical line highlight the prominent maximum in theδ18ONPrecord, while the light-grey shading indicates the interval which is the focus of the paper.
More importantly, the sortable-silt time series from the same core indicate either an abrupt drop (SS; Fig. 5b) or a
more gradual decline (dSS; Fig. 5a) in the coarseness of the
10–63 µm terrigenous silt fractionsucceeding the sharp in-crease inδ18ONP. Therefore, at least initially, the latter
can-not indicate surface cooling triggered by the slowing-down of the current.
In addition, the temporal evolution of (sub)surface-ocean cooling and the strength of the NwASC (irrespective of our choice of proxy) seem to have been very different. These records suggest that (sub)surface-ocean temperatures recov-ered either “shortly” after the prominent drop in current strength and a millennium before the NwASC recovered to its previous state (SS; Fig. 5b, c) or even before current
strength reached a minimum (dSS; Fig. 5a, c).
The oxygen-isotope record (δ18ONP)does show a second
positive excursion (8269–8198 years BP; ±1σ error range:
8445–8029 years BP) immediately following the minimum indSS (Fig. 5a, c) which better corresponds to the cooling
over Greenland (between 8250±49 and 8090±45 years BP;
Figure 5.The possible sequence of events following the collapse
of the ice dam over Hudson Bay. The slowing-down of the NwASC as suggested(a)by variations in sortable-silt mean grain diameters
and(b)by changes in the sortable-silt index.(c)The unique, abrupt
(sub)surface-ocean cooling event at 8481±201 years BP and the less significant second event at 8233±201 years BP at the mid-Norwegian Margin (Risebrobakken et al., 2003e).(d) Ice rafting off Newfoundland (Bond et al., 2008). (e) Cooling over Greenland
(Rasmussen et al., 2006; Rasmussen et al., 2007; Vinther et al., 2006).(f)Lake outbursts (Barber et al., 1999; Hillaire-Marcel et al.,
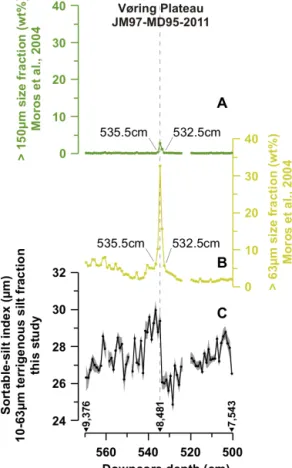
Figure 6. Changes in the coarseness of the sediments along the core as described by statistics based on the differential volume or weight distribution of grains within the samples. Variations in the dry-weight percent of (a)the > 150 µm size fraction and (b)the
> 63 µm size fraction (M. Moros, personal communication, 2012).
(c)Changes in the coarseness of the 10–63 µm terrigenous silt
frac-tion as suggested by the sortable-silt index.
Rasmussen et al., 2006; Rasmussen et al., 2007; Vinther et al., 2006; Fig. 5e). However, since this secondδ18ONPspike
does not exceed noise level in the oxygen-isotope record and is defined by only a single data point, we cannot draw far-reaching conclusions based on this segment of the time se-ries.
The first, prominentδ18ONPspike coincides with a broader
maximum in the record of the relative abundance of N. pachyderma in our cores (Fig. 4b, c) (Risebrobakken et al., 2011; Risebrobakken et al., 2003c). However, the latter seems to be part of a “repetitive” pattern and is not uniquely large in comparison to background “post-deglacial” vari-ability in that time series (Fig. 4b). In other words, the rel-ative abundance ofN. pachydermadoes not support the idea that a uniquely severe cold event affected the (sub)surface ocean at the mid-Norwegian Margin concurrently with the collapse of the ice dam over Hudson Bay.
However, the relative abundance ofN. pachyderma, as the name of this proxy suggests, is modulated by changes in
Figure 7.Changes in the coarseness of the sediments along the core
as described by statistics based on the differential number distri-bution of grains within the samples.(a)The prominent maximum
in theδ18ONPrecord (Risebrobakken et al., 2003e). Foraminiferan counts in the >150 µm size fraction (Risebrobakken et al., 2003b):
(b) N. incompta and (c) N. pachyderma. (d) Ice-rafted detritus
(IRD) counts in samples bracketing the spike in the >150 µm size fraction (B. Risebrobakken, personal communication, 2012). (e)
Variations in the dry-weight percent of the >150 µm size fraction (M. Moros, personal communication, 2012). (f) Changes in the
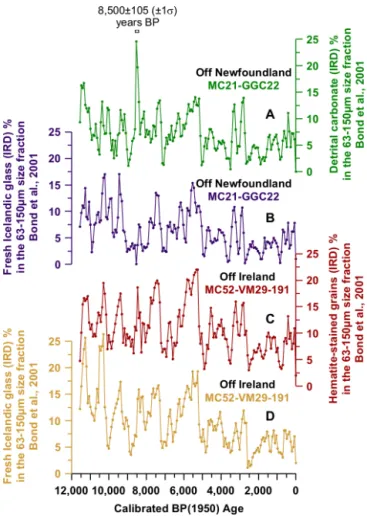
Figure 8. The unique maximum in drift ice off Newfoundland
around 8500±105 years BP. Percentages of(a)detrital carbonate
and(b)fresh Icelandic volcanic glass in the 63–150 µm size
frac-tion of sediment cores MC21-GGC22 (off Newfoundland). Note the prominent maximum in the detrital carbonate record, while the percentages of fresh Icelandic volcanic glass drop to zero around 8500±105 years BP. Percentages of(c)hematite-stained grains and (d) fresh Icelandic volcanic glass in the 63–150 µm size fraction
of sediment cores MC52-VM29-191 (Rockall Trough, off Ireland) (Bond et al., 2008).
the productivity of other species present in the planktonic foraminiferal assemblage. When we estimate the absolute concentrations of the polar N. pachydermain the >150 µm fraction of the sediments from our site (Risebrobakken et al., 2003c), these values do show a uniquely large maximum in perfect synchroneity with the first δ18ONP spike in
JM97-MD95-2011 (Fig. 4a, c). The 8516–8412 years BP maxi-mum in theabsoluteabundance ofN. pachydermabecomes somewhat muted when we take reconstructed sedimentation rates at our site into consideration, nevertheless, it remains a prominent feature of that signal.
We cannot confirm or refute the significance of the second
δ18ONP spike (8269–8198 years BP) in JM97-MD95-2011
using the absolute abundance of N. pachyderma from our cores, because it has lower resolution over that interval.
6 Post-depositional processes 6.1 Bioturbation
There is a clear difference between the pattern of change in
SS, representing the coarseness of the 10–63 µm terrigen-oussilt fraction, and variations in the overall coarseness of bulk samples as described by the weight percent (wt %) of the > 63 µm size fraction (Fig. 6b, c) (Moros et al., 2004). The weight percent of the > 150 µm size fraction mimics the change in the weight percent of the > 63 µm size fraction; only the maximum between 536.5 cm and 532.5 cm is more muted (Fig. 6b) (Moros et al., 2004).
Since the 10–63 µm terrigenous silt fraction carries the current-strength signal, while the > 150 µm size fraction car-ries the temperature signal, it is important to investigate whether their apparent amplitude and wavelength could have been affected by bioturbation.
The number count of grains within the >150 µm size frac-tion suggests that the sharp maximum in the weight percent of these grains is primarily due to a significant increase in the ice-rafted detritus (IRD) content (in #.g−1)of the sediment
and to a lesser extent due to an increase in the number of foraminiferal shells (bothN. pachydermaandN. incompta) per gramme of sediment (Fig. 7b, c, d, e).
The maxima in the IRD and foraminiferal counts are sharp and are perfectly aligned both with one another and with the peak in the weight percent of the > 150 µm size fraction.
1. Since bioturbation likely increases the wavelength and decreases the amplitude of a signal, i.e. it “smears” it out, we consider it unlikely that these sharp maxima are artificially generated.
2. Since the lighter, more spherical foraminiferal shells have very different physical properties from IRD frag-ments, we think that bioturbation would have affected them differently and the respective maxima would not be perfectly aligned.
3. We also consider it unlikely that bioturbation affected only the 10–63 µm terrigenous silt fraction as repre-sented bydSS (since this is also based on the number
count of grains, we use this parameter in this context), while leaving the > 150 µm size fraction undisturbed (Fig. 7f).
The traditionally used volume/weight-percent distributions suggest that the abrupt cooling signal (including the first, prominentδ18ONPpeak), carried by the > 150 µm size
frac-tion, appears only 1 cm down the core relative to the sharp drop in the coarseness of the 10–63 µmterrigenoussilt frac-tion, i.e.SS(Figs. 5b, c and 6a, c).
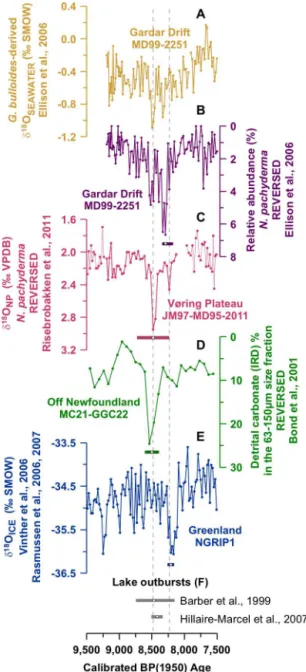
Figure 9.The double-pulse nature of (sub)surface-ocean cooling. (a)The twin surface-ocean freshening events and (b) the unique twin (sub)surface-ocean cooling events at Gardar Drift in the sub-polar North Atlantic (Ellison et al., 2006a).(c)The unique, abrupt
(sub)surface-ocean cooling event at 8481±201 years BP and the less significant second event at 8233±201 years BP at the mid-Norwegian Margin (Risebrobakken et al., 2003e). (d)Ice rafting
off Newfoundland (Bond et al., 2008).(e)Cooling over Greenland
(Rasmussen et al., 2006; Rasmussen et al., 2007; Vinther et al., 2006).(f)Lake outbursts (Barber et al., 1999; Hillaire-Marcel et al.,
2007). The horizontal bars below the records denote the±1σerrors in the respective age models. The dashed vertical lines highlight the two (sub)surface-ocean cold events at the Vøring Plateau.
relationship between the >150 µm size fraction and the 10– 63 µm terrigenous silt fraction probably does not depend on a single sampling interval (Fig. 7). The pattern of change is completely different in the two size fractions. There is no abrupt drop in Fig. 7f, only a gradual decline across six sampling intervals, wheredSS reaches a minimum. Hence,
the number-count-based distributions suggest that reversing the causality of (sub)surface-ocean cooling and the slowing-down of the current would require at least a 6 cm mixing depth. Under these circumstances (i.e. significant bioturba-tion) it would appear even more unlikely that the sharp max-ima in IRD and foraminiferan counts would have remained perfectly aligned.
6.2 Allochthonous glacial sediments
Rumohr et al. (2001) found evidence for older, allochthonous specimens ofN. pachydermaindeglacialdeposits at the per-ipheral parts of the HA. They were not able to correlate short-term oxygen-isotope signatures in adjacent cores tens of kilometres apart and what they considered anomalous val-ues closely related to increased sand content.
The first, prominentδ18ONP spike in JM97-MD95-2011
(Fig. 7a) (Risebrobakken et al., 2011, 2003c), as we have shown earlier, does coincide with a uniquely large positive excursion in the weight percent of the coarse fraction, irre-spective of whether we take grains withd >63 µm or with d >150 µm (Figs. 6, 7) (Moros et al., 2004). The maximum
in the weight percent of grains larger than 150 µm (Fig. 7e) is primarily due to a significant increase in the IRD content of these deposits (Fig. 7d) and to a lesser extent due to an in-crease in the number of foraminiferal shells (bothN. pachy-dermaandN. incompta) per gramme of sediment (Fig. 7b, c) (B. Risebrobakken, personal communication, 2012; brobakken et al., 2003c). Peak values in IRD count (B. Rise-brobakken, personal communication, 2012) are comparable to those in deposits of Last Glacial Maximum (LGM) age at a nearby site (MD95-2010, Vøring Plateau, mid-Norwegian Margin) (Dokken and Jansen, 1999), while the increase in the concentration of polarN. pachydermashells is much more pronounced than the increase in the number ofN. incompta shells per gramme of sediment (Fig. 7b, c). Based on the composition of the > 150 µm size fraction only, these deposits could be allochthonous glacial sediments.
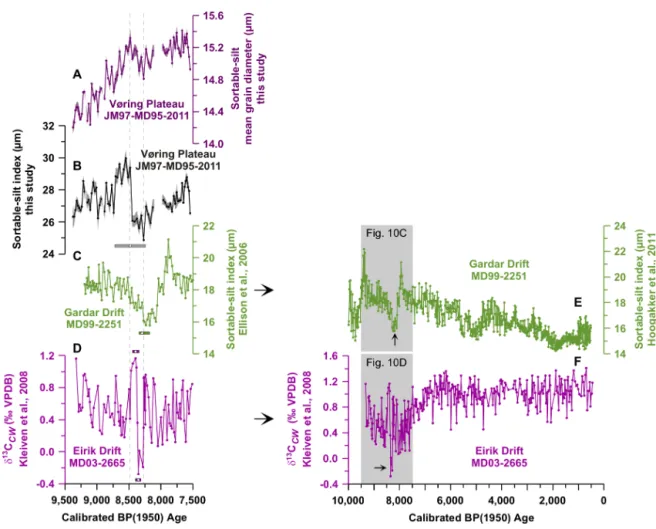
Figure 10. The temporal evolution and magnitude of the response of ocean circulation. The slowing-down of the NwASC as suggested (a)by variations in sortable-silt mean grain diameters and (b)by changes in the sortable-silt index from sediment cores JM97-MD95-2011.(c)The sortable-silt index record from MD99-2251 representing variations in the strength of the NEADW (Ellison et al., 2006a).(d)
The benthic carbon-isotope record from MD03-2665 potentially indicating the sourcing and age of bottom waters at the site (H. F. Kleiven, personal communication, 2012). The horizontal bars below the records denote the±1σerrors in the respective age models.(e)The complete
sortable-silt index record from MD99-2251 (Hoogakker et al., 2011b). The segment shown in Fig. 10c is highlighted in grey shading.(f)The
complete benthic carbon-isotope record from MD03-2665 (H. F. Kleiven, personal communication, 2012). The segment shown in Fig. 10d is highlighted in grey shading.
and the 10–63 µm terrigenous silt fraction) do not exhibit the same trend, they have likely been influenced by independent processes such as changes in the strength of the NwASC (Fig. 1a) and ice rafting, as originally proposed by Moros et al. (2004), and the first, prominentδ18ONPspike (Fig. 7a)
should therefore also represent a climate signal.
7 The magnitude and nature of the initial forcing Model simulations can systematically reproduce a major re-duction in the AMOC by injecting freshwater either into Hudson Bay or the Labrador Sea (Fig. 1a) (e.g. LeGrande et al., 2006; Renssen et al., 2001). However, most experiments are initialised from a state where, similar to the present, there is intermediate water formation in the Labrador Sea (for an exception see LeGrande and Schmidt, 2008). Yet
winter convection was unlikely to have occurred there be-fore 7000 years BP (Hillaire-Marcel et al., 2007). This means that, if the final drainage of the proglacial lake did cause the AMOC to slow down, the floodwater pool had to survive the journey in the northern Gulf Stream–North Atlantic Drift– Norwegian Atlantic Current system to the high-latitude deep-convection sites in the Nordic Seas (Fig. 1a) without being “diluted”, by mixing with ambient waters, to the extent that it could no longer affect the overturning circulation.
Figure 11. Maximum sea-ice extent in March 1980 (Fetterer et
al., 2002, updated 2009; Google Earth). The approximate location of the modern convection sites in the Nordic Seas and the Arctic Ocean are marked by ellipses (Hansen and Østerhus, 2000). The modern (sub)surface-current system in the northern North Atlantic Ocean and the Nordic Seas is also shown (Orvik and Niiler, 2002). The two branches of the Atlantic Inflow into the Nordic Seas (or the Norwegian Atlantic Current) are the NwASC (Norwegian At-lantic Slope Current) and the NwAFC (Norwegian AtAt-lantic Front Current). EGC: East Greenland Current. Note the pattern of sea-ice growth. While this is a modern-day scenario, since sea-surface tem-peratures are to a large extent controlled by ocean currents, this may have relevance to the past.
possibility that the ice dam did not simply melt away but in-stead physically disintegrated concomitant with the lake out-bursts and potentially large amounts of ice were exported via Hudson Strait and transported in the Labrador Current into the northern North Atlantic Ocean (Fig. 1a, b). This may have relevance not only to the nature (icebergs versus flood-waters) and magnitude but also to the temporal evolution of the freshwater forcing as the ice could not have left Hudson Strait as rapidly as the meltwater from the lake (Fig. 1a, b) (Barber et al., 1999). In addition, if routed into the northern Gulf Stream–North Atlantic Drift system (Fig. 1a), icebergs could ensure that the freshwater discharge survived further north as a concentrated pool, making it more likely that it could affect the high-latitude deep-convection sites.
8 Evidence for increased ice rafting off Newfoundland around 8500 years BP
According to Bond et al. (2001), the percentages of cer-tain lithic grain species – namely of hematite-scer-tained grains (HGS), fresh Icelandic volcanic glass (IG) and detrital car-bonate (DC) – in the 63–150 µm size fraction of marine sed-iments in the northern North Atlantic are particularly sen-sitive indicators of the amounts and trajectories of glacial ice and/or sea ice circulating in surface waters. Such records from sediment cores VM28-14 (Denmark Strait, Fig. 1b), MC52-VM29-191 (Rockall Trough, off Ireland; Figs. 1b, 8), and MC21-GGC22 (off Newfoundland, Figs. 1b, 8) evidence
(44 18 N, 46 16 W; water depth: 3958 m; Figs. 1b, 8a) at around 8500±105 (±1σ )years BP (the closest dated
hori-zon in the core), however, breaks this pattern. We propose that it represents an interval of increased ice rafting from Hudson Bay (Fig. 1a, b). The question is, could these ice-bergs drift towards the Nordic Seas and affect the deep-convection sites there (Fig. 2a)?
In a modern-day context, site MC21-GGC22 is located east of the Newfoundland Shelf in the deep ocean right below the flow path of the northern Gulf Stream (Fig. 1a, b). In addi-tion, the prominent peak in the detrital-carbonate record from this location falls within dating uncertainties of theδ18ONP spike in JM97-MD95-2011 (Vøring Plateau, mid-Norwegian Margin, Fig. 1b, c, d), which suggests an abrupt cooling of the (sub)surface ocean at our site, preceding the slowing-down of the NwASC. This could potentially indicate that, as the ice dam over Hudson Bay was disintegrating, the ice-bergs discharged were at least partly routed into the north-ern Gulf Stream–North Atlantic Current–Norwegian Atlantic Current system (Fig. 1a, b). As they drifted north they not only freshened but also significantly cooled (sub)surface wa-ters (Wiersma and Jongma, 2010).
We have noted earlier that the dry-weight percent of the coarse fraction in JM97-MD95-2011 (Fig. 1b) (Moros et al., 2004; M. Moros, personal communication, 2012) shows a unique, strikingly large maximum in perfect synchroneity withδ18ONPvalues (Figs. 6, 7). We have indicated that this is partly due to the increased IRD content of the sediment (B. Risebrobakken, personal communication, 2012), which is confirmed by X-ray diffractometry-based estimates of bulk quartz/plagioclase ratios (Moros et al., 2004).
As yet, no provenance studies are available for JM97-MD95-2011, thus we cannot establish the possible source of the related ice-rafting event. However, it is unlikely that the icebergs originating from Hudson Bay (Fig. 1a, b) could have survived that far north. The ice-rafting event that did leave a trace in sediments on the mid-Norwegian Margin must have had a more local source. The Scandinavian Ice Sheet had completely melted away by the mid-ninth millen-nium BP (A. Nesje, personal communication, 2012), which leaves the Arctic Ocean and the western Nordic Seas as the likely source of the icebergs/drift ice.
Based on high-resolution radar satellite data from 2004 to 2010, Smedsrud et al. (2011) show that drift-ice export from the Arctic Ocean across 79◦N corresponds well with
variability in the local geostrophic wind. The East Greenland Current (EGC, Fig. 1a) contributes with a constant southward speed close to 5 cm.s−1and drives around a third of the ice export.
temperature gradients in the atmospheric boundary layer (ABL), set up between the cold ABL air over the sea-ice-covered western Greenland Sea and the relatively warmer ABL over the ice-free eastern Greenland Sea.
By temporarily significantly cooling the Atlantic Inflow, thus changing the east–west temperature gradients across the Nordic Seas, a major iceberg (and floodwater) discharge from Hudson Bay may have interfered with atmospheric cir-culation patterns and ocean currents in the Arctic and could have potentially repeatedly changed the southward pathways of icebergs/drift ice in the Nordic Seas in the second half of the ninth millennium BP.
The ice-rafting event at the Vøring Plateau may have been the consequence of a colder Atlantic Inflow (its western branch, the NwAFC, feeds the interior of the Nordic Seas, at least in the modern ocean; Fig. 1a), which reduced east– west atmospheric temperature and pressure gradients over the Greenland Sea, thus weakening the Greenland Sea Jet and the EGC. Under these circumstances the icebergs and fragments of sea ice originating from the Arctic Ocean and the western Nordic Seas could more easily drift towards the mid-Norwegian Margin (Fig. 1a).
The thickening and expansion of sea ice in the western Nordic Seas and the cessation of iceberg discharge from Hudson Bay could reverse the trend in east–west atmospheric temperature and pressure gradients over the Greenland Sea, strengthening the Greenland Sea Jet and the EGC. This could bring the ice-rafting event at the mid-Norwegian Margin to a relatively abrupt end and could also explain the coincidence of the first, prominent δ18ONP spike with the maximum in the coarse fraction of the sediment in JM97-MD95-2011 (Figs. 6, 7).
9 The double-pulse nature of (sub)surface-ocean cooling
We have argued, based on existing chronology, that the prominent spike (between 8516 and 8412 years BP;±1σ
er-ror range: 8760–8182 years BP) in the foraminiferal oxygen-isotope time series from our site is likely not the same cold event as the one recorded in Greenland ice (Fig. 5c, e), al-though we cannot completely eliminate that possibility. We have also pointed out thatδ18ONPvalues from JM97-MD95-2011 do show a second positive excursion (8269–8198 years BP, ±1σerror range: 8445–8029 years BP) immediately
up-core of the minimum in the coarseness of the sortable-silt fraction (more evident when compared with thedSStime
se-ries; Fig. 5a, b, c). However, this second spike does not ex-ceed noise level in the oxygen-isotope record, and is defined by only a single data point. Nor can we constrain its signif-icance using theN. pachydermaabundance record from our cores, as it has lower resolution over that interval (Fig. 4b, c). Nevertheless, Ellison et al. (2006b) identified two uniquely large, closely paced (sub)surface-ocean cooling events in the
early Holocene part of their foraminiferan abundance record (Fig. 9b) from site MD99-2251 (Gardar Drift, Fig. 1b) in the subpolar North Atlantic. The first of these coincides within dating uncertainties with the lake outbursts (Fig. 9f) and peak iceberg discharge (Fig. 9d) accompanying the collapse of the ice dam over Hudson Bay, similarly to the cooling recorded in the oxygen-isotope composition of N. pachyderma in JM97-MD95-2011 (Vøring Plateau, mid-Norwegian Margin, Fig. 9c). The second (sub)surface-ocean cooling event at site MD99-2251 (Gardar Drift, Fig. 9b) appears to be signifi-cantly younger (Hillaire-Marcel et al., 2007), and better cor-responds with the cooling over Greenland (Fig. 9e). There-fore, we propose that the first positive excursion in the rel-ative abundance of N. pachyderma in MD99-2251 reflects only the initial change in upper-ocean conditions, which led to or at least played a role in the subsequent climate pertur-bation, while the second maximum reflects the climate per-turbation itself.
Estimates of coeval seawater oxygen-isotope composi-tions (δ18OSEAWATER, Fig. 9a) (Ellison et al., 2006b) suggest
that, in both cases, upper-ocean cooling was accompanied by surface-water freshening at site MD99-2251 (Fig. 1b). The combined impact of floodwaters and melting icebergs origin-ating from Hudson Bay (Fig. 1a, b) could easily explain the first minimum inδ18OSEAWATER.
The freshening of waters in the subpolar North Atlantic coincident with the cooling over Greenland could be a con-sequence of increased iceberg/drift-ice export from the Arc-tic Ocean and the Nordic Seas due to a stronger Greenland Sea Jet and a more vigorous EGC, resulting from an increase in the east–west atmospheric temperature and pressure gra-dients over the Greenland Sea, concomitant with a general decrease in surface temperatures and the thickening and ex-pansion of sea ice in the western Nordic Seas (Bond et al., 2001; Smedsrud et al., 2011; van Angelen et al., 2011).
Kleiven et al. (2008) found that applying a marine reser-voir age correction of zero (1R=0) throughout the in-terval of interest, when calibrating radiocarbon dates from sediment core MD03-2665 (Eirik Drift, Fig. 1b) from the Labrador Sea south of the tip of Greenland, led to reversals in their age model coincident with pronounced maxima in planktonicδ18ONPvalues (not shown). They attributed this
The overturning loop of the AMOC has two main deep limbs originating in the Nordic Seas: the Iceland–Scotland Over-flow and the Denmark Strait OverOver-flow (Fig. 2a) (Hansen and Østerhus, 2000; Olsen et al., 2008).
The sortable-silt index time series from sediment core MD99-2251 (water depth: 2620 m, Gardar Drift, subpolar North Atlantic; Figs. 2b, 10c) is thought to reflect past variability in the strength of the southward-directed North-east Atlantic Deep Water (NEADW, Fig. 2a) (Ellison et al., 2006b), which is dominated by Iceland–Scotland Over-flow Water (ISOW) in the modern ocean (Fig. 2a). When compared with ourSS time series from JM97-MD95-2011
(Vøring Plateau, mid-Norwegian Margin; Figs. 1b, 10b) this data set suggests a very different pattern of change in the NEADW (ISOW) from the NwASC following the collapse of the ice dam over Hudson Bay. The sortable-silt record from MD99-2251 indicates a more gradual decline in current strength, reaching a minimum coincident with the cooling over Greenland, and a rapid recovery and overshoot there-after. It would be interesting to see whether sortable-silt mean grain diameters (dSS)from both cores would reflect a more
consistent pattern of change in the (sub)surface and deep limb of the AMOC or the response in ocean circulation was truly heterogeneous.
Changes in the relative position (depth) of the core of the NEADW with respect to site MD99-2251 may also have contributed towards apparent fluctuations in current vigour as suggested by the sortable-silt index time series from this location. However, there exist no complementary proxy records (e.g. benthic foraminiferal carbon-isotope data) from MD99-2251, which may allow for a more detailed analysis of the past behaviour of the NEADW (ISOW).
When putting the “8.2 ka segment” of theSS time series
from MD99-2251 into a broader context it appears to be a potentially repeating early Holocene pattern at the site (Fig. 10c, e) (Hoogakker et al., 2011a). Furthermore, the NEADW seems to have been in general decline (and/or shoaling) over the middle to late Holocene, being weaker (and/or shallower) over the past few thousand years than at its “8.2 ka” minimum (Fig. 10 e). Therefore, similarly to our time series from the mid-Norwegian Margin, it raises ques-tions about the exclusive role of a reduced overturning cir-culation in triggering a uniquely large climate perturbation around 8200 years BP.
In the modern ocean, site MD03-2665 (water depth: 3440 m; Eirik Drift, Labrador Sea; Fig. 2b) is bathed by Lower North Atlantic Deep Water (LNADW, Fig. 2a), which is dominated by Denmark Strait Overflow Water (DSOW, Fig. 2a). The sortable-silt index record of Kissel et al. (2013) from this location also shows a minimum in the coarseness of the sortable-silt fraction between approximately 8380 and 8240 years BP (not shown). However, this time series runs
sion in the sortable-silt time series.
Carbon-isotope values from the benthic foraminiferan speciesCibicidoides wuellerstorfi(δ13CCW)from the same
core suggest a transient strengthening (preceding 8382 years BP, Fig. 10d) immediately followed by an approximately 100-year shoaling (between 8382 and 8269 years BP, Fig. 10d) of the LNADW, when it was likely completely replaced by Southern Ocean Deep Water (SOW) at the site (Kleiven et al., 2008). Since the minimum in the SS time
series from MD03-2665 coincides with the prominent nega-tive excursion in theδ13CCW record, the sortable-silt signal
in part likely reflects changes in water mass sourcing. Therefore, the inferred concentration and average size of magnetic grains within the core may be more revealing re-garding variations in the strength of the LNADW as these particles are thought to originate from the Nordic basaltic provinces and the main deep-ocean currents are considered to be their primary transport vectors (Kleiven et al., 2008). The magnetic parameters in MD03-2665 indicate that the shoaling of the LNADW was initially (up to approximately 8336 years BP) accompanied by a transient reduction in its strength (not shown) (Kleiven et al., 2008). As opposed to the sortable-silt records from MD99-2251 and JM97-MD95-2011, both the inferred minimum in the concentration and average size of magnetic minerals and the broader negative excursion inδ13CCWvalues are unique features of the
respec-tive Holocene time series from MD03-2665 (Figs. 10d, f) . While theSS time series from the mid-Norwegian
Mar-gin and the Gardar Drift are not directly comparable with the magnetic-mineral and carbon-isotope records from the Eirik Drift, the latter also support the idea of an asynchronous, multi-phase response of ocean circulation in the wake of the collapse of the ice dam over Hudson Bay.
It is thought that Atlantic waters are drawn across the Greenland–Scotland Ridge (GSR) as a consequence of thermohaline convection in the Arctic (Hansen and Østerhus, 2000). In the modern ocean, deep/intermediate waters form in the Norwegian Sea (mainly in the Lofoten Basin), in the Greenland Sea and north of Greenland in the Arctic Ocean (Fig. 11).
Instrumental records show that sea ice expands from northwest to southeast in the Nordic Seas, mirroring the tem-peratures of (sub)surface waters (Fetterer et al., 2002, up-dated 2009), which are primarily controlled by the Atlantic Inflow itself (Fig. 11).
explain the consequent heterogeneous response of the cur-rents making up the Atlantic overturning loop.
Colder and fresher Atlantic waters, reaching the north-western Nordic Seas and partly recirculating in the EGC, could trigger rapid sea-ice expansion in the Greenland Basin (Fig. 11). Initially, brine rejection could compensate for or even dominate over the freshening of Atlantic waters, thus enhancing deepwater formation in the western Nordic Seas, in agreement with near-modern LNADW δ13CCW values
from the Eirik Drift preceding 8382 years BP (Fig. 10d) (Kleiven et al., 2008). However, in the longer term, the in-sulating effect of a permanent sea-ice cover may have be-come the dominant control over thermohaline convection in the region (Zhong et al., 2011), resulting in the shoaling of the LNADW (DSOW) between 8382 and 8269 years BP (Fig. 10d), and contributing to the shallowing-up/slowing-down of the NEADW (ISOW) in the second half of the ninth millennium BP (Fig. 10c).
The freshening of the Atlantic Inflow may have had a more direct impact on deep convection in the Norwegian Sea. Nevertheless, depending on the southeasterly extent of the permanent ice cover, sea ice may also have contributed to changes in deepwater formation there as well. In any case, shifts in (sub)surface-ocean conditions in the eastern Nordic Seas would have affected only the ISOW, and hence primar-ily the NEADW.
Model results show that variations in atmospheric forcing may influence deepwater pathways, and thus the composi-tion of overflow waters in the Nordic Seas (Eldevik et al., 2009). Therefore, changes in large-scale wind patterns over the region in the second half of the ninth millennium BP, dis-cussed earlier, could also have affected the relative vigour of the DSOW and the ISOW.
We would expect the Atlantic Inflow to have been influ-enced by variations in the intensity of convection through-out the Arctic. In this respect, the temporal evolution of the strength of the NwASC as suggested by sortable-silt mean grain diameters from JM97-MD95-2011 (Figs. 11, 5a) ap-pears to be more plausible, as this record reflects a gradual decline in current vigour from about the time of the collapse of the ice dam over Hudson Bay (Fig. 5f) up until the cooling over Greenland (Fig. 5e).
If, however, the NwASC was the first to respond out of the three currents considered here, which is a possibility suggested by the sortable-silt index time series from the mid-Norwegian Margin (Fig. 10b, c, d), there must have been significant changes in large-scale atmospheric circula-tion patterns immediately following the collapse of the ice dam over Hudson Bay, for example, as a consequence of colder (sub)surface waters at mid-latitudes, initially reduc-ing north–south temperature gradients in the North Atlantic sector. It would also follow from this line of argument that at-mospheric forcing played a comparable role to thermohaline convection in regulating the flow of Atlantic waters into the Nordic Seas in the ninth millennium BP. Modern
observa-tions do suggest that changes in the North Atlantic wind stress curl may at times exert significant control over vari-ations in the strength of the NwASC (Orvik and Skagseth, 2003). However, due to the limited length of instrumental records, it is difficult to assess the relative importance of at-mospheric forcing in regulating volume transport in the At-lantic Inflow.
As we have indicated before, the change in ocean circula-tion preceding the 8.2 ka event might not have been uniquely dramatic in the context of post-deglacial conditions. One possible explanation could be that a significant percentage of the floodwater and iceberg discharge was actually routed into the southern Gulf Stream, and hence the Subtropical Gyre (STG, Fig. 1a) (Condron and Winsor, 2011). While re-constructions based on sediment core GeoB6007-2 (Fig. 1b) suggest a uniquely large surface-ocean cooling event off the coast of northwestern Africa at the time (not shown) (Kim et al., 2007), it is not possible to make inferences regard-ing the proportion of floodwaters and icebergs that could be trapped by the STG and the percentage that was eventually carried towards the high-latitude deep-convection sites based on palaeo-evidence only (purple arrows in Fig. 1b).
If, however, a significant percentage of the combined vol-ume of the floodwater and iceberg discharge was routed into the northern Gulf Stream, this would potentially mean that the Atlantic overturning loop of the AMOC, or at least its warm (sub)surface limb, may be less sensitive to fresh-water forcing than indicated by modelling experiments. Al-ternatively, variations in its strength may be the net result of a number of competing forcing mechanisms, including winds and atmospheric pressure gradients, which may par-tially compensate for the consequences of (sub)surface-water freshening.
11 Conclusions
We propose that the final drainage of Lake Agassiz–Ojibway was accompanied by a major iceberg discharge from Hud-son Bay (Bond et al., 2001). This can potentially mean that the initial freshwater forcing may have been significantly larger than the total volume of meltwaters contained by Lake Agassiz–Ojibway (Barber et al., 1999).
The temporal evolution and nature of the forcing thus may also have been different from that suggested by the lake-outburst theory:
1. The icebergs could not have left Hudson Strait as rapidly as the meltwater from the lake (Barber et al., 1999).
3. By absorbing the latent heat of melting from the ambient ocean, icebergs could significantly cool the northward-directed northern Gulf Stream–North Atlantic Drift–Norwegian Atlantic Current system (Wiersma and Jongma, 2010).
If most of the floodwater and iceberg discharge did end up in the northern Gulf Stream, our results suggest that even such a significant freshwater input could not bring about a uniquely large slowdown in the overturning circulation, at least not in the NwASC, as has been shown in many modelling experi-ments (e.g. LeGrande et al., 2006; Renssen et al., 2001).
Since our current-strength proxy records from the mid-Norwegian Margin donotevidence an exceptionally strong reduction in the main branch of the Atlantic Inflow into the Nordic Seas at the time, we argue that a chilled northward-directed (sub)surface-current system could ultimately be re-sponsible for the 8.2 ka climate perturbation. It could con-tribute to the rapid thickening and expansion of Arctic sea ice, leading to a fast increase in surface albedo and an ef-fective insulation of the ocean from the atmosphere. Further-more, a colder initial background climate state could have primed the high-latitude ocean prior to the event (Rohling and Pälike, 2005). With surface waters already closer to their freezing point, a colder Atlantic Inflow could more easily trigger widespread sea-ice growth.
The temporal evolution of the cooling over Greenland is very different from that of the strength of the NwASC. The potentially lagged and relatively abrupt start (and end) of the former indicate that changes in atmospheric forcing may also have played an important role in the 8.2 ka climate perturb-ation.
We must emphasise, however, that our current-strength re-constructions are based on a carefully selected but unortho-dox site.
In general, the basic assumption when reconstructing past changes in current strength is that the flow was in direct con-tact with the sea floor at the site of interest over the target time interval and that hydrodynamic processes close to the bed were responsible for the selective deposition of primary particles there (McCave and Hall, 2006).
In our case the initial deposition locus of NwASC-sorted muds is likely within the same cross-slope channel but up-slope of where the HA is located, and another sedimentary process, in the form of internal-wave-generated, low-energy turbidity plumes, ensures the continuous delivery of these sediments to their final deposition site, i.e. our coring loca-tion (Tegzes et al., 2014a).
While the in-depth study of the site suggests that the HA lies at a depth and in an area where currents tend to be too weak (≈0 cm.s−1)to sort the sediments (Voet et al., 2010), and that the downslope delivery mechanism likely cannot
to corroborate the robustness of our current-strength recon-structions, especially in view of the potential significance of our findings regarding the response of the NwASC in the wake of the collapse of the ice dam over Hudson Bay.
This would necessitate a careful survey of Holocene high-accumulation areas along the continental margin and an in-depth study of all sedimentary processes that could poten-tially be responsible for their formation and physical proper-ties. Samples from high-accumulation areas deemed suitable for making inferences about the past strength of the NwASC could then be analysed for sortable silt.
The NwASC is a strong topographically trapped (sub)surface current which leaves mostly lag deposits behind where it is leaning onto the shelf and upper continental slope (Laberg et al., 2005). In addition, there are a number of un-stable areas along the Norwegian Margin. Thus, likely only a limited number of locations exist where current-controlled deposition may have occurred, and even fewer where the current-strength signal may have been preserved (Tegzes et al., 2014a).
Acknowledgements. This research was carried out within the
framework of the ESF EuroMARC project AMOCINT funded by the Research Council of Norway as part of the NORKLIMA programme and by the Bjerknes Centre for Climate Research (BCCR). The authors would like to thank Bjørg Risebrobakken, Carin Andersson, Claude Hillaire-Marcel, Matthias Moros, Dag Inge Blindheim and Tor Mjell for thoughtful discussions; Bjørg Risebrobakken, Carin Andersson, Luke Skinner and two anonymous reviewers for their comments that led to an improved manuscript; Dag Inge Blindheim for laboratory assistance; Bjørg Risebrobakken, Carin Andersson, Matthias Moros and Helga Flesche Kleiven for making their data available; and all colleagues who published their data via the IGBP PAGES/World Data Center for Paleoclimatology and the PANGAEA information system.
Edited by: L. Skinner
References
Andersson, C., Risebrobakken, B., Jansen, E., and Dahl, S. O.: Late Holocene surface ocean conditions of the Norwe-gian Sea (Vøring Plateau), Paleoceanography, 18, 1044, doi:10.1029/2001PA000654, 2003.
Andersson, C., Pausata, F. S. R., Jansen, E., Risebrobakken, B., and Telford, R. J.: Holocene trends in the foraminifer record from the Norwegian Sea and the North Atlantic Ocean, Clim. Past, 6, 179–193, doi:10.5194/cp-6-179-2010, 2010.
cold event of 8200 years ago by catastrophic drainage of Lauren-tide lakes, Nature, 400, 344–348, 1999.
Berner, K. S., Koç, N., Godtliebsen, F., and Divine, D.: Holocene climate variability of the Norwegian Atlantic Current during high and low solar insolation forcing, Paleoceanography, 26, PA2220, doi:10.1029/2010PA002002, 2011.
Blindheim, J.: Arctic intermediate water in the Norwegian sea, Deep Sea Res. Pt A, 37, 1475–1489, doi:10.1016/0198-0149(90)90138-L, 1990.
Bond, G., Kromer, B., Beer, J., Muscheler, R., Evans, M. N., Show-ers, W., Hoffmann, S., Lotti-Bond, R., Hajdas, I., and Bonani, G.: Persistent solar influence on North Atlantic climate during the Holocene, Science, 294, 2130–2136, 2001.
Bond, G. C., Kromer, B., Beer, J., Muscheler, R., Evans, M. N., Showers, W., Hoffmann, S., Lotti-Bond, R., Hajdas, I., and Bo-nani, G.: North Atlantic Holocene Drift Ice Proxy Data, IGBP PAGES/World Data Center for Paleoclimatology, Data Contri-bution Series # 2008-018, NOAA/NCDC Paleoclimatology Pro-gram, Boulder CO, USA, 2008.
Condron, A. and Winsor, P.: A subtropical fate awaited freshwater discharged from glacial Lake Agassiz, Geophys. Res. Lett., 38, L03705, doi:10.1029/2010gl046011, 2011.
Darling, K. F., Kucera, M., Kroon, D., and Wade, C. M.: A resolution for the coiling direction paradox in
Neoglobo-quadrina pachyderma, Paleoceanography, 21, PA2011,
doi:10.1029/2005PA001189, 2006.
Dokken, T. M. and Jansen, E.: Rapid changes in the mechanism of ocean convection during the last glacial period, Nature, 401, 458–461, 1999.
Dreger, D.: Decadal-to-Centennial-Scale Sediment Records of Ice Advance on the Barents Shelf and Meltwater Discharge Into the Northeastern Norwegian Sea Over the Last 40 kyr, Ph.D. thesis, Christian-Albrechts-Universität, Kiel, Germany, 80 pp., 1999. Dyke, A. S., Ehlers, J., and Gibbard, P. L.: An outline of North
American deglaciation with emphasis on central and northern Canada, in: Developments in Quaternary Sciences, Elsevier, London, 2004.
Eldevik, T., Nilsen, J. E. O., Iovino, D., Anders Olsson, K., Sandø, A. B., and Drange, H.: Observed sources and vari-ability of Nordic seas overflow, Nat. Geosci., 2, 406–410, doi:10.1038/ngeo518, 2009.
Ellison, C. R. W., Chapman, M. R., and Hall, I. R.: 8200 BP Event Foraminifer Data and Winter/Summer SST Reconstruc-tion, IGBP PAGES/World Data Center for Paleoclimatology, Data Contribution Series # 2006-065, NOAA/NCDC Paleocli-matology Program, Boulder CO, USA, 2006a.
Ellison, C. R. W., Chapman, M. R., and Hall, I. R.: Surface and Deep Ocean Interactions During the Cold Climate Event 8200 Years Ago, Science, 312, 1929-1932, 10.1126/science.1127213, 2006b.
Fetterer, F., Knowles, K., Meier, W., and Savoie, M.: Sea Ice In-dex, Boulder, Colorado USA: National Snow and Ice Data Cen-ter. Digital media, 2002, updated 2009.
Fohrmann, H., Backhaus, J. O., Blaume, F., Haupt, B. J., Kämpf, J., Michels, K., Mienert, J., Posewang, J., Ritzrau, W., Rumohr, J., Weber, M., and Woodgate, R.: Modern ocean current-controlled sediment transport in the Greenland-Iceland-Norwegian (GIN) Seas. In: The Northern North Atlantic: A Changing
Environ-ment, Schäfer, P., Ritzrau, W., Schlüter, M., and Thiede, J. (Eds.), Springer, Berlin, 2001.
Grönvold, K., Óskarsson, N., Johnsen, S. J., Clausen, H. B., Ham-mer, C. U., Bond, G., and Bard, E.: Ash layers from Iceland in the Greenland GRIP ice core correlated with oceanic and land sediments, Earth Planet. Sc. Lett., 135, 149–155, 1995. Grootes, P. M. and Stuiver, M.: Oxygen 18/16 variability in
Green-land snow and ice with 10−3to 105year time resolution, J. Geo-phys. Res., 102, 26455–26470, 1997.
Grootes, P. M., Stuiver, M., White, J. W. C., Johnsen, S., and Jouzel, J.: Comparison of oxygen isotope records from the GISP2 and GRIP Greenland ice cores, Nature, 366, 552–554, 1993.
Hansen, B. and Østerhus, S.: North Atlantic-Nordic Seas exchanges, Progress in Oceanography, 45, 109–208, doi:10.1016/S0079-6611(99)00052-X, 2000.
Hass, H. C., Andruleit, H., Baumann, A., Baumann, K.-H., Kohly, A., Jensen, S., Matthiessen, J., Samtleben, C., Schäfer, P., Schröder-Ritzrau, A., and Thiede, J.: The potential of synoptic plankton analyses for paleoclimatic investigations: five plank-ton groups from the Holocene Nordic Seas. In: The Northern North Atlantic: A Changing Environment, Schäfer, P., Ritzrau, W., Schlüter, M., and Thiede, J. (Eds.), Springer, Berlin, 2001. Hebbeln, D., Dokken, T., Andersen, E. S., Hald, M., and
Elverhøi, A.: Moisture supply for northern ice-sheet growth during the Last Glacial Maximum, Nature, 370, 357–360, doi:10.1038/370357a0, 1994.
Heegaard, E., Birks, H. J. B., and Telford, R. J.: Relationships be-tween calibrated ages and depth in stratigraphical sequences: an estimation procedure by mixed-effect regression, Holocene, 15, 612–618, 2005.
Hillaire-Marcel, C., de Vernal, A., and Piper, D. J. W.: Lake Agassiz Final drainage event in the northwest North Atlantic, Geophys. Res. Lett., 34, L15601, doi:10.1029/2007GL030396, 2007. Hjøllo, S. S.: A comparative study of the Norwegian Sea inflow,
The Geophysical Institute, University of Bergen, Bergen, 1999. Holtedahl, H.: Distribution and origin of surface sediments on the
Norwegian continental margin between 62◦N and 65◦N, with some remarks on the Late Quaternary litho- and biostratigra-phy, in: The Norwegian Coastal Current, edited by: Sætre, R. and Mork, M., University of Bergen, Bergen, 1981.
Hoogakker, B. A. A., Chapman, M. R., McCave, I. N., Hillaire-Marcel, C., Ellison, C. R. W., Hall, I. R., and Telford, R. J.: Dynamics of North Atlantic Deep Water masses during the Holocene, Paleoceanography, 26, PA4214, doi:10.1029/2011pa002155, 2011a.
Hoogakker, B. A. A., Chapman, M. R., McCave, I. N., Hillaire-Marcel, C., Ellison, C. R. W., Hall, I. R., and Telford, R. J.: North Atlantic Holocene Sortable Silt Grain Size Data, IGBP PAGES/World Data Center for Paleoclimatology, Data Contri-bution Series # 2011-143, NOAA/NCDC Paleoclimatology Pro-gram, Boulder CO, USA, 2011b.
Kim, J.-H., Meggers, H., Rimbu, N., Lohmann, G., Freudenthal, T., Müller, P. J., and Schneider, R. R.: Impacts of the North Atlantic gyre circulation on Holocene climate off northwest Africa, Ge-ology, 35, 387–390, doi:10.1130/g23251a.1, 2007.
the Glacial Lake Agassiz Freshwater Outburst, Science, 319, 60– 64, doi:10.1126/science.1148924, 2008.
Laberg, J. S., Stoker, M. S., Dahlgren, K. I. T., de Haas, H., Hafl-idason, H., Hjelstuen, B. O., Nielsen, T., Shannon, P. M., Vor-ren, T. O., van Weering, T. C. E., and Ceramicola, S.: Ceno-zoic alongslope processes and sedimentation on the NW Eu-ropean Atlantic margin, Mar. Petrol. Geol., 22, 1069–1088, doi:10.1016/j.marpetgeo.2005.01.008, 2005.
LeGrande, A. N. and Schmidt, G. A.: Ensemble, water isotope-enabled, coupled general circulation modeling in-sights into the 8.2 ka event, Paleoceanography, 23, PA3207, doi:10.1029/2008PA001610, 2008.
LeGrande, A. N., Schmidt, G. A., Shindell, D. T., Field, C. V., Miller, R. L., Koch, D. M., Faluvegi, G., and Hoffmann, G.: Con-sistent simulations of multiple proxy responses to an abrupt cli-mate change event, P. Natl. Acad. Sci. USA, 103, 837–842, 2006. McCave, I. N. and Hall, I. R.: Size sorting in marine muds: processes, pitfalls, and prospects for paleoflow-speed proxies, Geochem. Geophy. Geosy., 7, Q10N05, doi:10.1029/2008PA001610, 2006.
McCave, I. N., Manighetti, B., and Robinson, S. G.: Sortable silt and fine sediment size/composition slicing: parameters for palaeocurrent speed and palaeoceanography, Paleoceanography, 10, 593–610, 1995.
Meese, D. A., Alley, R. B., Fiacco, R. J., Germani, M. S., Gow, A. J., Grootes, P. M., Illing, M., Mayewski, P. A., Morrison, M. C., Ram, M., Taylor, K. C., Yang, Q., and Zielinski, G. A.: Pre-liminary depth-age scale of the GISP2 ice core, Special CRREL Report 94-1, USA, 1994.
Moros, M., Emeis, K., Risebrobakken, B. R., Snowball, I., Kui-jpers, A., McManus, J., and Jansen, E.: Sea surface temperatures and ice rafting in the Holocene North Atlantic: climate influ-ences on northern Europe and Greenland, Quaternary Sci. Rev., 23, 2113–2126, 2004.
Olsen, S. M., Hansen, B., Quadfasel, D., and Østerhus, S.: Ob-served and modelled stability of overflow across the Greenland-Scotland ridge, Nature, 455, 519–522, doi:10.1038/nature07302, 2008.
Orvik, K. A. and Niiler, P.: Major pathways of Atlantic water in the northern North Atlantic and Nordic Seas toward Arctic, Geo-phys. Res. Lett., 29, 1896, doi:10.1029/2002gl015002, 2002. Orvik, K. A. and Skagseth, Ø.: The impact of the wind stress
curl in the North Atlantic on the Atlantic inflow to the Nor-wegian Sea toward the Arctic, Geophys. Res. Lett., 30, 1884, doi:10.1029/2003GL017932, 2003.
Rasmussen, S. O., Andersen, K. K., Svensson, A. M., Stef-fensen, J. P., Vinther, B. M., Clausen, H. B., Siggaard-Andersen, M. L., Johnsen, S. J., Larsen, L. B., Dahl-Jensen, D., Bigler, M., Röthlisberger, R., Fischer, H., Goto-Azuma, K., Hansson, M. E., and Ruth, U.: A new Greenland ice core chronol-ogy for the last glacial termination, J. Geophys. Res., 111, D06102, doi:10.1029/2005JD006079, 2006.
Rasmussen, S. O., Vinther, B. M., Clausen, H. B., and Ander-sen, K. K.: Early Holocene climate oscillations recorded in three Greenland ice cores, Quaternary Sci. Rev., 26, 1907–1914, 2007.
Jansen, E., Moros, M., and Ivanova, E. V.: Early Holocene tem-perature variability in the Nordic Seas: The role of oceanic heat advection versus changes in orbital forcing, Paleoceanography, 26, PA4206, 10.1029/2011pa002117, 2011.
Risebrobakken, B., Jansen, E., Andersson, C., Mjelde, E., and Hevrøy, K.: Foraminifera abundance and sea-surface temperature of sediment core JM97-948/2A, PAN-GAEA/ICSU World Data System, Bremen, Bremerhaven, doi:10.1594/PANGAEA.510801, 2003a.
Risebrobakken, B., Jansen, E., Andersson, C., Mjelde, E., and Hevrøy, K.: Foraminiferal abundance and sea-surface temperature of sediment core MD95-2011, PAN-GAEA/ICSU World Data System, Bremen, Bremerhaven, doi:10.1594/PANGAEA.510781, 2003b.
Risebrobakken, B., Jansen, E., Andersson, C., Mjelde, E., and Hevrøy, K.: A high-resolution study of Holocene paleoclimatic and paleoceanographic changes in the Nordic Seas, Paleoceanog-raphy, 18, 1017, doi:10.1029/2002PA000764, 2003c.
Risebrobakken, B., Jansen, E., Andersson, C., Mjelde, E., and Hevrøy, K.: Stable oxygen isotopes on foraminifera of sediment core JM97-948/2A, PANGAEA/ICSU World Data System, Bre-men, Bremerhaven, doi:10.1594/PANGAEA.510799, 2003d. Risebrobakken, B., Jansen, E., Andersson, C., Mjelde, E., and
Hevrøy, K.: Stable oxygen isotopes on planktic foraminifera of sediment core MD95-2011, PANGAEA/ICSU World Data Sys-tem, Bremen, Bremerhaven, doi:10.1594/PANGAEA.510782, 2003e.
Rohling, E. J. and Pälike, H.: Centennial-scale climate cooling with a sudden cold event around 8200 years ago, Nature, 434, 975– 979, 2005.
Rumohr, J., Blaume, F., Erlenkeuser, H., Fohrmann, H., Hollen-der, F.-J., Mienert, J., and Schäfer-Neth, C.: Records and pro-cesses of near-bottom sediment transport along the Norwegian-Greenland Sea margins during Holocene and Late Weich-selian (Termination I) times, in: The Northern North Atlantic: A Changing Environment, edited by: Schäfer, P., Ritzrau, W., Schlüter, M., and Thiede, J., Springer, Berlin, 2001.
Ryan, W. B. F., Carbotte, S. M., Coplan, J. O., O’Hara, S., Melko-nian, A., Arko, R., Weissel, R. A., Ferrini, V., Goodwillie, A., Nitsche, F., Bonczkowski, J., and Zemsky, R.: Global multi-resolution topography synthesis, Geochem. Geophy. Geosy., 10, Q03014, doi:10.1029/2008GC002332, 2009.
Smedsrud, L. H., Sirevaag, A., Kloster, K., Sorteberg, A., and Sand-ven, S.: Recent wind driven high sea ice area export in the Fram Strait contributes to Arctic sea ice decline, The Cryosphere, 5, 821–829, doi:10.5194/tc-5-821-2011, 2011.
Søiland, H., Prater, M. D., and Rossby, T.: Rigid topographic control of currents in the Nordic Seas, Geophys. Res. Lett., 35, L18607, doi:10.1029/2008gl034846, 2008.
Steig, E. J., Grootes, P. M., and Stuiver, M.: Seasonal precipitation timing and ice core records, Science, 266, 1885–1886, 1994. Stuiver, M., Grootes, P. M., and Braziunas, T. F.: The GISP2δ18O
Tegzes, A. D., Jansen, E., and Telford, R. J.: Reconstructing varia-tions in the strength of the main branch of the Norwegian Atlantic Current over the Late Holocene using grain-size parameters, in revision, 2014a.
Tegzes, A. D., Jansen, E., and Telford, R. J.: Sortable-silt mean size or sortable-silt mean grain diameter is the better proxy for palaeo-current strength? A case study, in revision, 2014b. Teller, J. T., Leverington, D. W., and Mann, J. D.: Freshwater
out-bursts to the oceans from glacial Lake Agassiz and their role in climate change during the last deglaciation, Quaternary Sci. Rev., 21, 879–887, 2002.
Thomsen, E. and Vorren, T. O.: Macrofaunal palaeoecology and stratigraphy in late quaternary shelf sediments off Northern Nor-way, Palaeogeogr. Palaeocl., 56, 103–150, 1986.
van Angelen, J. H., van den Broeke, M. R., and Kwok, R.: The Greenland Sea Jet: A mechanism for wind-driven sea ice ex-port through Fram Strait, Geophys. Res. Lett., 38, L12805, doi:10.1029/2011GL047837, 2011.
Vinther, B. M., Clausen, H. B., Johnsen, S. J., Rasmussen, S. O., Andersen, K. K., Buchardt, S. L., Dahl-Jensen, D., Seierstad, I. K., Siggaard-Andersen, M. L., Steffensen, J. P., Svensson, A., Olsen, J., and Heinemeier, J.: A synchronized dating of three Greenland ice cores throughout the Holocene, J. Geophys. Res. Atmos., 111, D13102, doi:10.1029/2005JD006921, 2006.
Voet, G., Quadfasel, D., Mork, K. A., and Søiland, H.: The mid-depth circulation of the Nordic Seas derived from profil-ing float observations, Tellus A, 62, 1–14, doi:10.1111/j.1600-0870.2010.00444.x, 2010.
Vorren, T. O., Hald, M., and Thomsen, E.: Quaternary sediments and environments on the continental shelf off northern Norway, Mar. Geol., 57, 229–257, doi:10.1016/0025-3227(84)90201-9, 1984.
Wiersma, A. P. and Jongma, J. I.: A role for icebergs in the 8.2 ka climate event, Clim. Dynam., 35, 535–549, doi:10.1007/s00382-009-0645-1, 2010.