Towards Personalized Cardiology: Multi-Scale
Modeling of the Failing Heart
Elham Kayvanpour1,2☯, Tommaso Mansi3☯, Farbod Sedaghat-Hamedani1,2☯, Ali Amr1,2,
Dominik Neumann3, Bogdan Georgescu3, Philipp Seegerer3, Ali Kamen3, Jan Haas1,2, Karen S. Frese1,2, Maria Irawati1, Emil Wirsz4, Vanessa King5, Sebastian Buss1, Derliz Mereles1, Edgar Zitron1, Andreas Keller6,7, Hugo A. Katus1,2,8, Dorin Comaniciu3, Benjamin Meder1,2,8*
1Department of Medicine III, University of Heidelberg, Heidelberg, Germany,2DZHK (German Centre for Cardiovascular Research), Heidelberg, Germany,3Siemens Corporation, Corporate Technology, Imaging and Computer Vision, Princeton, New Jersey, United States of America,4Siemens AG, Corporate Technology, Erlangen, Germany,5Siemens Corporation, Corporate Technology, Sensor Technologies, Princeton, New Jersey, United States of America,6Biomarker Discovery Center Heidelberg, Heidelberg, Germany,7Department of Human Genetics, Saarland University, Homburg, Germany,8Klaus Tschira Institute for Computational Cardiology, Heidelberg, Germany
☯These authors contributed equally to this work. *[email protected]
Abstract
Background
Despite modern pharmacotherapy and advanced implantable cardiac devices, overall prog-nosis and quality of life of HF patients remain poor. This is in part due to insufficient patient stratification and lack of individualized therapy planning, resulting in less effective treat-ments and a significant number of non-responders.
Methods and Results
State-of-the-art clinical phenotyping was acquired, including magnetic resonance imaging (MRI) and biomarker assessment. An individualized, multi-scale model of heart function covering cardiac anatomy, electrophysiology, biomechanics and hemodynamics was esti-mated using a robust framework. The model was computed on n=46 HF patients, showing for the first time that advanced multi-scale models can be fitted consistently on large cohorts. Novel multi-scale parameters derived from the model of all cases were analyzed and compared against clinical parameters, cardiac imaging, lab tests and survival scores to evaluate the explicative power of the model and its potential for better patient stratification. Model validation was pursued by comparing clinical parameters that were not used in the fit-ting process against model parameters.
Conclusion
This paper illustrates how advanced multi-scale models can complement cardiovascular imaging and how they could be applied in patient care. Based on obtained results, it becomes conceivable that, after thorough validation, such heart failure models could be
a11111
OPEN ACCESS
Citation:Kayvanpour E, Mansi T, Sedaghat-Hamedani F, Amr A, Neumann D, Georgescu B, et al. (2015) Towards Personalized Cardiology: Multi-Scale Modeling of the Failing Heart. PLoS ONE 10(7): e0134869. doi:10.1371/journal.pone.0134869
Editor:Thomas Berger, Medical University Innsbruck, AUSTRIA
Received:February 14, 2015
Accepted:July 14, 2015
Published:July 31, 2015
Copyright:© 2015 Kayvanpour et al. This is an open access article distributed under the terms of the
Creative Commons Attribution License, which permits unrestricted use, distribution, and reproduction in any medium, provided the original author and source are credited.
Data Availability Statement:All relevant data are within the paper and its Supporting Information files.
applied for patient management and therapy planning in the future, as we illustrate in one patient of our cohort who received CRT-D implantation.
Introduction
Systolic HF is a leading cause of hospitalization in developed countries. Its prevalence is esti-mated to increase by 25% till 2030 [1], with an associated health care expenditure increase of 120% in the same period. HF can be the result of a variety of underlying conditions, including ischemic, genetic and inflammatory cardiomyopathy, hypertension, metabolic diseases or toxic injury [2,3]. Currently, guideline-based therapies of HF rely mainly on the stage of the disease depending on patients’symptoms, cardiac performance as assessed by imaging modalities, and
few objective biomarkers, but rather neglect individual factors regarding disease etiology and prognosis. Although survival of systolic HF patients has improved over the past decades, mor-bidity and mortality rates are still unacceptably high. To improve survival, new clinical scores, molecular biomarkers and image-based technologies are required for more precise classifica-tion of disease stages and calculaclassifica-tion of the individual risk [4].
The past decades have seen a tremendous research effort in the computational modeling of cardiac function [5–22]. While they were first developed for biology and disease understanding
[5,6,8,13,23], these models are now maturing towards clinical application [5,7,10–12,14, 22,24–29]. This included the identification of the mathematical laws underlying biological
mechanisms such as cardiac electrophysiology, biomechanics, or hemodynamics, all of which have been derived or verified using experimental data. Later, multi-scale mathematical frame-works have been developed to simulate the cardiac function at the whole-organ scale [6,7,9,
14,15,24,30]. One challenge for a clinical use remained the issue of personalization from patients’clinical images and data, which is now one of the main research interests of the
scien-tific community (see for instance [7,11,14,15,22,24,31]). Hence, a large-scale evaluation is still missing due to the complexity of the personalization algorithms (from anatomy to func-tion) and the required computational power of the models.
In this study, we developed a multi-scale model of HF and explored if it can provide new insights on HF patients in a sufficiently large population. In particular, computationally effi-cient models coupled with robust parameter estimation methods are employed to estimate an individualized model on 46 HF cases. We show for the first time that estimated model parame-ters from imaging are very consistent with cardiac imaging, lab tests and prognosis scores. Because the employed multi-scale computational model is predictive, we also illustrate in one case its potential in personalized planning of cardiac resynchronization therapy.
Methods
Clinical Workflow and Patient Recruitment
The present study has been approved by the ethics committee, medical faculty of Heidelberg and participants have given written informed consent. In this case-only study, 46 patients were included with diagnosis of non-ischemic systolic HF and underwent diagnostic coronary angi-ography, echocardiangi-ography, cMRI, comprehensive clinical phenotyping and biomarker mea-surements for the evaluation of a newly HF onset. The majority of patients also received invasive hemodynamic assessment (left circulation in 43 (93%) cases, right circulation in 37 (80%) cases). To capture all stages of systolic heart failure, we also included symptomatic patients with only slightly decreased systolic performance in the initial assessment of cardiac preparation of the manuscript. The specific roles of
these authors are articulated in the‘author contributions’section.
function by echocardiography or ventricular angiography (LV-EF<55%). All patients showed
signs or symptoms of HF (e.g. breathlessness, reduced walking capacity, ankle swelling or pul-monary crackles) [3]. Patients with relevant CAD, valvular heart disease, acute myocarditis or a history of cardiotoxic chemotherapy were excluded.
Patient-Specific Computational Model of Human Non-ischemic Systolic
Heart Failure
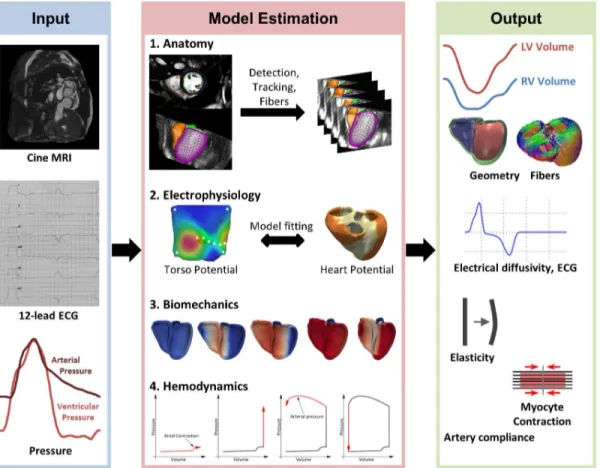
For each patient of the cohort (n = 46), a multi-scale, multi-physics model of cardiac function was estimated based on the pseudonymized imaging data, 12-lead ECG and invasive pressure catheterization [31]. Heart anatomy [32], electrophysiology [22,31], hemodynamics and bio-mechanics [31,33] were modeled (Fig 1). Each of these components is personalized to fit the observed physiology of the patient [31]. An overview of the approach is described in this sec-tion. The reader is referred to the cited references for more details due to lack of space.
Anatomy. First a detailed model of the bi-ventricular myocardium is generated. The myo-cardium is segmented under expert guidance from short-axis cine cMRI. The model includes the left and right endocardia, LV outflow tract, RV inflow and outflow tracts, and LV epicar-dium. Each of these components is estimated consistently and simultaneously using a machine-learning approach [32] and verified by an expert. In brief, the algorithm is trained from a large database of annotated cine cMRI to automatically detect the heart position, rota-tion and scale in the image. Each step is learned using the Marginal Space Learning framework
Fig 1. Overview of the modeling pipeline, from clinical data (input) to multi-scale, multi-physics cardiac models (output).The framework components are described in detail in methods.
and Probabilistic Boosting Trees [32]. A boundary detector is also learned from the database to recognize myocardium contours in the images. On unseen data, the algorithm first uses the location detectors to find the heart at the end-diastole time frame, and then fits a mean heart shape model whose contours are finally deformed according to the boundary detectors to match the myocardium boundaries. Once the model is detected, it is tracked over time using a symmetric image registration algorithm [34]. An expert then carefully verifies the tracked con-tours and edits them interactively if needed. Blood pool volume is finally computed at each time instant from the anatomical model.
Next, the surfaces of each component at end diastole are fused to form a unified, volumetric model of the bi-ventricular myocardium. As the RV epicardium is hardly visible in the cMRI, a standard thickness of 3mm is applied. The surface of the volumetric model is labeled as LV (left endocardium), RV (right endocardium), LV septum and RV septum based on the original segmentation [14,33]. Finally, a model of fiber architecture is generated following a rule-based approach [13]. In this study, LV elevation angles vary linearly from -60° to the epicardium to 0° to the mid-wall to 60° to the endocardium, RV elevation angles vary from -80° to 80°.
Electrophysiology. Patient cardiac electrophysiology (EP) is computed using a reaction-diffusion equation, so-called mono-domain equation, which models the dynamics of the trans-membrane potential and its diffusion throughout the myocardial tissue. In this study, the Mitchell and Schaeffer (M-S) model of the trans-membrane potential is employed [35]. Con-trary to more complex ionic models, which consider the ionic interactions through a large number of transmembrane channels [36], the M-S model captures the bulk inflow and outflow ionic exchanges as described in [35]. Despite its simplified formulation, M-S model has shown good behavior in pathological situations, in particular alternans, arrhythmias and wave re-entries [15,35,37]. The M-S model is controlled by four parameters, which have a direct impact on the dynamics of the action potential and the restitution curve. In particular, the duration of the action potential is directly controlled by the parameterτc, which is related to
the QT duration in the ECG. The other parameters (τopen,τin andτout), which control the
The personalization of the EP model is performed in three steps, as described in details in [39]. First, myocardium conductivity (cMyo) is automatically estimated using inverse modeling. To this end, the NEWUOA algorithm [40], a gradient-free optimization method, is used such that computed QRS duration (cQRSd) matches the mQRSd measured in the ECG signal. Next, LV and RV subendocardial conductivity, cLAand cRV, are estimated to capture the measured electrical axis (EA). Finally, the value of the parameterτc is directly inferred from the QT
inter-val. These three steps are iterated until convergence is reached (generally after two or three iter-ations). This fitting procedure is done only once per patient: at the end of it, the current state of patient cardiac electrophysiology is captured.
Biomechanics. The cardiac motion resulting from the electrophysiology computed as pre-viously described is calculated according to a multi-scale biomechanical model of the cardiac tissue [31,33]. More precisely, a two-element Hill model is employed. The passive properties of the myocardium are modeled as isotropic linear elastic tissue. A co-rotational implementa-tion is employed to correctly capture the large deformaimplementa-tions and rotaimplementa-tions during systole [41]. Tissue elasticity is parameterized by the Young’s modulus E and estimated from the images as
described below. Incompressibility is ensured by setting the Poisson ratioυto 0.48 for all cases
in this study. A phenomenological model of the active force generated during systole is coupled to the passive model [14,42]. The force is timed according to the electrophysiology while its maximal amplitude is controlled by the maximum active force parameterσ. The force increases
and decreases according to an exponential law with two different decay parameters, kATPand kRS, related to ATP binding and myosin head release rates [42]. The heart is fixed in space using a contact-based pericardium force, defined as the epicardial bag at end-diastole [43], and a basis stiffness constraint, modeled as springs attached around each of the four cardiac valves to mimic the ventricular attachment to the artery and atria. Both parameters E andσcan be set
regionally. In particular, LV E andσare estimated automatically for each patient by
minimiz-ing the sum of the squared differences between computed and measured ejection fraction (EF), stroke volume (SV), end-diastolic volume (EDV), end-systolic volume (ESV), end-diastolic pressure (EDP) and end-systolic pressure (ESP). As for the EP component, the minimization is performed using NEWUOA optimizer, as described in [31,40], and done only once for each case.
Hemodynamics. Finally, the biomechanical model is coupled with a lumped model of intra-cardiac hemodynamics to capture the pre-load and post-load conditions of the patients [14,23,33]. The four cardiac phases are calculated (filling, isovolumetric contraction, ejection, isovolumetric relaxation). A well-validated 3-element Windkessel model is employed to model the arteries [44], whose parameters (artery compliance C, peripheral resistance Rp, characteris-tic resistance Rc and remote pressure pr) are estimated from the arterial pressure catheteriza-tion measurement and the MRI-based blood flow measurement using an optimizacatheteriza-tion approach [31]. The lumped model of atrial contraction presented in [23] is also used. The ven-tricular pressure is calculated such that the isovolumetric constraint is ensured through a pre-diction-correction scheme as described in [33]. The phases are fully controlled by the electrophysiology (which triggers cardiac contraction) and hemodynamics load. In this study, no circulatory system was used contrary to [23], the two ventricles were not hemodynamically connected between each other. Although this could be a limitation to capture adaptation to pulmonary or systemic hypertension for instance, such a simplification showed promising results in heart failure modeling and cardiac resynchronization therapy, as highlighted by recent results reported by other groups [7,14]. The complete biomechanical model is imple-mented in SOFA, an open-source simulation framework [45].
depending on the level of editing required, building the anatomical model takes 1 minute (including meshing, tagging and fibers, all steps being automatic), the forward EP computation takes 5s, the forward EM computation takes 3 minutes. The personalization procedure, which requires several forward model estimations, takes between 3 to 4 hours per patient. Overall, going from the clinical data of a patient to a complete, personalized model takes approximately 3–5 hours. At each step, the user can verify the result and validate them before moving to the
next step.
CRT simulation
In addition to the main contribution of this study, which is the population analysis, we also illustrate in this manuscript how such a multi-scale model could be used for cardiac resynchro-nization therapy planning and guidance in our cohort. The model estimation procedure described in the previous section has been designed such that the model matches the observed patient physiology. However, the estimated parameters may not be unique due to noise and sparsity in the data, and model assumptions, as quantified in [31,46] for instance. Another way to evaluate the model is to test its predictive power after a change in the cardiac system. Indeed, even if two sets of parameters would yield the same visible cardiac motion, it is likely that only one would enable precise prediction of system changes, due to therapy for instance. We illustrate the predictive power of our framework in one patient of our cohort, who under-went CRT-D device implantation due to LV-EF<35%, left bundle branch blockage
(QRSd = 124 ms) and HF NYHA class III despite optimal medical therapy. An additional 12-lead ECG recording was acquired one day after device implantation and during testing of three different stimulation protocols: biventricular pacing (BiV; LV-RV delay = 20 ms), RV only stimulation and DDT-40 LV triggered. In all three cases we acquired comprehensive echo-cardiography. We first fitted the model to the baseline ECG (cQRSd = 123 ms (measured = 124 ms) and EA = -17° (measured = -17°),S5A Fig). The estimated electrical conductivities were equal to 320 mm2/s, 1600 mm2/s and 2200 mm2/s for the myocardium, LV endocardium and RV endocardium, respectively. It should be noted that in this experiment the estimation aimed to capture T-wave onset timing only, but not T-wave morphology. We then reproduced the CRT on the virtual heart based on the interventional report and the applied protocols
(S5B Fig).
Statistical Analysis
Statistical analyses were carried out with„R”software (version 3.0.2). Histograms were
calcu-lated using the“hist”function with standard parameters. Outliers were detected with the
Grubbs test available in the“outliers”package. Correlation coefficients were assessed by the “cor”function and corresponding significance values by the“cor.test”procedure. In order to
visualize the output, customized scatter plots were generated. Smoothing of scatter plots was carried out by the“smoothScatter”function included in the bioconductor“geneplotter”
pack-age. On top and right of each scatter plot, the distribution of both plotted variables was respec-tively drawn as box plot.
Results
Personalized multi-scale computer models are detailed representations
of systolic HF
provides the findings of ECG and cMRI recordings. After data anonymization and curation, we transferred imaging and hemodynamic data to the developed modeling framework.
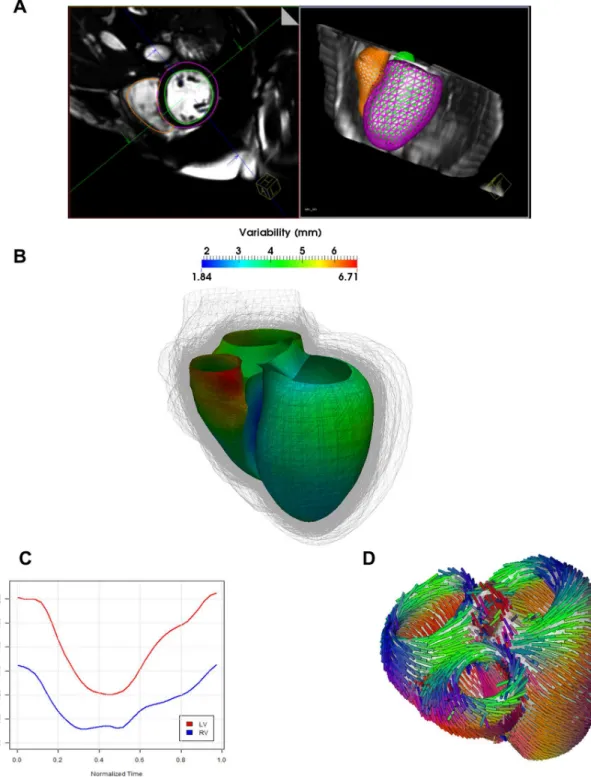
Anatomy Model. Three dimensional models of the bi-ventricular anatomy were generated from cMRI under expert guidance (Fig 2A). A considerable variability of bi-ventricular shapes could be observed across the population, with an average variation of about 5mm around a mean atlas calculated from the population [47] (Fig 2B). After heart tracking and volume com-putation (Fig 2C), mean left ventricle ejection fraction (LV-EF) of the computed models was 36 +/- 14%. In particular, three patients were identified having LV-EF in the normal range (55%), 10 mild reduction in LV-EF, 17 moderate LV-EF decrease and 16 had a severe dys-function.Fig 2Dshows the fiber architecture computed on the anatomical model in a typical case [30].
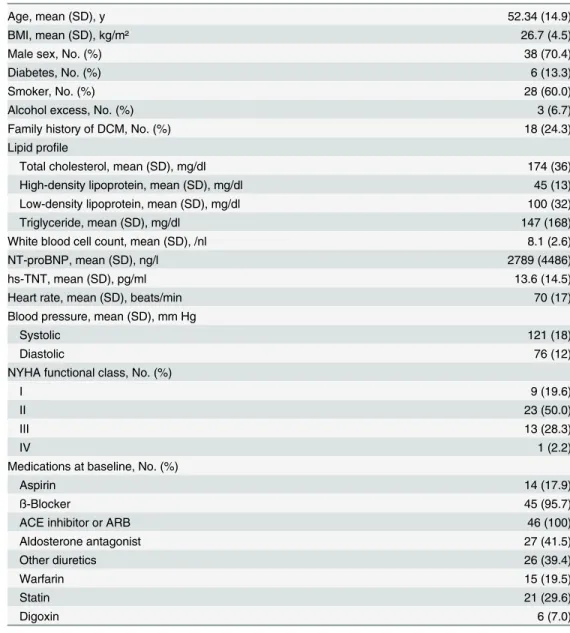
Table 1. Clinical characteristics of the patient cohort with non-ischemic systolic HF.
Age, mean (SD), y 52.34 (14.9)
BMI, mean (SD), kg/m² 26.7 (4.5)
Male sex, No. (%) 38 (70.4)
Diabetes, No. (%) 6 (13.3)
Smoker, No. (%) 28 (60.0)
Alcohol excess, No. (%) 3 (6.7)
Family history of DCM, No. (%) 18 (24.3)
Lipid profile
Total cholesterol, mean (SD), mg/dl 174 (36)
High-density lipoprotein, mean (SD), mg/dl 45 (13)
Low-density lipoprotein, mean (SD), mg/dl 100 (32)
Triglyceride, mean (SD), mg/dl 147 (168)
White blood cell count, mean (SD), /nl 8.1 (2.6)
NT-proBNP, mean (SD), ng/l 2789 (4486)
hs-TNT, mean (SD), pg/ml 13.6 (14.5)
Heart rate, mean (SD), beats/min 70 (17)
Blood pressure, mean (SD), mm Hg
Systolic 121 (18)
Diastolic 76 (12)
NYHA functional class, No. (%)
I 9 (19.6)
II 23 (50.0)
III 13 (28.3)
IV 1 (2.2)
Medications at baseline, No. (%)
Aspirin 14 (17.9)
ß-Blocker 45 (95.7)
ACE inhibitor or ARB 46 (100)
Aldosterone antagonist 27 (41.5)
Other diuretics 26 (39.4)
Warfarin 15 (19.5)
Statin 21 (29.6)
Digoxin 6 (7.0)
ACE: angiotensin-converting enzyme; ARB: angiotensin II receptor blocker; DCM: dilated cardiomyopathy; No: Number; NYHA: New York Heart Association; SD: Standard deviation.
Electrophysiology Model. Electrical conductivity for the myocardium (cMyo), left (cLV) and right endocardia (cRV) were estimated based on the anatomical model and the QRS dura-tion (QRSd) and electrical axis (EA) measured from the 12-lead ECG traces [31]. After personalization, computed cQRSd matched the measured mQRSd within 12 +/- 10 ms accu-racy (R = 0.82, p<10−7), confirming the ability of the model to capture HF electrophysiology
and the efficacy of the ECG personalization algorithm. The EA was in some cases more diffi-cult to estimate (mean error = -23 +/- 55 degrees, R = 0.32, p<0.05), probably due to localized
pathologies (e.g. bundle blocks) that was not captured by our global personalization proce-dure. The distribution of the estimated conductivities across the population is displayed inS1
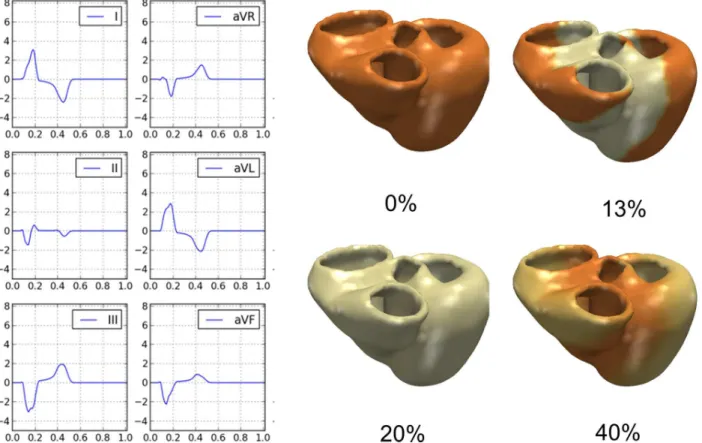
Fig.Fig 3shows the electrical activation and the computed ECG traces (first six leads)
calcu-lated for the same patient illustrated inFig 1. For that example, computed QRSd, QTd and EA were equal to 172 ms, 458 ms and -42 degrees respectively, compared to the measured values of 175 ms (ΔQRS = 3ms), 456 ms (ΔQT = 2ms) and -42° (ΔEA = 0°) of the surface 12-lead ECG.
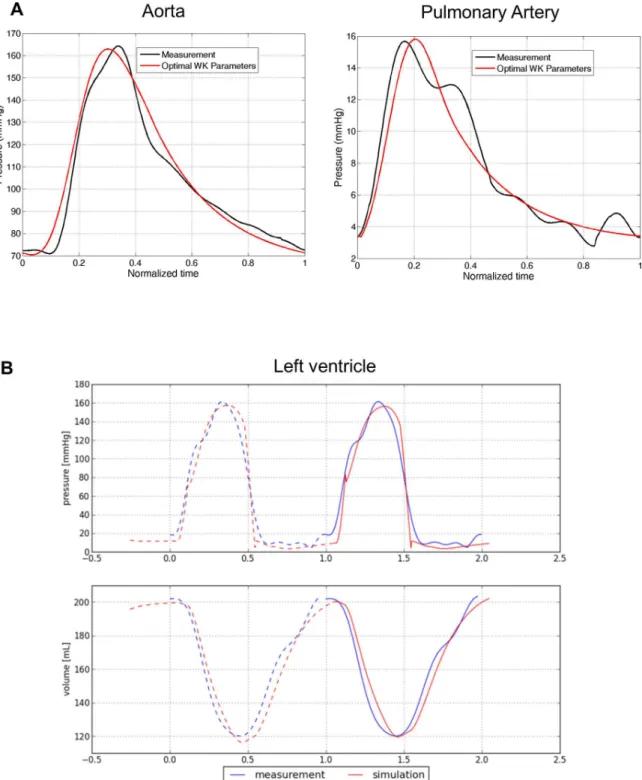
Hemodynamics Model. Patient-specific artery compliance and resistances were estimated from cMRI-derived volume curves and invasive pressure catheterization [31].Fig 4A illus-trates, again in the same case, the computed arterial pressure curves in the left (systemic) and right (pulmonary) main arteries after personalization. As one can see, the model captured the main trends of the pressure dynamics, in particular systolic and diastolic pressures.Table 3
reports descriptive statistics of the estimated artery compliance (C), peripheral resistance (Rp), characteristic resistance (Rc) and remote pressure (Pr) (histograms reported inS2 Fig). It should be noted that for the very few patients who did not have invasive pressure measure-ments, generic values were applied (Table A inS1 File).
Biomechanical Model. Finally, we computed cardiac electromechanics for all cases. LV stiffness E and maximum active forceσwere estimated (S3 Fig) [31]. The model allowed us
also to derive the time-varying ventricular volume and pressure, which we compared with the invasive measurements to further evaluate model goodness of fit (Fig 4B). Qualitatively, the fit-ting was judged by two independent experts to be excellent in 29 patients (i.e. perfect match of the volume and pressure curves up to the noise level), good in 15 (i.e. the main trends of the volume and pressure curves were captured, but not in all details), and sub-optimal in 2 cases (curves did not match). Quantitatively,S4 Figshows the correlation between the cMRI-derived and model-derived LV-EF (A) and stroke volume (SV) (B), underlining the precision of the HF model in terms of global cardiac function.
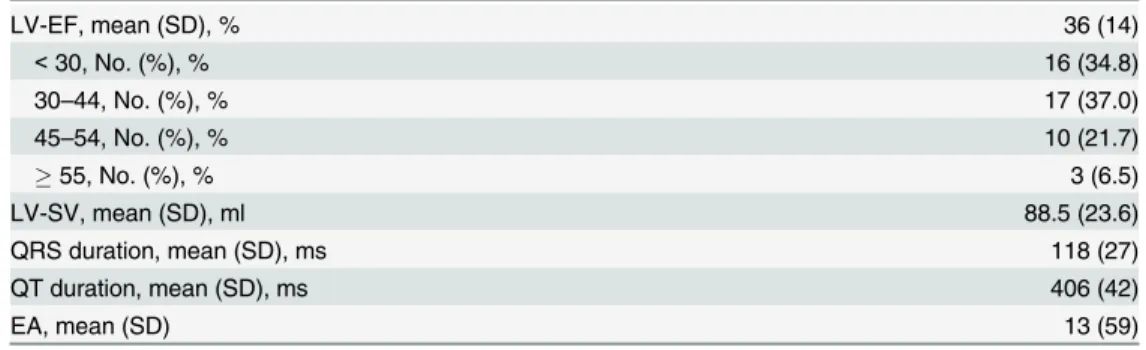
Table 2. ECG and cMRI findings of patient cohort with non-ischemic systolic HF.
LV-EF, mean (SD), % 36 (14)
<30, No. (%), % 16 (34.8)
30–44, No. (%), % 17 (37.0)
45–54, No. (%), % 10 (21.7)
55, No. (%), % 3 (6.5)
LV-SV, mean (SD), ml 88.5 (23.6)
QRS duration, mean (SD), ms 118 (27)
QT duration, mean (SD), ms 406 (42)
EA, mean (SD) 13 (59)
EA: electric axis of the heart; LV-EF: left ventricular ejection fraction; LV-SV: left ventricular stroke volume; No: Number; SD: Standard deviation.
Fig 2. Automated estimation of the 3D anatomical model. A)Automatic segmentation of the right and left ventricle.B)Observed variability in cardiac anatomy (shape is color-coded on a template) estimated from the HF cohort. The representation indicates the variability in phenotypes from the cohort.C) After the different steps of the model computation are finished, computed intracardiac volume variations can be estimated.D)Fiber architecture applied to the personalized heart models.
Estimation of novel cardiac functional parameters using a virtual failing
heart
One advantage of the multi-scale model is that it provides functional parameters that cannot be directly measured from image analysis or clinical phenotyping, potentially providing novel surrogates of HF and further insights into patient’s condition or disease stage. Table B inS1 Filesummarizes some of the new parameters derived from the model. To examine the clinical value of those new parameters, we performed correlation analyses (Pearson coefficient) with rich clinical phenotypes. To avoid bias in the study, only the data that was not used in the model fitting procedure were investigated.
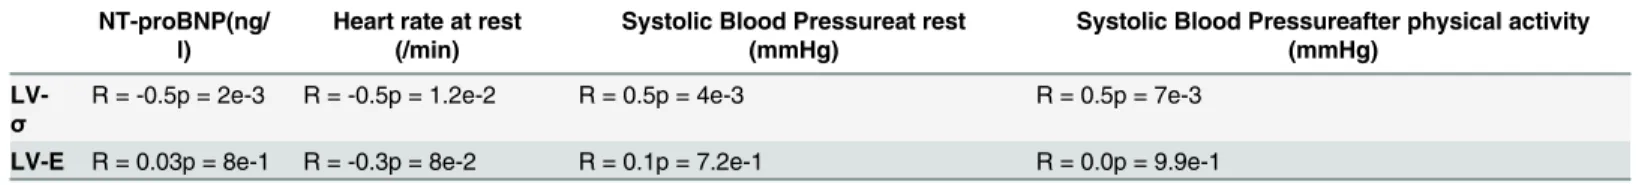
As shown inTable 4, a good correlation was found between left ventricular active force and the systolic blood pressure after physical activity. Left ventricular active force negatively corre-lated with the diagnosis and prognosis biomarker NT-ProBNP. Although these correlations are still modest, they provide a first hint at the potential use in further stratifying patients, espe-cially since they may provide unambiguous disease information.
To further explore a potential prognostic value, we performed correlation analyses of the unique parameters with the Seattle HF Score [48]. The Seattle HF Model predicts survival of HF patients by using a complex set of clinical characteristics such as the NYHA class, ischemic etiology, diuretic dose, left ventricular ejection fraction, systolic blood pressure, sodium, hemo-globin, percent lymphocytes, uric acid, and cholesterol. The Seattle score could be completely calculated in 40 patients at the time of their inclusion. After performing Grubb’s testing, one of
40 patients was detected as a statistical outlier and hence was excluded from the analysis. As
Fig 3. Patient-specific electrophysiology computation. Left Panels:Computed ECG traces from the model in the patient exemplarily chosen.Right Panels:Computed trans-membrane potential propagation throughout the cardiac cycle (time in % of cycle length).
shown inFig 5, a highly significant correlation between LV active forceσand the Seattle 5-year
score was found (R = 0.77, p = 2.7x10⁻⁵). Interestingly, this finding suggests that the maximum stress the myocardium can generate is predictive of HF outcome, the more impaired the myo-cardium contractility, the poorer the outcome.
Fig 4. Patient-specific hemodynamics. A)Personalized computation of arterial flow after personalization of the Windkessel parameters.B)Measured and computed LV pressure and volume curve in one patient, showing the high concordance between the clinical and modeling data.
Computed heart models for therapy planning
As an example of application for personalized therapy, we simulated CRT using our virtual heart in one patient of our cohort. As shown inS5C Figand Table C inS1 File, the model was able to successfully and highly accurately predict the changes in cardiac electrophysiology for different CRT stimulation protocols. It was able to predict the worsening of cardiac EP for both BiV and RV pacing modes (increased QRSd as a predictor of nonresponse [49,50]) and also the preservation of EP function with the LV-triggered protocol. The later protocol was chosen by the independent treating electrophysiologist (independently from the model result), the
Table 3. Statistics of estimated Windkessel parameters throughout the studied population.
C (mm3/mmHg) Rp (mmHg/mm3) Rc (mmHg/mm3) Pr (mmHg)
Aorta 2269±1375 3.64e-4±2.27e-4 4.72e-5±2.46e-5 52±23
Pulmonary artery 2757±1869 1.51e-4±1.51e-4 2.91e-5±2.26e-5 15±9
doi:10.1371/journal.pone.0134869.t003
Table 4. Correlations between LV active force and LV stiffness and clinical presentations of patients.
NT-proBNP(ng/ l)
Heart rate at rest (/min)
Systolic Blood Pressureat rest (mmHg)
Systolic Blood Pressureafter physical activity (mmHg)
LV-σ
R = -0.5p = 2e-3 R = -0.5p = 1.2e-2 R = 0.5p = 4e-3 R = 0.5p = 7e-3
LV-E R = 0.03p = 8e-1 R = -0.3p = 8e-2 R = 0.1p = 7.2e-1 R = 0.0p = 9.9e-1
doi:10.1371/journal.pone.0134869.t004
Fig 5. Correlation between Left ventricular active force and estimated outcome of the patients. Correlation plot showing the left ventricular active force in the patients (x-axis) and their Seattle 5 Year Score (y-axis).
patient showed 7 months after device implantation a significant improvement of clinical symp-toms (NYHA III improved to NYHA II) as well as LV-EF (EF improved from 20% to 30%).
Discussion
Thanks to advanced guideline-adherent pharmaco- and device therapy of HF, mortality and hospitalization have been reduced. Yet, HF is still one of the major causes of death and societal burden, requiring novel therapies and personalized diagnostics [51]. In particular, the impact of individual, patient-specific factors is largely neglected in current therapies. The addition of personalization to the treatments recommended in current guidelines is seen as an opportunity to further improve the outcome and quality of care in HF.
Besides the search for novel drug targets and HF biomarkers, the computational modeling community has been striving to provide novel solutions in HF care in the form of generative models of heart physiology [5,7,10–12,14,15,22,36]. The simulation of subcellular
mecha-nisms is already possible with high fidelity compared to experimental data [30,36,52]. At the organ level, these simulations are far more complex, but have resulted in the development of prototypes of virtual hearts. Recent effort is now focusing on the translation of these models to the clinics [7,14,15]. The model presented in this study relies on validated biophysical models and numerical methods [22,33] and combines this with a fitting framework that allowed for the first time investigation of an adequately sized cohort of clinically well-characterized HF patients [31]. Indeed, the experiments performed in this study highlighted the necessity of hav-ing computationally efficient numerical methods and streamlined, fully-integrated personaliza-tion procedures to minimize user interacpersonaliza-tion and enable efficient and reproducible workflows.
As shown in [22], the personalization approach is able to estimate one solution of the inverse problem, with a good fit to the data. We could statistically compare the estimated parameters with clinical phenotyping and imaging, thus verifying the clinical meaningfulness of these parameters. For instance, we could find that the myocardium active force, i.e. the abil-ity of the myocardium to contract, could be an indicator of disease severabil-ity, similar to what was reported in [53] using a study on three cases.
As shown in [54], several sets of parameters could yield the same observable physiology and noise in clinical data can considerably decrease model precision. One advantage of the present study is the availability of extended phenotyping, including MRI, echocardiography, pressure catheterization and lab tests. This unique dataset helped decreasing parameter uncertainty [31], which is reflected by the highly reproducible estimation of cardiac performance when compared to measured parameters. Similarly, the sparsity of the clinical observation (12-lead ECG) yields to a significant level of uncertainty in estimated electrical conductivities, as quanti-fied in [22]. Despite this limitation, the model was still able to predict therapy in the illustrative example reported in the results section and in [39]. The topic of parameter uncertainty is an important research area [25,31,46,54], which requires further investigations.
interesting to validate them in independent cohorts and compare them to existing scores and measures, as we did with the Seattle HF score.
More thorough validation of predictive mathematical models of disease processes will be the key for their implementation into clinical practice. One approach is the evaluation of the predictive power of these models in terms of therapy outcome, such as cardiac resynchroniza-tion therapy (CRT). Although not the main focus of this study, we illustrate how such a model could be used for CRT planning, suggesting good predictive power in terms of acute QRS dura-tion. From preoperative data, we calculated acute postoperative ECG and successfully com-pared the result with the clinical observation. Computational modeling for CRT planning has been investigated in the past [7,12,14,26]. Yet, they were based on generic geometries [26], assumed the postoperative electrophysiology [14] or did not predict the resulting ECG while assuming postoperative hemodynamics [9]. Instead, in this manuscript we illustrate how car-diac electrophysiology and ECG could be predicted based on preoperative data only. Future works include a comprehensive evaluation of this aspect on a larger cohort.
Several assumptions were made in the model used in this study, which can be a limitation. First, the ECG computation assumed homogeneous tissue between the heart and the body sur-face, with one electrical conductivity [22]. While this simplification can have an impact on the shape of the ECG trace, numerical studies have shown that global parameters such as QRS and QT duration are minimally dependent on tissue heterogeneity and therefore justify our approach [55]. After personalization, the model precisely captured the main features of the heart’s
func-tion, such as QRS duration and QT intervals. EA was more difficult to capture. A potential rea-son for this limitation is the fact that cardiac electrophysiology was only globally perrea-sonalized, thus missing potential localized pathological features like lines of blocks, as confirmed in recent experiments [39]. Another simplification of the model is the linear assumption of the myocar-dium tissue. Ex-vivo studies showed that cardiac tissue is an orthotropic, hyper-elastic material [56]. Future work includes using more advanced models including orthotropic tissue material and whole-body circulatory models for more accurate estimation of tissue properties and more realistic cardiac motion computation. First results in that direction were reported in [33,54]. The biomechanical model was also globally fitted to the data. While this approach enabled capturing global parameters like EF and SV, regional impairments were not captured, contrary to [53]. In these cases, the global parameters might be biased to cope with the regional pathological feature.
Supporting Information
S1 Fig. Distribution of estimated electrical conductivity in the cohort. A)In average the myocardial electrical conductivity cMyowas equal to 413 +/- 232 mm2/s.B and C)Left and right endocardial conductivity were higher as expected owing to the fast Purkinje conduction system.
(TIFF)
S2 Fig. Distribution of estimated Windkessel parameters in the cohort.Upper panels: Hemodynamics features of the aorta. Lower panels: Hemodynamics features of pulmonary artery. For values see also Table A inS1 File.
(TIF)
S3 Fig. Distributions of the estimated stiffness E and active forceσin the cohort.Average LV stiffness E is 590 ± 135 kPa and LV maximum active forceσis 295 ± 100 kPa in study
popu-lation. These parameters can only be simulated and not directly measured from image sequences or clinical data.
S4 Fig. Correlation between measured cardiac values from cMRI and computed ones. A)x: computed LV-EF, y: measured LV-EF from cMRI. The distribution of both plotted variables is respectively drawn as box plot.B)x: computed LV-SV, y: measured LV-SV from cMRI. (TIF)
S5 Fig. Computed heart models for prediction of CRT therapy. A)Computed ECG trace (thick blue line) overlaid on measured ECG trace before CRT implantation. As one can see, the model was able to capture the main features of the ECG trace precisely. It should be noted that it was not in the scope to capture T-wave morphology (see text for details).B)Position of the CRT leads (in green) placed on the model according to lead positions derived from orthogonal chest x-rays.C)Observed and predicted (thick blue line) ECG traces for three tested stimula-tion protocols. The model was able to qualitatively predict EP CRT response.
(TIF)
S1 File. Table A in S1 File.Default Windkessel parameter values used when pressure data was not available, see text for details.Table B in S1 File.Parameters estimated using the multi-scale heart model.Table C in S1 File.Observed and predicted ECG parameters for different CRT protocols.
(DOC)
Author Contributions
Conceived and designed the experiments: EK TM FS-H. Performed the experiments: TM DN BG PS AK SB DM EZ. Analyzed the data: EK TM FS-H AA JH KSF MI AK. Contributed reagents/materials/analysis tools: HAK DC BM EW VK. Wrote the paper: EK FS-H HAK BM.
References
1. Moat NE, Ludman P, de Belder MA, Bridgewater B, Cunningham AD, Young CP, et al. Long-term out-comes after transcatheter aortic valve implantation in high-risk patients with severe aortic stenosis: the U.K. TAVI (United Kingdom Transcatheter Aortic Valve Implantation) Registry. J Am Coll Cardiol. 2011; 58(20):2130–8. doi:10.1016/j.jacc.2011.08.050PMID:22019110.
2. Ackerman MJ, Priori SG, Willems S, Berul C, Brugada R, Calkins H, et al. HRS/EHRA expert consen-sus statement on the state of genetic testing for the channelopathies and cardiomyopathies: this docu-ment was developed as a partnership between the Heart Rhythm Society (HRS) and the European Heart Rhythm Association (EHRA). Europace: European pacing, arrhythmias, and cardiac electrophys-iology: journal of the working groups on cardiac pacing, arrhythmias, and cardiac cellular electrophysi-ology of the European Society of Cardielectrophysi-ology. 2011; 13(8):1077–109. doi:10.1093/europace/eur245
PMID:21810866.
3. McMurray JJ, Adamopoulos S, Anker SD, Auricchio A, Bohm M, Dickstein K, et al. ESC guidelines for the diagnosis and treatment of acute and chronic heart failure 2012: The Task Force for the Diagnosis and Treatment of Acute and Chronic Heart Failure 2012 of the European Society of Cardiology. Devel-oped in collaboration with the Heart Failure Association (HFA) of the ESC. Eur J Heart Fail. 2012; 14(8):803–69. doi:10.1093/eurjhf/hfs105PMID:22828712.
4. Vogel B, Keller A, Frese KS, Leidinger P, Sedaghat-Hamedani F, Kayvanpour E, et al. Multivariate miRNA signatures as biomarkers for non-ischaemic systolic heart failure. European heart journal. 2013; 34(36):2812–22. doi:10.1093/eurheartj/eht256PMID:23864135.
5. Trayanova NA. Whole-heart modeling: applications to cardiac electrophysiology and electromechanics. Circulation research. 2011; 108(1):113–28. doi:10.1161/CIRCRESAHA.110.223610PMID:21212393;
PubMed Central PMCID: PMC3031963.
6. Hunter PJ, Borg TK. Integration from proteins to organs: the Physiome Project. Nature reviews Molecu-lar cell biology. 2003; 4(3):237–43. PMID:12612642.
7. Tobon-Gomez C, Duchateau N, Sebastian R, Marchesseau S, Camara O, Donal E, et al. Understand-ing the mechanisms amenable to CRT response: from pre-operative multimodal image data to patient-specific computational models. Medical & biological engineering & computing. 2013; 51(11):1235–50.
8. Land S, Niederer SA, Louch WE, Sejersted OM, Smith NP. Integrating multi-scale data to create a vir-tual physiological mouse heart. Interface focus. 2013; 3(2):20120076. doi:10.1098/rsfs.2012.0076 PMID:24427525; PubMed Central PMCID: PMC3638477.
9. Niederer SA, Smith NP. An improved numerical method for strong coupling of excitation and contrac-tion models in the heart. Progress in biophysics and molecular biology. 2008; 96(1–3):90–111. doi:10. 1016/j.pbiomolbio.2007.08.001PMID:17881038.
10. Campbell SG, McCulloch AD. Multi-scale computational models of familial hypertrophic cardiomyopa-thy: genotype to phenotype. Journal of the Royal Society, Interface / the Royal Society. 2011; 8(64): 1550–61. doi:10.1098/rsif.2011.0184PMID:21831889; PubMed Central PMCID: PMC3177620.
11. Marchesseau S, Delingette H, Sermesant M, Ayache N. Fast parameter calibration of a cardiac electro-mechanical model from medical images based on the unscented transform. Biomechanics and model-ing in mechanobiology. 2013; 12(4):815–31. doi:10.1007/s10237-012-0446-zPMID:23064992.
12. Kerckhoffs RC, Lumens J, Vernooy K, Omens JH, Mulligan LJ, Delhaas T, et al. Cardiac resynchroniza-tion: insight from experimental and computational models. Progress in biophysics and molecular biol-ogy. 2008; 97(2–3):543–61. doi:10.1016/j.pbiomolbio.2008.02.024PMID:18417196; PubMed Central
PMCID: PMC2676869.
13. Arts T, Reneman RS, Veenstra PC. A model of the mechanics of the left ventricle. Annals of biomedical engineering. 1979; 7(3–4):299–318. PMID:547767.
14. Sermesant M, Chabiniok R, Chinchapatnam P, Mansi T, Billet F, Moireau P, et al. Patient-specific elec-tromechanical models of the heart for the prediction of pacing acute effects in CRT: a preliminary clini-cal validation. Mediclini-cal image analysis. 2012; 16(1):201–15. doi:10.1016/j.media.2011.07.003PMID: 21920797.
15. Relan J, Chinchapatnam P, Sermesant M, Rhode K, Ginks M, Delingette H, et al. Coupled personaliza-tion of cardiac electrophysiology models for predicpersonaliza-tion of ischaemic ventricular tachycardia. PMID: Interface focus. 2011; 1(3):396–407. doi:10.1098/rsfs.2010.0041PMID:22670209; PubMed Central
PMCID: PMC3262447.
16. Nordsletten DA, Niederer SA, Nash MP, Hunter PJ, Smith NP. Coupling multi-physics models to car-diac mechanics. Progress in biophysics and molecular biology. 2011; 104(1–3):77–88. doi:10.1016/j. pbiomolbio.2009.11.001PMID:19917304.
17. Baillargeon B, Rebelo N, Fox DD, Taylor RL, Kuhl E. The Living Heart Project: A robust and integrative simulator for human heart function. European journal of mechanics A, Solids. 2014; 48:38–47. doi:10. 1016/j.euromechsol.2014.04.001PMID:25267880; PubMed Central PMCID: PMC4175454. 18. Potse M, Krause D, Kroon W, Murzilli R, Muzzarelli S, Regoli F, et al. Patient-specific modelling of
car-diac electrophysiology in heart-failure patients. Europace: European pacing, arrhythmias, and carcar-diac electrophysiology: journal of the working groups on cardiac pacing, arrhythmias, and cardiac cellular electrophysiology of the European Society of Cardiology. 2014; 16 Suppl 4:iv56–iv61. doi:10.1093/ europace/euu257PMID:25362171; PubMed Central PMCID: PMC4217520.
19. Huntjens PR, Walmsley J, Ploux S, Bordachar P, Prinzen FW, Delhaas T, et al. Influence of left ventric-ular lead position relative to scar location on response to cardiac resynchronization therapy: a model study. Europace: European pacing, arrhythmias, and cardiac electrophysiology: journal of the working groups on cardiac pacing, arrhythmias, and cardiac cellular electrophysiology of the European Society of Cardiology. 2014; 16 Suppl 4:iv62–iv8. doi:10.1093/europace/euu231PMID:25362172.
20. Ashikaga H, Arevalo H, Vadakkumpadan F, Blake RC 3rd, Bayer JD, Nazarian S, et al. Feasibility of image-based simulation to estimate ablation target in human ventricular arrhythmia. Heart rhythm: the official journal of the Heart Rhythm Society. 2013; 10(8):1109–16. doi:10.1016/j.hrthm.2013.04.015
PMID:23608593; PubMed Central PMCID: PMC3735782.
21. Ng J, Jacobson JT, Ng JK, Gordon D, Lee DC, Carr JC, et al. Virtual electrophysiological study in a 3-dimensional cardiac magnetic resonance imaging model of porcine myocardial infarction. J Am Coll Cardiol. 2012; 60(5):423–30. doi:10.1016/j.jacc.2012.03.029PMID:22633654; PubMed Central
PMCID: PMC3407287.
22. Zettinig O, Mansi T, Neumann D, Georgescu B, Rapaka S, Seegerer P, et al. Data-driven estimation of cardiac electrical diffusivity from 12-lead ECG signals. Medical image analysis. 2014; 18(8):1361–76.
doi:10.1016/j.media.2014.04.011PMID:24857832.
23. Kerckhoffs RC, Neal ML, Gu Q, Bassingthwaighte JB, Omens JH, McCulloch AD. Coupling of a 3D finite element model of cardiac ventricular mechanics to lumped systems models of the systemic and pulmonic circulation. Annals of biomedical engineering. 2007; 35(1):1–18. doi: 10.1007/s10439-006-9212-7PMID:17111210; PubMed Central PMCID: PMC2872168.
25. Wallman M, Smith NP, Rodriguez B. Computational methods to reduce uncertainty in the estimation of cardiac conduction properties from electroanatomical recordings. Medical image analysis. 2014; 18(1): 228–40. doi:10.1016/j.media.2013.10.006PMID:24247034.
26. Kuijpers NH, Hermeling E, Bovendeerd PH, Delhaas T, Prinzen FW. Modeling cardiac electromecha-nics and mechanoelectrical coupling in dyssynchronous and failing hearts: insight from adaptive com-puter models. Journal of cardiovascular translational research. 2012; 5(2):159–69. doi:10.1007/ s12265-012-9346-yPMID:22271009; PubMed Central PMCID: PMC3294221.
27. Niederer SA, Plank G, Chinchapatnam P, Ginks M, Lamata P, Rhode KS, et al. Length-dependent ten-sion in the failing heart and the efficacy of cardiac resynchronization therapy. Cardiovascular research. 2011; 89(2):336–43. doi:10.1093/cvr/cvq318PMID:20952413.
28. Sermesant M, Peyrat JM, Chinchapatnam P, Billet F, Mansi T, Rhode K, et al. Toward patient-specific myocardial models of the heart. Heart failure clinics. 2008; 4(3):289–301. doi:10.1016/j.hfc.2008.02. 014PMID:18598981.
29. Krishnamurthy A, Villongco CT, Chuang J, Frank LR, Nigam V, Belezzuoli E, et al. Patient-Specific Models of Cardiac Biomechanics. Journal of computational physics. 2013; 244:4–21. doi:10.1016/j. jcp.2012.09.015PMID:23729839; PubMed Central PMCID: PMC3667962.
30. Nielsen PM, Le Grice IJ, Smaill BH, Hunter PJ. Mathematical model of geometry and fibrous structure of the heart. The American journal of physiology. 1991; 260(4 Pt 2):H1365–78. PMID:2012234.
31. Neumann D, M T, Grbic S, Voigt I, Georgescu B, Kayvanpour E, Amr A, Sedaghat-Hamedani F, Haas J, Katus HA, Meder B, Hornegger J, Kamen A, Comaniciu D. Automatic image-to-model framework for patient-specific electromechanical modeling of the heart. Biomedical Imaging (ISBI), 2014 IEEE 11th International Symposium 2014. p. pp. 935–8.
32. Zheng Y, Barbu A, Georgescu B, Scheuering M, Comaniciu D. Four-chamber heart modeling and auto-matic segmentation for 3-D cardiac CT volumes using marginal space learning and steerable features. IEEE transactions on medical imaging. 2008; 27(11):1668–81. doi:10.1109/TMI.2008.2004421PMID: 18955181.
33. Zettinig O, M T, Georgescu B, Rapaka S, Kamen A, Haas J, Karen S.F, Sedaghat-Hamedani F, Kay-vanpour E, Amr A, Hardt S, Mereles D, Steen H, Keller A, Katus HA, Meder B, Navab N, Comaniciu D. From medical images to fast computational models of heart electromechanics: an integrated framework towards clinical use. Functional Imaging and Modeling of the Heart. 2013:pp. 249–58. Springer Berlin
Heidelberg.
34. Guetter Ch H X, Chefd'hotel C, Guehring J. Efficient symmetric and inverse-consistent deformable reg-istration through interleaved optimization in Biomedical Imaging: From Nano to Macro. IEEE Interna-tional Symposium 2011. p. 590–3.
35. Mitchell CC S D. A two-current model for the dynamics of cardiac membrane. Bulletin of mathematical biology. 2003:767–93. PMID:12909250
36. Ten Tusscher KH, Noble D, Noble PJ, Panfilov AV. A model for human ventricular tissue. American journal of physiology Heart and circulatory physiology. 2004; 286(4):H1573–89. doi:10.1152/ajpheart. 00794.2003PMID:14656705.
37. Rapaka S, Mansi T, Georgescu B, Pop M, Wright GA, Kamen A, et al. LBM-EP: Lattice-Boltzmann method for fast cardiac electrophysiology simulation from 3D images. Medical image computing and computer-assisted intervention: MICCAI International Conference on Medical Image Computing and Computer-Assisted Intervention. 2012; 15(Pt 2):33–40. PMID:23286029.
38. Georgescu B RS, Mansi T, Zettinig O, Kamen A, Comaniciu D. Towards real-time cardiac electrophysi-ology computations using gp-gpu lattice-boltzmann method. High-Performance Computing, a 2013 MICCAI Workshop2013.
39. Seegerer P, Mansi T, Jolly M-P, Neumann D, Georgescu B, Kamen A, et al. Estimation of Regional Electrical Properties of the Heart from 12-Lead ECG and Images. Statistical Atlases and Computational Models of the Heart-Imaging and Modelling Challenges: Springer; 2015. p. 204–12.
40. Powell MJ. The NEWUOA software for unconstrained optimization without derivatives. Large-scale nonlinear optimization: Springer; 2006. p. 255–97.
41. Comas O T Z, Allard J, Ourselin S, Cotin S, Passenger J. Efficient nonlinear FEM for soft tissue model-ling and its GPU implementation within the open source framework SOFA. Biomedical Simulation, Springer Berlin Heidelberg. 2008:pp. 28–39.
42. Sermesant A DH, Ayache N. An electromechanical model of the heart for image analysis and simula-tion. IEEE transactions on medical imaging. 2006; 25(5):612–25. doi:10.1109/Tmi.2006.872746
WOS:000237214000009. PMID:16689265
44. Segers P, Rietzschel ER, De Buyzere ML, Stergiopulos N, Westerhof N, Van Bortel LM, et al. Three-and four-element Windkessel models: assessment of their fitting performance in a large cohort of healthy middle-aged individuals. Proceedings of the Institution of Mechanical Engineers Part H, Journal of engineering in medicine. 2008; 222(4):417–28. PMID:18595354.
45. Allard J C S, Faure F, Bensoussan PJ, Poyer F, Duriez Ch, Delingette H, Grisoni L. Sofa-an open source framework for medical simulation. In Medicine Meets Virtual Reality, MMVR 15. 2007. 46. Konukoglu E, Relan J, Cilingir U, Menze BH, Chinchapatnam P, Jadidi A, et al. Efficient probabilistic
model personalization integrating uncertainty on data and parameters: Application to eikonal-diffusion models in cardiac electrophysiology. Progress in biophysics and molecular biology. 2011; 107(1): 134–46. doi:10.1016/j.pbiomolbio.2011.07.002PMID:21763715.
47. Cootes TF T C, Cooper DH, Graha J. Active Shape Models-Their Training and Application. Comp Vis Image Unders. 1995; 61(1):39–59.
48. Levy WC, Mozaffarian D, Linker DT, Sutradhar SC, Anker SD, Cropp AB, et al. The Seattle Heart Fail-ure Model: prediction of survival in heart failFail-ure. Circulation. 2006; 113(11):1424–33. PMID:16534009.
49. Lecoq G, Leclercq C, Leray E, Crocq C, Alonso C, de Place C, et al. Clinical and electrocardiographic predictors of a positive response to cardiac resynchronization therapy in advanced heart failure. Euro-pean heart journal. 2005; 26(11):1094–100. doi:10.1093/eurheartj/ehi146PMID:15728648.
50. Mollema SA, Bleeker GB, van der Wall EE, Schalij MJ, Bax JJ. Usefulness of QRS duration to predict response to cardiac resynchronization therapy in patients with end-stage heart failure. The American journal of cardiology. 2007; 100(11):1665–70. doi:10.1016/j.amjcard.2007.06.071PMID:18036366.
51. Dye C, Boerma T., Evans D., Harries A., Lienhardt Ch., McManus J., Pang T., Terry R., Zachariah R. Research for Universal Health Coverage 2013.
52. Zhou L, Solhjoo S, Millare B, Plank G, Abraham MR, Cortassa S, et al. Effects of regional mitochondrial depolarization on electrical propagation: implications for arrhythmogenesis. Circulation Arrhythmia and electrophysiology. 2014; 7(1):143–51. doi:10.1161/CIRCEP.113.000600PMID:24382411; PubMed
Central PMCID: PMC4001739.
53. Marchesseau S, Delingette H, Sermesant M, Cabrera-Lozoya R, Tobon-Gomez C, Moireau P, et al. Personalization of a cardiac electromechanical model using reduced order unscented Kalman filtering from regional volumes. Medical image analysis. 2013; 17(7):816–29. doi:10.1016/j.media.2013.04.012
PMID:23707227.
54. Neumann D, Mansi T, Georgescu B, Kamen A, Kayvanpour E, Amr A, et al. Robust image-based esti-mation of cardiac tissue parameters and their uncertainty from noisy data. Medical image computing and computer-assisted intervention: MICCAI International Conference on Medical Image Computing and Computer-Assisted Intervention. 2014; 17(Pt 2):9–16. PMID:25485357.
55. Boulakia M C S, Fernández MA, Gerbeau JF, Zemzemi N Mathematical modeling of electrocardio-grams: a numerical study. Annals of biomedical engineering. 2010; 38(3):1071–97. doi:10.1007/ s10439-009-9873-0PMID:20033779