Case Report
Major Article
http://dx.doi.org/10.1590/0037-8682-0070-2012INTRODUCTION
Address to: Dra. Poliana Barbosa Sampaio. Rua Maria Eleonora Pereira 605/302
Bl15 Ed: Fênix II, Jardim da Penha, 2906-0180 Vitória, ES, Brasil.
Phone: 55 27 8153-3565
e-mail: [email protected] Received: 11 December 2012 Accepted: 22 May 2013
Spa tial distribution of leprosy in areas of risk in Vitória,
State of Espírito Santo, Brazil, 2005 to 2009
Poliane Barbosa Sampaio
[1], Elizabeth Santos Madeira
[2], Lúcia Diniz
[3],
Ethel Leonor Noia
[1]and
Eliana Zandonade
[1][1]. Programa de Pós Graduação em Saúde Coletiva, Universidade Federal do Espírito Santo, Vitória, ES. [2]. Curso de Medicina, Faculdade Univix, Vitória, ES. [3]. Departamento de Clínica Médica, Universidade Federal do Espírito Santo, Vitória, ES.
ABSTRACT
Introduction: Leprosy remains a relevant public health issue in Brazil. The objective of this study was to analyze the spatial
distribution of new cases of leprosy and to detect areas with higher risks of disease in the City of Vitória. Methods: The study was
ecologically based on the spatial distribution of leprosy in the City of Vitória, State of Espírito Santo between 2005 and 2009. The data sources used came from the available records of the State Health Secretary of Espírito Santo. A global and local empirical
Bayesian method was used in the spatial analysis to produce a leprosy risk estimation, and the fl uctuation effect was smoothed from the detection coeffi cients. Results: The study used thematic maps to illustrate that leprosy is distributed heterogeneously
between the neighborhoods and that it is possible to identify areas with high risk of disease. The Pearson correlation coeffi cient of 0.926 (p = 0.001) for the Local Method indicated highly correlated coeffi cients. The Moran index was calculated to evaluate
correlations between the incidences of adjoining districts. Conclusions: We identifi ed the spatial contexts in which there were
the highest incidence rates of leprosy in Vitória during the studied period. The results contribute to the knowledge of the spatial distribution of leprosy in the City of Vitória, which can help establish more cost-effective control strategies because they indicate
specifi c regions and priority planning activities that can interfere with the transmission chain. Keywords: Leprosy. Epidemiology. Spatial distribution.
Leprosy is an infectious disease caused by the bacillus Mycobacterium leprae, which can affect both sexes and all
ages1. According to the World Health Organization (WHO),
228,474 new cases of the disease were detected worldwide in
2010, constituting a signifi cant public health problem. Brazil is
included among the seven countries with the highest numbers of
leprosy cases, with 34,894 new cases of the disease in 20102,3.
The State of Espirito Santo, as in the rest of Brazil, showed a declining trend of leprosy in recent years, but the level of endemicity is higher than the average in the Southeast Region of the country. In 2010, the prevalence rate of leprosy in the State was 2.82 cases per 10,000 inhabitants, placing Espírito Santo as the state with the highest prevalence of the disease in
the Southeast Region4,5.
The City of Vitória, the capital of Espírito Santo, has been described as an area of very high endemic disease (22.80 cases
per 100,000 people in 2009) according to Ministry parameters6.
The detection of new leprosy cases has signifi cantly increased,
qualifying the State for the priority disease control program. In the area of health research, the spatial distribution approach is gaining prominence due to the use of maps for
representing spatial events, which is useful to prevent artifi cial
fragmentation of the studied region by applying political and administrative criteria. Furthermore, spatial statistical techniques have improved our understanding of spatial dependents and the
occurrence of diseases7.
To observe possible areas to be prioritized in planning actions for the prevention and control of leprosy, an important
tool, the Geographic Information System (GIS),is used 8.
Thus, the aim of this study was to analyze the spatial distribution of new cases of leprosy, thereby detecting areas of increased risk of disease in the City of Vitória (Espírito Santo, Brazil).
METHODS
Between the years of 2005 and 2009, an ecological study of secondary data was performed in Vitória. The city is the capital of the State of Espírito Santo and is divided into an island section, the birthplace of the city and a continental section of recent growth. Its population is 320,156 inhabitants in an area of 104.3 square kilometers, and it is divided into 78 districts,
TABLE 1 - New cases of leprosy per year and the detection coeffi cients in Vitória, State of Espírito Santo, Brazil, 2005-2009.
General coeffi cient
Year Population New cases of detection
2005 313,309 94 29.99
2006 317,083 63 19.86
2007 320,822 72 22.93
2008 317,817 77 24.23
2009 320,153 73 22.80
Source: SINAN: Information System for Notifi able Diseases. Population data were obtained from the Brazilian Institute of
Geography and Statistics (IBGE), and the cartographic base was provided by Geo-Foundations, through the Treasury Department of the City of Vitória.
The calculation of incidence rates was performed by dividing the sum of new leprosy cases according to neighborhood by the sum of the population between the years 2005 to 2009; the result was then multiplied by 100,000 to adopt the Health
Surveillance System/Ministry of Health SVS/MS11. Both the
crude incidence rate and the data tabulation of SINAN were performed in a Microsoft Excel spreadsheet.
The Local Empiric Bayesian model (LEBayes) was used for the spatial analysis of data, thus mitigating the effects
of random fl uctuation in detection rates resulting from the
calculation of rates for small areas. This procedure uses the estimation of constructed spatial averages, with the criterion of neighborhood adjacency condition between neighborhoods
as geographical units12.
The Pearson correlation coeffi cient and scatter plots were
used to evaluate the correlation between results of detection
of coeffi cients, the estimated gross average and the Bayesian
averages calculated by the Bayesian method.
The behavior of the spatial distribution of leprosy when the neighborhoods of Vitória City, State of Espírito Santo are considered can express the existence of dependence between the incidence rates of new cases. To complement studies of spatial autocorrelation between rates, the local Moran index
(LISA) was calculated, and when the signifi cance values were
less than 0.05, regions with spatial structures of leprosy onset
were indicated13.
The WHO has defi ned parameters for the detection rates of
leprosy to categorize the levels of endemicity of the disease:
areas are hyperendemic when their coeffi cient is greater than
40.00 cases per 100,000 inhabitants, very high with 20.00 to 39.99 cases per 100,000 inhabitants, high with 10.00 to 19.99 cases per 100,000 inhabitants, average with 2.00 to 9.99 cases per 100,000 inhabitants and low when the endemicity of the
disease is lower than 2.00 cases per 100,000 inhabitants6,14.
Statistical analyses of risk population and its neighborhood were performed using Terra View 4.0.0 free software (http:// www.dpi.inpe.br/terraview/index.php).
Ethical considerations
Regarding ethical aspects, it is important to emphasize that the entire research process was conducted according to
it was still classifi ed as very high6.
Using the Ministry of Health parameters for the classifi cation
level of endemicity, the distribution of the mean detection rates of leprosy was analyzed by neighborhood. The results indicated
that 18 (22.2%) were classifi ed as hyperendemic and 20 (24.7%)
as very high endemic; 9 (11.1%) were of average endemicity, and other districts presented low endemicity.
Figure 1 shows the spatial distribution of the raw detection
coeffi cient (A) adjusted by the Local Method (B) and the Global
Method (C) for leprosy. The thematic map indicated areas with
greater disease severity that exhibited signifi cant growth in
detection rates, which ranged from low to hyperendemic. With the Local Method, it is possible to observe that by smoothing the neighborhood of each district, a concentration of cases that arose increased from low to medium for neighborhoods with high detection rates, thus highlighting foci with greater case occurrences. The Global Method highlighted neighborhoods that went from areas of low concentration to areas with medium and high detection rates. It is also worth noting that some neighborhoods went from hyperendemic to
areas with high detection rates. (Figure 1)
Figure 2A and B show the scatter plots for the crude
coeffi cients and the adjusted coeffi cients by the Local and Global Ebest methods, respectively. The Pearson correlation
coeffi cients were 0.926 (p = 0.001) for the Local method and 0.981 (p = 0.001) for the Global method, which indicated that
Detection coefficients, Ministry of Health 2009
Low Medium High Very high Hyper-edemic
Meters
0 2,000 4,000 6,000
FIGURE 1 - Map of the average coeffi cients of detection of leprosy cases in Vitória, State of Espírito Santo, Brazil, 2005-2009. A: raw coeffi cient; B: adjusted
coeffi cient using the Local Ebest method; C: adjusted coeffi cient using the Global Ebest method.
250.0 250.0
200.0 200.0
150.0 150.0
100.0 100.0
50.0 50.0
0.0 0.0
0.0 50.0 100.0 150.0 200.0 250.0 0.0 50.0 100.0 150.0 200.0 250.0
Adjusted coef
ficient by the Ebest Local
method
Adjusted coef
ficient by the Ebest
Global metho
d
Gross coefficient Gross coefficient
FIGURE 2 - Scatter diagram of the average coeffi cients of detection of leprosy cases in Vitória, State of Espírito Santo, Brazil, 2005-2009, between gross coeffi cients. A: Adjusted coeffi cient by the Local Ebest method; B: Adjusted coeffi cient by the Global Ebest method.
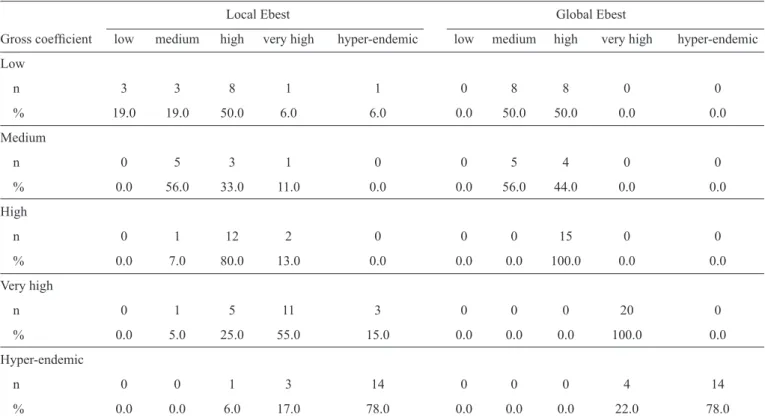
Table 2 presents the detection coefficient parameters (hyperendemic and very high, high, medium and low endemicity), comparing the gross value with values estimated by the Bayesian Local and Global methods for the 78 districts studied.
The results for the Local method showed that 45 districts
maintained their original classifi cations, 22 neighborhoods
changed classifi cations to higher endemicity, and 11 districts moved to a lower endemicity.
The results for the Global method showed that 54 districts maintained their original classifi cations, 20 districts changed their classifi cations to higher endemicity, and four moved to lower endemicity. These results suggest that neighborhoods that showed changes in classifi cation had a tendency to increase the detection rate.
Using the Bayesian method, it was possible to observe that the region located in San Pedro Bay, northwest of Vitória, consists of 10 districts and shows a greater spatial concentration
A
B
C
% 0.0 56.0 33.0 11.0 0.0 0.0 56.0 44.0 0.0 0.0
High
n 0 1 12 2 0 0 0 15 0 0
% 0.0 7.0 80.0 13.0 0.0 0.0 0.0 100.0 0.0 0.0
Very high
n 0 1 5 11 3 0 0 0 20 0
% 0.0 5.0 25.0 55.0 15.0 0.0 0.0 0.0 100.0 0.0
Hyper-endemic
n 0 0 1 3 14 0 0 0 4 14
% 0.0 0.0 6.0 17.0 78.0 0.0 0.0 0.0 22.0 78.0
of leprosy cases. There is also a greater concentration of cases in the north of the county and in the Continental Region, which consists of 14 districts. Spatial analysis shows that this region has areas with greater disease severity but with differences in the distribution of leprosy cases among districts; a higher concentration was observed in the Jabour district.
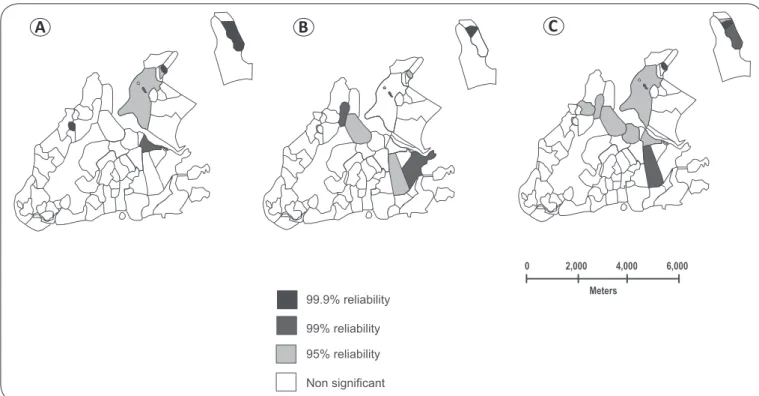
Once the existence of spatial dependence between rates was detected, the study investigated the incidence of local and differentiated regimes of disease occurrence. To accomplish this, the local Moran index (LISA) was used, which provides correlation
values for each of the units under study (Figures 3A, B and C).
Figure 3B highlights the cities with estimated incidence rates that were statistically correlated (p <0.005) with the existing correlation in their neighbors, as calculated by LISA (local spatial analysis).
Values greater than 95% are identifi ed by the dependence
in relation to the rates observed in areas of bordering
neighborhoods. Figure 3 shows the classifi cation of these
regions as high- and low-risk, with an average city as the
parameter. Regarding Figure 3C, high-risk areas are observed
in the north of the county, in the region that corresponds to the Continental Health Region and to the west of the Maruipe Health Region. In other regions, there is low risk for leprosy.
DISCUSSION
Ecological studies have been widely used in the area of
health research15,16. In the case of leprosy, spatial analysis is
an important tool that provides information about the spatial
structure and dynamics of the disease, which is the fi rst step in characterizing a health status.
The study confi rmed the magnitude of disease in the City of Vitória, demonstrating that it is an area with very high leprosy endemicity and showing that a considerable portion of the population is exposed to the disease.
The Empirical Bayesian method enabled the construction of maps with fixed coefficients. The Local Ebest method considers district detection according to the average of its neighborhood, and the Global Ebest method uses the city average for corrections. Using these methods, it was possible to observe areas with greater leprosy intensity and thus provide support for disease control strategies.
The fi ndings in this study indicate high detection rates of leprosy, i.e., high risks for the disease, in the northern and western parts of the city, corresponding to the Continental and Maruipe Health Regions, respectively. Those regions that are at high risk for leprosy may be contributing to the appearance of new cases in areas with low detection rates.
The International Federation of Anti-Leprosy Association (ILEP) considers detection rates to be the best indicators of leprosy transmission, and one of the factors that infl uence its increase is the organization of health services. The increase in detection rates can be analyzed from two perspectives: the fi rst
refl ects the active transmission of leprosy, which generates new cases in the area; the second refl ects the possible existence of hidden prevalence17.
Non significant 95% reliability 99% reliability
99.9% reliability Meters
0 2,000 4,000 6,000
FIGURE 3 - Map of the Moran spatial correlation of the City of Vitória, State of Espírito Santo, Brazil, according to the detection of leprosy clusters, 2005 to
2009: A: raw coeffi cient; B: Adjusted coeffi cient using the Local Ebest method; C: adjusted coeffi cient using the Global Ebest method.
Bayesian method. The long and insidious clinical evolution of leprosy produces a delayed diagnosis, resulting in possible hidden prevalence, i.e., the accumulation of undetected cases. Therefore, the distribution of cases in region II with low detection rate is considered as worrisome as the neighborhoods with high detection rate.
The distribution of leprosy in areas of the county has been characterized as quite heterogeneous, as was demonstrated
in other regions in Brazil5,18-20. Imbiriba et al.21 evaluated the
epidemiology of leprosy and living conditions in Manaus State of Amazonas between 1998 and 2004 using the spatial
distribution by census tract and identifi ed sectors with an average
detection rate that ranged from 0.66 to 24.60 cases per 10,000 inhabitants, thus revealing an inequality and clustering of cases characterized by the spatial organization of leprosy.
The dynamics of the disease in Vitória resemble the
worldwide pattern, showing high rates in poorer regions6,22. This
fi nding is agrees with that of Bakker et al.23 who evaluated the
risk factors for the development of leprosy in Indonesia and, in a study of a population-based cohort, demonstrated an important association between poverty and vulnerability to leprosy.
The work of Madeira24 attempted to identify urban areas/
regions at the greatest risk for transmission of leprosy in Vitória using the method of spatial analysis for points of occurrence, noting that the areas of highest endemicity were located in areas with low socioeconomic conditions. A study by Wood became a geographical reference for leprosy cases registered between 2003 and 2005 and used territories to present a distribution of cases with higher concentrations in the region of Sao Pedro, the Northwest Region and the North
Region, along with the Continental Region, as observed in this study.
Through spatial analysis, it was possible to identify areas at greatest risk for the transmission of leprosy. An area with a high disease incidence was the Continental area, located north of the Bay of Vitória, State of Espírito Santo, Brazil, particularly the Jabour neighborhood. This hyperendemic district has its origin in the early 70s; at the time, it was characterized as an immigrant neighborhood and was a neighborhood in which the City of Vitória deposited garbage. Only later did this neighborhood receive government investments for improving the social and urban infrastructure. Another distinctive area was the region of São Pedro, located in the northwest part of the city. This neighborhood was an area of recent immigration in the late 70s
and a place where families lived on stilts over the city landfi ll,
demonstrating the poverty in the region24,25.
These migratory spaces suggest the possibility that sick people or their contacts have moved to the area, which can be a current source of infection in these areas due to the long incubation
period of the disease. The fi ndings of the study indicate the need
to recognize the leprosy infection route to meet the challenges and implement measures in areas with high transmission rates.
The spatial distribution method used in the study enables the visualization of the processes of late urbanization in areas with the highest detection rates. It is also worth investigating the geographical relationships and the precarious living conditions of those sites that can generate consolidated foci of leprosy in regions with similar characteristics.
This study used a spatial distribution methodology to characterize the distribution of leprosy cases in Vitória; through
Despite the limitations of ecologic-type studies , in this
study, the construction of maps identifi ed changes that need
to be implemented in the health system and can guide public policies to control this disease.
The authors declare that there is no confl ict of interest.
CONFLICT OF INTEREST
FINANCIAL SUPPORT
REFERENCES
This study was fi nancially supported by
MCT/CNPq/CT-Health/MS/SCTIE DECIT number 034/2008. Additional studies to assist in interventions for the control of leprosy in the cluster municipalities No.4 (ES, BA and MG).
1. Vieira CSCA, Soares MT, Ribeiro CTSX, Silva LFG. Avaliação e controle de contatos faltosos de doentes com hanseníase. Rev Bras Enfer 2008; 61:682-688.
2. Bulletin of the World Health Organization (WHO). Number 36. Weekly Epidemiol Record 2011; 86:389-400.
3. Lobo JR, Barreto JCC, Alves LL, Crispim LC, Barreto LA, Duncan LR,
et al. Perfi l epidemiológico dos pacientes diagnosticados com hanseníase
através de exame de contato no município de Campos dos Goytacazes, RJ. Rev Bras Clin Med 2011; 9:283-287.
4. Secretaria do Estado de Saúde do Espírito Santo (Sesa). Relatório avaliação anual da hanseníase 2009. Vitória: Sesa; 2010.
5. Sampaio PB, Rossi TL, Cerutti Junior C, Zandonade E. Análise Espacial dos casos novos de hanseníase nos municípios do Estado do Espírito Santo, entre 2004 e 2009. Rev Soc Bras Med Trop 2012; 45:380-384.
6. Ministério da Saúde. Secretaria de Vigilância em Saúde. Programa Nacional de Controle da Hanseníase. Hanseníase no Brasil. Dados e Indicadores Selecionados. Brasília: Ministério da Saúde; 2009.
7. Opromolla PA, Dalben I, Cardim M. Análise da distribuição espacial da hanseníase no Estado de São Paulo, 1991-2002. Rev Bras Epidemiol 2009; 8:356-364.
2006.
12. Bailey TC, Gatrell AC. Interactive Spatial Data Analysis. Essex: Longman; 1995.
13. Anselin L. Local indicators of spatial Asssociation – LISA. Geogr Anal 1995; 27:93-115.
14. Ministério da Saúde. Brasil. Portaria nº 3.125, de 7 de outubro de 2010. Aprova as Diretrizes para Vigilância, Atenção e Controle da hanseníase.
Diário Ofi cial da Republica Federativa do Brasil. Brasília: Ministério
da Saúde; 2010.
15. Duarte-Cunha M, Souza-Santos R, Matos HJ, Oliveira MLW. Aspectos epidemiológicos da hanseníase: uma abordagem espacial. Cad Saude Publica 2012; 28:1143-1155.
16. Cury MRC, PaschoalVA, Nardi SMT, Chierotti AP, Rodrigues Júnior AL, Chiaravalloti-Neto F. Spatial analysis of leprosy incidence and associated socioeconomic factors. Rev Saude Publica 2012; 46:110-118.
17. International Leaders in Education Program. The interpretation of epidemiological indicators in leprosy [Internet]. Technical Bulletin; 2011. [Cited 2011 December 01]. Available from: www.ilep.org.uk/
fi leadmin/uplAoads/Documents/Technical_Bulletins/tb11eng.pdf.
18. Moreira MV, Waldman EA, Martins CL. Hanseníase no Estado do Espírito Santo, Brasil: uma endemia em ascensão?. Cad Saude Publica 2008; 24:1619-1630.
19. Villa TCS, Cunha TN, Santos CB. Distribuição espacial de doenças endêmicas no município de Ribeirão Preto (SP). Ciência e Saude Coletiva 2011; 16 (suppl I):1289-1294.
20. Amaral EP, Lana FCF. Análise espacial da Hanseníase na microrregião de Almenara, MG, Brasil. Rev Bras Enferm 2008; 61:S701-S707.
21. Imbiriba ENB, Silva Neto AL, Souza WV, Pedrosa V, Cunha MG, Garnelo L. Desigualdade Social, crescimento urbano e hanseníase em Manaus: abordagem espacial. Rev Saude Publica 2009; 43:656-665.
22. Declercq E. Leprosy statistics 2009: some thoughts. Lepr Rev 2011; 82:87-89.
23. Bakker MI , Hatta M , Kwenang A , Van Mosseveld P , Faber WR , Klatser PR, et al. Fatores de risco para o desenvolvimento de hanseníase - um estudo de coorte de base populacional na Indonésia. Lepr Rev 2006; 77:170.
24. Madeira ES. Os espaços de transmissão da hanseníase: domicílio, trabalho e relações de vizinhança. [Masters Dissertation].[Vitória]: Universidade Federal do Espírito Santo; 2006. 80p.