Arq Neuropsiquiatr 2009;67(2-B):428-431
428
EEG ALPHA PEAK FREQUENCY ANALYSIS
DURING MEMORIZING OF FIGURES IN PATIENTS
WITH MILD COGNITIVE IMPAIRMENT
Magali Taimo Schmidt
2, Renato Anghinah
2, Luis Fernando Basile
3,
Oreste Forlenza
1, Wagner Faride Gattaz
1Abstract – Objective: To investigate spectral analysis of electroencephalograms (EEG) for the alpha frequency band during rest and cognitive stimulation in healthy adults and individuals with mild cognitive impairment. Method: We analyzed 56 EEGs from 28 patients, 7 men and 21 women, 12 of whom (40%) were controls, 16 patients with mild cognitive impairment (60%). Ages ranged from 61 to 83 years. All individuals were patients in the Psycho-geriatric Out-patients Clinic of LIM-27, of the Psychiatric Institute of the Clinicas Hospital of the Faculty of Medicine of the University of São Paulo, IPq-HCFMUSP, between 2004 and 2007. Each patient underwent two exams with an interval of at least six months between them. During the exam, performed after a period of wakefulness and rest, the patients memorized series of pictures. Results: Analysis of spectral potential both at rest and during the memorizing task showed no statistical differences between baseline and final recordings. Conclusion: Spectral analysis of EEGs showed coherent results with the clinical stability of the patients evaluated but was unable to distinguish between the control group and patients with MCI. Future studies should include a larger sample and a longer follow up.
KEY WORDS: EEG, qEEG, memorization, mild cognitive impairment.
Análise do pico de frequência alfa do EEG durante a memorização de figuras em pacientes com comprometimento cognitivo leve
Resumo – Objetivo: Realizar a análise espectral da banda de frequência alfa do EEG em adultos saudáveis, com comprometimento cognitivo leve (CCL), durante o repouso e a estimulação cognitiva. Método: Analisamos 56 EEGs de 28 pacientes, 7 homens e 21 mulheres, 12 dos quais (40%) controles, 16 pacientes com CCL (60%), com idades entre 61 a 83 anos.Todos os pacientes foram atendidos no serviço de psicogeriatria do LIM 27, do Instituto de Psiquiatria da Faculdade de Medicina da USP,entre os anos de 2004 a 2007, sendo que cada paciente realizou 2 exames com intervalo de 6 meses entre eles. Os registros dos EEGs foram realizados em repouso e durante a realização de atividade de memorização de figuras. Resultados: A analise espectral durante o repouso e a tarefa de memorização não mostraram diferenças estatísticas entre os EEGs iniciais e finais. Conclusão: A análise espectral dos EEGs mostrou-se coerente com a estabilidade clínica dos dois grupos, no entanto não foi capaz de distinguir o grupo controle do grupo CCL. Estudos futuros deverão incluir um maior número de indivíduos por um tempo maior de seguimento.
PALAvRAS-CHAvE: EEG, EEG quantitativo, memorização, comprometimento cognitivo leve.
1LIM27 Psichiatry Institut Medicine School of University of São Paulo, São Paulo SP, Brazil; 2Reference Center of Behaveoral and Cognitive Disturbs of Clinics Hospital of Medicine School of University of São Paulo, São Paulo SP, Brazil; 3High-Resolution EEG Section,Neurosurgery of Medicine School of University of São Paulo, São Paulo SP, Brazil. This research was granted by FAPESP.
Received 10 December 2008, received in inal form 13 March 2009. Accepted 7 May 2009.
Dr. Renato Anghinah – Rua Itacolomi 333 / 83 - 01239-020 São Paulo SP - Brasil. E-mail: [email protected]
Over the last few years, different quantiication tech-niques using the EEG have proven useful in the study of cognitive processes1. According to the “Recommendations
for the recording/interpretation of topographical
Arq Neuropsiquiatr 2009;67(2-B)
429
Cognitive impairment EEG spectral analysis Schmidt et al.
the diagnosis remains unclear after initial clinical evalua-tion2. Corroborating these recommendations, the
Ameri-can Academy of Neurology and the AmeriAmeri-can Society of Clinical Neurophysiology advise the use of a quantitative method in clinical states of dementia in their guidelines for the application of the EEGq. These directives are based on evidence derived from one or more well designed clin-ical studies with control groups, cohort studies, expert opinions of specialists in the ield, and /or case reports3.
The most common indings are a slowing of baseline ce-rebral electrical activity, with predominance of delta and theta rhythms and a diminution or absence of the alpha rhythm. Nevertheless, these indings are more common in patients at moderate or advanced stages of the disease4-6.
Studies have shown that spectral analysis is a very sen-sitive method for detecting alterations in basal cerebral electrical activity, being particularly sensitive in cases with clinically suspected Alzheimer’s disease (AD)7,8. Among
studies that have used this technique/ type of analysis, sensitivity ranges between 71 and 81%. When results of spectral analysis are compared with neuropsychological tests; there is a strong correlation between the two9,10.
The objective of this study was to analyze alpha fre-quency band spectral peak during memorization tasks, and to verify if there were differences between healthy con-trols and individuals with mild cognitive impairment (MCI).
METHOD
This study was conducted within the High Resolution EEG Sector of the Neurosciences Laboratory, LIM-27, of the Psychi-atry Department of the Faculty of Medicine of the University of São Paulo.
A total of 30 individuals took part in the study, 7 of whom were men and 21 women: 12 controls (40%) and 16 patients with mild cognitive impairment (60%). Ages ranged from 61 to 83 years. All subjects underwent two recordings.
Patients or their legal representatives signed the terms of consent.
This study was approved by the Ethics Committee of the Clinicas Hospital of the University of São Paulo.
Quantitative recordings were performed with digital equip-ment) (32 channels, a 12 bit processor and a sampling frequency of 200 points per second), capable of performing quantitative recordings using Fast Fourier Transformation (FFT).
The placement of the scalp electrodes followed the state-ments of the Brazilian Clinical Neurophysiologic Society (system 10–20 with an ear reference for EEG recordings)11.
The electrical impedance of the electrodes was kept be-low 3 kOhms.
Stimuli and tasks
Both groups, after a 15-minute recording of the EEG in rest-ing state, the individual was asked to open their eyes and to pay
attention to 10 igures which were presented on a computer screen for 30 seconds. Following this, the individual was asked to close their eyes, and for the next 30 seconds, mentally re-view the igures which had just been displayed. (These periods of memorization were later analyzed). At the end of the 30 sec-onds we asked the person to state the igures they were able to recall. This task was repeated three consecutive times to serve as a learning period on the part of the individual tested. At the end of this irst task, another 10 minutes of recording under con-ditions of rest was carried out and then the second task given12. This consisted of presentation of 15 igures from the CERAD11, one by one with an exposure time of 5 seconds per igure. Akin to the irst test, after display of the 15 igures, a brief period of 30 seconds was allowed to memorize at rest before tallying the igures recalled. This part of the task was repeated 3 times.
Fig. 1. Table containing 10 igures.
Arq Neuropsiquiatr 2009;67(2-B)
430
Cognitive impairment EEG spectral analysis Schmidt et al.
Statistical analysis
The t test was performed to test the equality of the medians of the two groups of numbers (initial and inal clinical evaluation)
The higher the value of “t” above zero, the greater the dif-ference between the groups, whereas the lower the “p” value, the greater its signiicance.
We used a conidence interval of 95%. Across all analyses, the values of the differences between the medians was very close to 0, indicating that there was little or no difference be-tween the groups. We used software EMSA XP version 2.5.1 to run the t test.
RESULTS
During the study period, the diagnoses of 3 women changed from being control to MCI.
Distribution of the study group at primary diagnosis are showed in Table 1.
Distribution of the study group after the second diag-nosis are showed in Table 2.
Differences between two recordings peak of spectral analysis.
First recording: peak of spectral frequency (in Hz) at rest we can see in Table 3.
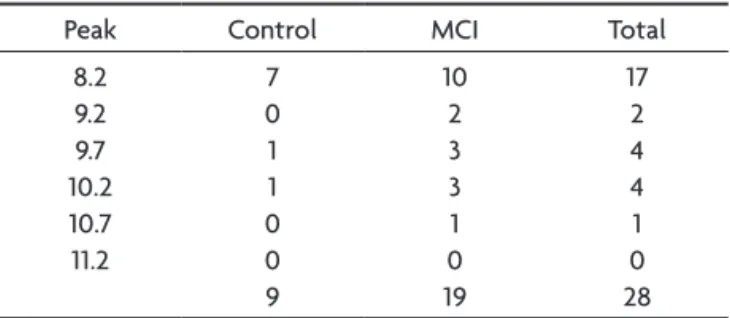
Final recordings: frequency peaks of the spectra at rest we can see in Table 4.
The t test showed: t=0.0416, df 3.999, p value 0.9688 (not signiicant), conidence interval of 95% (from –2.538643 to –2.615864).
The analysis of the peak spectra potential showed no differences between controls and patients with MCI, at either the irst or inal recording during memorizing of the igures.
Initial recordings: frequency peaks of the spectra dur-ing memorization task are showed in Table 5.
Second recordings: frequency spectral peaks during memorization task are showed in Table 6.
The t test showed: t=0.0416, df=3.999, p value=0.9688 (not signiicant), conidence interval of 95% (from –2.538643 to –2.615864).
DISCUSSION
The results obtained on the spectral potential, at rest and during memory task showed no statistical difference between the control group and those with MCI. Similar-ly, no differences were found between EEG initial and i-nal recordings.
No statistical differences were observed between the EEG initial and inal recordings in the two groups analyzed, as the subjects in the study were clinically stable. Three women were exceptions as they were classiied as con-trols at initial diagnosis and then as having MCI at the i-nal evaluation, were excluded at data ai-nalysis.
However, as the method used to analyze the
quantii-Table 1. Distribution of the study group at primary diagnosis.
Men Women Total
Controls MCI Dementia 2 4 1 7 10 12 1 23 12 16 2 30
Table 2. Distribution of the study group after the second diagnosis.
Men Women Total
Controls MCI Dementia 2 4 1 7 7 15 1 23 9 19 2 30
Table 3. First recording: peak of spectral frequency (in Hz) at rest.
Peak Control MCI Total
8.2 9.7 10.2 10.7 11.2 Total 9 1 1 1 0 12 9 3 4 0 0 16 18 4 5 1 0 28 MCI: mild cognitive impairment.
Table 4. Final recordings: frequency peaks of the spectra at rest.
Peak Control MCI Total
8.2 9.2 9.7 10.2 10.7 11.2 7 0 1 1 0 0 9 10 2 3 3 1 0 19 17 2 4 4 1 0 28 MCI: mild cognitive impairment.
Table 5. Initial recordings: frequency peaks (in Hz) of the spectra during memorization task.
Peak Control MCI Total
8.2 9.7 10.2 10.7 11.2 11.7 6 2 1 1 0 2 12 8 0 7 0 1 0 16 14 2 8 1 1 2 28
Table 6. Second recordings: frequency spectral peaks (in Hz) during memorization task.
Peak Control MCI Total
Arq Neuropsiquiatr 2009;67(2-B)
431
Cognitive impairment EEG spectral analysis Schmidt et al.
cation in this study was unable to differentiate between the control groups and the group with MCI, the diagnos-tic change in these three patients had no impact on the results obtained.
The conclusion of this study was that, for the sample group analyzed, the method of spectral analysis of EEGs showed results consistent with the clinical stability of the group evaluated, but was unable to differentiate the con-trol group from the MCI group.
Future studies should include a larger sample group and a longer follow up time.
REFERENCES
1. Rappelsberger P, Petsche H. Probability mapping: power and coherence analyses cognitive processes. Brain Topogr 1988; 1:46-53.
2. Luccas FJC, Anghinah R, Braga NIO, et al. Recomendações para
o registro / interpretação do mapeamento topográico do EEG
e potenciais evocados. Arq Neuropsiquiatr 1999;57:132-146.
3. Nuwer M R. Quantitative EEG analysis in clinical settings.
Brain Topogr 1996;8:201-208.
4. Silva DF, Lima MM, Anghinah R, Lima JGC. Mapeamento ce
-rebral. Neurociências 1995;3:11-18.
5. Babiloni C, Binetti G, Casseta E, Forno GD, Percio CD,Rossini
PM. Sources of cortical rhythms change as a function of cog-nitive impairment in pathological aging: a multicenter study. Clin Neurophysiol 2006;117:256-268.
6. Kwak YT. Quantitative EEG indings in different stages of AD.
J Clin Neurophysiol 2006;23:5.
7. Claus JJ, Strijers RLM, Jonkman EJ, et al. The diagnostic value
of eeg in mild senile Alzheimer’s disease. Clin Neurophysiol 1999;110:825-832.
8. Brenner RP, Reynolds CF, Ulrich RF. Diagnostic efficacy of
computerized spectral versus visual EEG analysis in elder
-ly normal, demented and depressed subjects. Electroenceph
-alogr Clin Neurophysiol 1988;69:110-117.
9. Anderer P, Saletu B, Klöppel B, Semlitsch HV, Werner H. Dis-crimination between demented patients and normals based
on topographic EEGslow wave activity: comparison between z statistics, discriminant analysis and artiicial neural network classifiers. Electroencephalogr Clin Neurophysiol 1994;91:
108-117.
10. Nitrini R, Caramelli P, Herrera Júnior E, et al. Performance of
illiterate and literate nondemented elderly subjects in two tests of long-term memory. J Int Neuropsychol Soc 2004;10:634-638.
11. Morris JC, Heyman A, Mohs RC, et al. The Consortium to Es
-tablish a Registry for Alzheimer’s Disease (CERAD). Part I.
Clinical and neuropsychological assessment of Alzheimer’s disease. Neurology 1989;39:1159-1165.
12. Luccas FJC, Braga NIO, Fonseca LC, Frochtengarten ML. Re-comendações para o registro e interpretação do mapeamento
topográico do eletrencefalograma (EEG) e potenciais evoca
-dos sensoriais (PES) parte I: aspectos gerais. Brazilian J Epi