ISSN 1980-5527
http://dx.doi.org/10.1590/198055272021 www.ie.ufrj.br/revista
www.scielo.br/rec
NOTA EXPLORATÓRIA SOBRE O CONSUMO
E A CLASSIFICAÇÃO SOCIOECONÔMICA
NO BRASIL BASEADA EM EVIDÊNCIAS DA
PESQUISA DE ORÇAMENTO FAMILIAR
Guilherme França dos Santos Paivaa
Denise Britz do Nascimento Silvab
Carmem Aparecida Feijóc
aAnalista Técnico de Políticas Sociais do Ministério do Desenvolvimento Social e Agrário (MDSA). bCoordenadora do Curso de Graduação em Estatística e Professora do Programa de Pós-Graduação em
População, Território e Estatísticas Públicas da Escola Nacional de Ciências Estatísticas (ENCE) do Instituto Brasileiro de Geografia e Estatística (IBGE).
cProfessora titular da Universidade Federal Fluminense (UFF).
Artigo recebido em 13/05/2015 e aprovado em 09/08/2016.
RESUMO: O objetivo desta nota é analisar diferentes critérios de estratificação utiliza‑ dos no Brasil, tendo em conta os perfis de família e considerando variáveis socioeconômi‑ cas, demográficas e de endividamento. Os diferentes perfis dos estratos socioeconômicos são gerados por dois critérios de estratificação nacionalmente conhecidos, com base nos dados das duas últimas edições da Pesquisa de Orçamento Familiar (2002/2003 e 2008/2009). Assim, é possível comparar o resultado dos distintos critérios de classificação e identificar características específicas das mudanças de padrão ao longo do tempo. O artigo confirma uma melhoria econômica de 2003 a 2009 para os indivíduos classificados no estrato socioeconômico mais baixo, juntamente com um aumento da renda média total e per capita, e um aumento de despesas. Por outro lado, também foram observadas redução do nível de poupança das famílias e elevação nos níveis de endividamento.
PALAVRAS-CHAVE: estratificação socioeconômica; orçamento familiar; renda fa‑ miliar; consumo; poupança; pesquisa de orçamento familiar.
CLASSIFICAÇÃO JEL: Z13; D31; D12.
EXPLORATORY NOTE ON CONSUMPTION
AND SOCIOECONOMIC CLASSIFICATION
IN BRAZIL BASED ON EVIDENCES FROM
THE FAMILY EXPENDITURE SURVEY
ABSTRACT: The present study aims at analysing different stratification criteria used in Brazil by market research companies and academia, taking into account family pro‑ files based on socioeconomic and demographic variables. It presents different strata profiles generated by two nationally well‑known stratification criteria based on survey data from the two last editions of the Brazilian Family Expenditure Survey (2002/2003 and 2008/2009)and it also provides evidence on patterns of change over time. The evidence corroborates that an economic improvement took place from 2003 to 2009 for those individuals classified in the lower socioeconomic stratum, together with an increase of total and per capita average income, and an increase of expenses. On the other hand, a visible reduction of savings for families in all economic strata and higher levels of household indebtedness was also noticed.
1. INTRODUCTION
Over the last two decades, better levels of family income and well‑being have been regis‑ tered in the Brazilian economy as the result of a well succeeded plan to stabilize prices, coupled with a set of government actions including income transfer programs, credit access to low income population, real gains in the minimum wage1, overdraft facilities, among other measures. Over the last 10 years, poverty has been reduced, indicating that a significant portion of the population has managed to move out of poverty to constitute an emerging group that has been identified by many as the new Brazilian middle class
(NERI, 2010; FERREIRA et al., 2012). The rise of the so‑called new middle class has gi‑ ven support to a boom in the domestic consumer market and has contributed to sustain economic growth in the last decades2. Indeed, the new middle class would be composed by younger people with higher educational level and higher consumption standards.
The emergence of the new Brazilian middle class3 is, in fact, an issue of debate among academics. Despite acknowledging that the consumption per capita has been increasing over the years4, many authors reject the idea that there actually is a new middle class in the country. Pochmann (2012), for example, focusing his work on in‑ come evolution, states that the increase of the consumption pattern does not mean social mobility. According to him, the increase of per capita consumption points to a market phenomenon instead of a real transformation of socioeconomic nature or a change in the dynamics of the Brazilian society. Scalon and Salata (2012), based on a sociological approach, argue that movements in the class structure might not have been significant enough to support the idea of a rising new social class, or even that the traditional middle class has expanded5.
In order to better inform this debate, this paper is concerned with an exploratory exercise to highlight methodological issues related to differences on the stratification cri‑ terion of socioeconomic classes currently used in Brazil. Before proceeding, it should be noted that this paper is not concerned with the theoretical debate about how to delimit the
1 Real minimum wage increased over 70%, almost four times more than in the previous decade (18%), between 2002 and 2012.
2 It should be mentioned that the emergence of the middle class is observed in most Latin American eco‑ nomies. See, for instance, Birdsall (2013).
3 For a definition of Middle Class in Brazil, see the definition proposed by the Secretary for Strategic Issues (SAE, 2012), according to which the middle class consists of all people living in households with per capita income between R$ 291 and R$ 1,019 per month (values in March 2012).
stratification of social classes6. The motivation for this note is that, given that the impro‑ vement of the income distribution is a new phenomenon in the country, the dissemina‑ tion of figures highlighting the rising of the living standards of Brazilian families has be‑ come very popular. However, there is not a unique way of defining socioeconomic classes and, in most cases, no reference is made about which stratification criteria has been used.
Actually, few studies regarding the evolution of living standards compare different economic stratification criteria in order to explain how consumption habits have evolved and –something very important – how it has been financed. Therefore, this paper intends to contribute to the understanding of the changes in Brazilian class stratification profile, and for that it exploits descriptive data from the Family Expenditure Survey. To enlighten the discussion about the rising of a new middle class, it provides empirical evidence about socioeconomic characteristics and consumption habits of groups of people and on how they managed to finance their consumption expenses. Our results confirm an eco‑ nomic improvement over time for individuals classified in the lower socioeconomic stra‑ tum, together with an increase of total and per capita average income, and an increase of expenses. On the other hand, there is also a clear reduction of savings for families in all economic strata and so higher levels of household indebtedness are also observed.
The empirical study reproduces two stratification criteria used in Brazil: one by market research companies and the other by academics and policy makers. We repli‑ cate both criteria using survey data from the two last editions of the Brazilian Family Expenditure Survey (2002/2003 and 2008/2009). The criterion called Brazil Criterion
was developed by market research experts and, like many other social grade criteria around the world, it is used as a good discriminating function for purchasing power. The other one, developed by academics, is mainly based on per capita income and has been used to discuss issues related to poverty alleviation. This will be named here as the Center for Social Policies(CSP) stratification criterion, with a reference to the re‑ search institution located in Rio de Janeiro (Centro de Políticas Sociais – FGV), where the criterion was created. The paper identifies strata membership according to the two different criteria based on survey data and examines the strata profiles taking into ac‑ count expenditure, income and debt related variables.
As a result of our empirical work, we reveal differences between household profile variables related to the two types of stratification criteria that we believe are relevant to research fields that make use of socioeconomic stratification to identify differences in living standards. These research areas are mainly in administration and communica‑ tion, where one studies consumer patterns, and in economics with emphasis on public policy analysis. In relation to marketing studies, advertising agencies and firms must
have, in general, a clear understanding that each of the criteria built considering diffe‑ rent definitions of income: the Brazil Criterion uses household total income and the Center for Social Policies approach takes into account per capita income. The first ap‑ proach prioritizes consumption decisions, while the latter is closely linked to the notion of welfare. Researchers in public policy, on their turn, should consider that, as in both criteria household expenditure depends on the level of budget constraint, it is important that the government examines critically the evolution of income and savings, in order to be able to guide families on how to manage their budgets. Initiatives related to capa‑ city building on personal and family financial management are a valuable instrument to make people aware of the essential need of planning financial spending.
This paper is organized as follows: section 2 briefly describes the stratification criteria that will be analysed and section 3 presents the main characteristics of the Brazilian Family Budgetary Survey, which will be the reference of our empirical analy‑ sis. The methodology employed in this paper is described in section 4, and section 5 presents our results, describing our findings according to economic and demographic variables. Finally, section 6 presents the main conclusion of our study.
2. SOCIOECONOMIC STRATIFICATION CRITERIA AS DISCRIMINATORY TOOLS
There is no consensus as to which specific stratification technique or social grade cri‑ terion one should chose for social classes7. So a choice must be made based on research objectives. One criterion can be more appealing if the specialist is interested on its use as a discriminatory tool to investigate purchasing power characteristics of a group, family or individual, whereas the other may be considered as a measure related to in‑ come distribution and can be more adequate to reflect changes in wellbeing regarding poverty alleviation. Therefore, studies focusing on social inequality or socioeconomic and market segmentation, for example, serve different purposes and require different measures to be taken into account as a barometer of change. Both criteria discussed in this paper are described below.
2.1. THE BRAZIL CRITERION
According to the Brazilian Association of Survey Companies (ABEP)8 from 2007, the “Brazil Criterion” of economic classification main goal is to estimate the purchasing
7 See Birdsall (2013), for instance.
power of individuals and urban families. This stratification criterion aims at generating a standardized scoring system that could work as a predictor of individuals’ and fami‑ lies’ consumption capacity, and it is able to discriminate large groups according to their capacity for consuming products and services that are accessible to a significant part of the population. The criterion discrimination procedure takes into account tangible household characteristics such as possession and quantity of durable goods, number of bathrooms, employment of domestic workers and educational level of the head of hou‑ sehold. Each item receives a score and the sum of scores is then associated to an econo‑ mic grade or stratum – A1, A2, B1, B2, C1, C2, D and E – (details in Appendix).
However, despite being largely employed, this criterion is questioned due to some limitations. Mattar (1994, 1996) argues that there is not a consensus on which varia‑ bles should be taken into account to define a classification criterion that could effecti‑ vely group consumers in a way that the groups could match the several stereotypes acknowledged in the market environment. In addition, the effect of family size (as the score is based on quantity and possession of goods and services), and the massification of durable goods over time are viewed as drawbacks of this criterion.
2.1. THE CRITERION DEFINED BY THE CENTER FOR SOCIAL POLICIES (CSP)
This criterion has a similar approach to the one generally used for the analysis of poverty issues related to the so‑called absolute poverty concept and it is based on household per capita income. The lower economic stratum (named E) is comprised of families with household per capita income below (or equal to) a poverty line9. The subsequent stratum (D) belongs to families whose household per capita income is situated between the po‑ verty line and the median of the distribution. Next, the families in class C are those with household per capita income between the median and the ninth decile of the income distribution and, finally, the so‑called AB class is composed of families with household
per capita income above the ninth decile (NERI and MELO, 2008).
3. THE BRAZILIAN FAMILY EXPENDITURE SURVEY
The Brazilian Family Expenditure Survey, conducted by the Brazilian Institute of Geography and Statistics, has a probabilistic sample and the survey target population
comprises those living in urban and rural areas. The survey aims at uncovering fa‑ milies’ consumption structures that allows delineating the population’s life condi‑ tions based on their household budget and corresponding expenditure. The survey has several units of analysis: consumer units, households, families, individuals and the products (listed on the expenditure questionnaire). The data collection period lasts 12 months, in which it is possible to capture changes on family budget across the whole year, embracing all income and expenses variations that may occur on the annual budget (IBGE, 2010). For this paper, calculations have been done for consu‑ mer units, since most of the household expenditure data is collected at this level, and the terms consumer unit, family and household may be used interchangeably for convenience.
4. METHODOLOGY
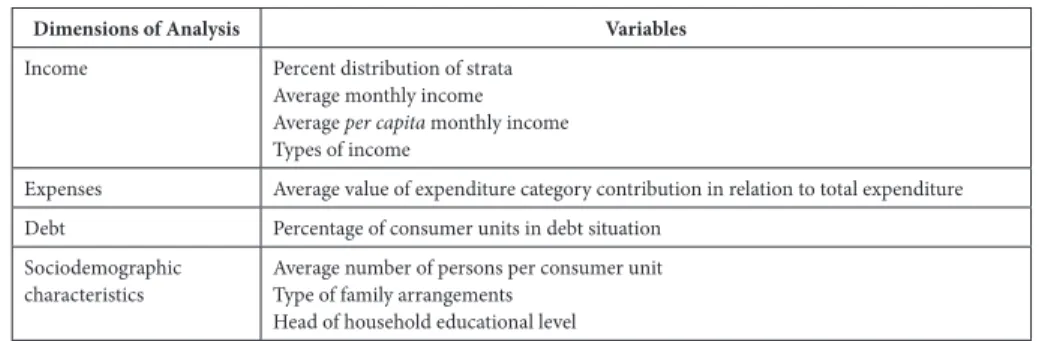
The methodology consists on identifying strata membership of consumer units accor‑ ding to the two different criteria based on survey data from the 2002/2003 and 2008/2009 editions. In the case of the Brazil Criterion, the calculations were done ba‑ sed on the classification scoring scale defined in 2007. The analysis compares results of two distinct criteria of socioeconomic classification for two different periods in order to point out different perspectives of strata profiles, considering economic variables, such as income, type of income, debt profile, expenditure, as well as demographic va‑ riables such as composition of the consumer unit, types of family arrangements and level of education. As the Family Expenditure Survey has a complex sample design, the estimation procedure took into account the sample weights.
Box 1 – Dimensions of analysis and corresponding variables
Dimensions of Analysis Variables
Income Percent distribution of strata Average monthly income Average per capita monthly income Types of income
Expenses Average value of expenditure category contribution in relation to total expenditure
Debt Percentage of consumer units in debt situation
Sociodemographic characteristics
Average number of persons per consumer unit Type of family arrangements
Head of household educational level
Source: Authors’ elaboration.
The analysis of both criteria in two separate occasions aims at revealing how the strata setting is generated by each criterion, assessing change in strata profiles between two survey editions and comparing the settings of the high, medium and low strata of different stratification criteria.
As this paper is based on a quantitative study, it is not possible to capture, in a qualitative way, the similarities and differences related to expenses type within each group of expenses. Also, the main descriptive statistics employed to summarize the variables is the mean, a central tendency measure that is influenced by extreme obser‑ vations. Another limitation here is due to the fact that it was not possible to carry out a longitudinal analysis, in a panel style, since the families cannot be identified or mo‑ nitored through survey editions. We produce a photograph of the strata configuration in each survey edition and compare them. At last, it is worth mentioning that this study only captures the changes related to expenses and incomes in two fixed occa‑ sions, but not the stock of these quantities.
5. RESULTS
Our analytical strategy to compare both stratification criteria followed the variables identified in Box 1. Therefore, we evaluated both criteria according to the level of in‑ come, composition of expenditures, degree of indebtedness and sociodemographic characteristics.
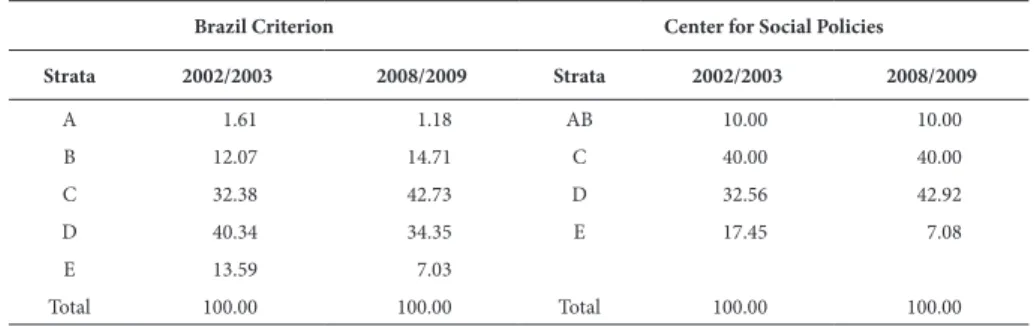
5.1. PERCENT DISTRIBUTION OF STRATA
over time. Although this study is not based on panel data, it can be suggested that families that were positioned in stratum E have ascended to stratum D, and some of these to stratum C. The reduction of the lower strata can be associated with govern‑ ment income transfer programs driven to families in a situation of extreme social vulnerability.
Table 1 – Percent distribution of consumer units by stratification criteria.
Brazil Criterion Center for Social Policies
Strata 2002/2003 2008/2009 Strata 2002/2003 2008/2009
A 1.61 1.18 AB 10.00 10.00
B 12.07 14.71 C 40.00 40.00
C 32.38 42.73 D 32.56 42.92
D 40.34 34.35 E 17.45 7.08
E 13.59 7.03
Total 100.00 100.00 Total 100.00 100.00
Source: Authors’ elaboration.
Indeed, the changes in the composition of the stratum in both criteria between the two periods are also very revealing of the movements that might have occurred among the strata. In the 2002/2003 period, stratum D was the one with highest weight accor‑ ding to Brazil Criterion. Looking at the 2008/2009 period, stratum C, commonly asso‑ ciated to the so‑called middle class, appears as it is congregating more consumption units, suggesting the upward movement among consumer units. On the other hand, in the case of the Center for Social Policies criterion, the mobility among the strata seems to have been higher from stratum E to stratum D, as the percentage of middle class strata has not changed between the two periods.
Table 2 – Percentage of consumer units per strata classified according to both criteria in 2002/2003 and 2008/2009
2002/2003 2008/2009
Brazil Criterion Brazil Criterion
Center for Social Policies
Strata ab c d e Total
Center for Social Policies
Strata ab c d e Total
AB 63 30 6 1 100 AB 62 33 4 0 100
C 17 49 31 4 100 C 21 53 23 2 100
D 1 26 58 14 100 D 3 40 49 29 100
E 0 8 49 42 100 E 1 14 53 33 100
Source: Authors’ elaboration.
An explanation to this divergence is the greater capacity of families with lower income to purchase goods, following better opportunities to credit after mid‑2000s. If this is the case, Brazil Criterion better captures this movement, as it takes into account the quantity of goods in the household, whereas the Center for Social Policies criterion considers the per capita income evolution.
5.2. INCOME
A comparison between 2002/2003 and 2008/2009 estimates of average monthly real income and average per capita real income in Table 3 shows improvements in most of the strata.
Table3 – Real average monthly income and real average per capita monthly income per consumer units in US dollars by strata, according to two stratification criteria
Brazil Criterion Center for Social Policies
Strata
Average Monthly Income
Average Per capita Monthly Income Strata
Average Monthly Income
Average Per capita Monthly Income 2002/03 2008/09 2002/03 2008/09 2002/03 2008/09 2002/03 2008/09
A 6999 8655 1995 2627 AB 4632 5156 1929 2338
B 3207 3319 1130 1259 C 1219 1434 395 517
C 1198 1235 435 475 D 495 590 132 166
D 551 619 193 248 E 232 215 48 45
E 310 381 110 151
Source: Authors’ elaboration.
congregates only those families with very low income. Although this stratum is com‑ prised of fewer families in 2008/2009, these are the families who were still in an ex‑ treme vulnerable social condition. Overall, the combination of more access to credit, higher real income levels and controlled inflation provided the adequate conditions to promote gains in the families’ purchasing power.
5.3. EXPENDITURES CATEGORIES AND CORRESPONDING CONTRIBUTION TO FAMILY BUDGET
Considering both criteria, there is a great similarity in the way families spend their income according to different expenditure items and different strata. As expected, the housing category is the one with higher impact on family budget followed by vehicles and additional expenditures for families in middle or higher strata. On the other hand, as it is usually the case, a substantial part of the budget is used for food expenses in case of families in the lower socioeconomic strata. It is important to highlight that, associa‑ ted with an increase on income, it can also be noted a rearrangement on the composi‑ tion of expenditures, particularly for the strata defined by the Center of Social Policies. For families in stratum D, from 2002/2003 to 2008/2009, there is evidence that, in re‑ lative terms, the contribution of expenditures with food, clothing and footwear, vehi‑ cles plus personal goods and services have increased. Consequently, expenses with housing and repair represent nowadays a lower percentage indicating a change in pur‑ chasing habits of this group of people, the so‑called “new” Brazilian middle class.
Table 4 – Average value of expenditure category contribution in relation to total expenditure by socioeconomic strata (continues)
Expenditure Categories
Brazil Criterion
A B C D E
2002/03 2008/09 2002/03 2008/09 2002/03 2008/09 2002/03 2008/09 2002/03 2008/09
Hounsing and repair 38.4% 37.2% 44.1% 41.8% 40.2% 35.2% 36.7% 30.2% 32.6% 42.2%
Comfort items 3.1% 4.2% 3.5% 3.6% 4.2% 4.3% 5.1% 5.0% 5.5% 3.9%
Household maintenance
and services 3.1% 3.8% 2.7% 2.9% 3.1% 3.1% 3.1% 3.5% 4.4% 3.0%
Transport 3.7% 0.1% 4.0% 3.5% 4.1% 4.1% 4.1% 4.2% 4.6% 3.5%
Tobbaco 0.6% 0.1% 0.7% 0.8% 1.1% 1.2% 1.4% 1.5% 1.2% 0.9%
Health 5.2% 4.4% 4.7% 4.1% 5.5% 4.4% 7.2% 5.3% 6.4% 3.6%
Education, recreation and
culture 11.1% 12.7% 9.8% 9.3% 9.2% 9.7% 9.2% 9.8% 9.8% 7.2%
Clothing and footware 3.4% 3.8% 3.4% 3.6% 4.4% 4.7% 5.3% 5.7% 4.5% 4.2%
Other expenses 1.9% 2.0% 1.7% 2.0% 2.2% 2.7% 2.7% 3.6% 3.1% 2.3%
Table 4 – Average value of expenditure category contribution in relation to total expenditure by socioeconomic strata
Expenditure Categories
Brazil Criterion
A B C D E
2002/03 2008/09 2002/03 2008/09 2002/03 2008/09 2002/03 2008/09 2002/03 2008/09
Vehicles and additional
expenses 15.4% 18.8% 12.6% 15.1% 11.9% 14.2% 6.9% 9.8% 6.5% 8.3%
Food 6.8% 7.3% 6.8% 7.6% 8.8% 10.5% 11.9% 14.5% 14.7% 14.2%
Make up, hygiene, personal
services 1.7% 1.9% 1.8% 1.9% 2.1% 2.4% 2.6% 2.8% 2.5% 2.0%
Total in dollars 110,884 121,522 65,560 67,889 31,430 30,526 16,954 16,776 10,263 15,641
Expenditure Categories
Center for Social Policies
AB C D E
2002/03 2008/09 2002/03 2008/09 2002/03 2008/09 2002/03 2008/09
Hounsing and repair 44.5% 44.1% 37.2% 33.9% 33.9% 26.7% 30.3% 30.8%
Comfort items 3.2% 3.4% 4.3% 4.1% 5.8% 5.6% 6.2% 6.3%
Household maintenance
and services 2.7% 2.7% 3.6% 3.4% 3.7% 3.8% 4.0% 3.5%
Transport 3.5% 2.6% 4.6% 4.2% 4.9% 5.0% 4.4% 5.4%
Tobbaco 0.6% 0.7% 1.1% 1.1% 1.5% 1.5% 1.5% 1.5%
Health 3.9% 3.8% 4.0% 4.5% 4.5% 4.7% 5.9% 4.5%
Education, recreation and
culture 10.2% 9.8% 10.6% 10.4% 9.6% 9.9% 10.1% 10.7%
Clothing and footware 3.3% 3.3% 4.6% 4.6% 5.8% 6.1% 4.8% 5.8%
Other expenses 1.6% 2.0% 2.3% 2.7% 3.1% 2.7% 3.9% 3.5%
Financial services 5.1% 3.9% 3.2% 3.6% 2.7% 3.5% 2.3% 2.4%
Vehicles and additional
expenses 13.7% 15.9% 13.2% 15.3% 9.1% 12.2% 7.4% 6.9%
Food 6.2% 6.2% 9.0% 10.0% 12.7% 15.1% 16.5% 15.8%
Make up, hygiene, personal
services 1.6% 1.6% 2.3% 2.3% 2.7% 3.1% 2.8% 2.9%
Total in dollars 82,302 94,266 31,507 35,209 15,744 16,968 10,151 11,760
Source: Authors’ elaboration.
5.4. TYPES OF INCOME
financial asset movement group in relation to the total income. Comparing the 2002/2003 and the 2008/2009 periods, there is evidence of a sharp drop in savings. The consumer units reduced their savings in this period, in order to finance their augmented spending. A clear example of this behavior is what happened with the con‑ sumer units in stratum D of Brazil Criterion that achieved a debit balance on this group of income in 2008/2009. In general, one can see that family consumption among strata was markedly funded by a reduction in savings and also by the contraction of loans.
Table5 – Average contribution and average annual income in US dollars according totype of income by socioeconomic strata
Types of Income
Brazil Criterion
A B C D E
2002/03 2008/09 2002/03 2008/09 2002/03 2008/09 2002/03 2008/09 2002/03 2008/09
Incomes and deductions
46.2% 48.4% 45% 58.1% 43.7% 56.6% 47.4% 56% 33,80% 44.9%
61,339 40,642 21,131 25,103 8,198 9,003 3,880 4,241 1,908 2,167
Other types of incomes and deductions
22.9% 23.3% 19.8% 24.1% 21.6% 28.3% 24.4% 36.2% 24.8% 35.4%
30,383 19,529 9,290 10,423 4,052 4,494 1,997 2,741 1,398 1,708
Money receipts, loans and deductions
10.5% 15.7% 13.4% 13.7% 10.8% 12.9% 9.1% 12.1% 9.2% 13.7%
13,910 13,151 6,295 5,919 2,032 2,051 744 914 517 662
Financial assets’ movement
20.4% 12.6% 21.8% 4.1% 23.9% 2.2% 19.1% ‑4.2% 32.2% 6%
27,035 10,580 10,252 1,779 4,475 350 1,564 ‑316 1,814 289
Total 132,667 83,903 46,968 43,225 18,756 15,898 8,185 7,580 5,637 4,826
Types of Income
Center for Social Policies
AB C D E
2002/03 2008/09 2002/03 2008/09 2002/03 2008/09 2002/03 2008/09
Incomes and deductions
41.5% 54.7% 51.2% 60% 48.4% 57.1% 36.1% 47.4%
29,360 38,655 8,912 11,301 3,519 4,334 1,488 1,313
Other types of incomes and deductions
19.8% 26.6% 21% 26.5% 23.4% 29.8% 21.2% 32.1%
13,982 38,388 7,461 10,169 3,477 4,617 1,783 1,816
Money receipts, loans and deductions
13.9% 15.2% 10.1% 10.8% 7,90% 9.5% 7.6% 13.5%
9,864 10,735 1,757 2,040 575 725 315 372
Financial assets’ movement
24.8% 3.5% 17.8% 2.7% 20.2% 3.6% 35.1% 7%
17,526 2,473 3,096 507 1,471 272 1,447 193
Total 70,732 90,252 21,226 24,017 9,042 9,948 5,033 3,694
Source: Authors’ elaboration.
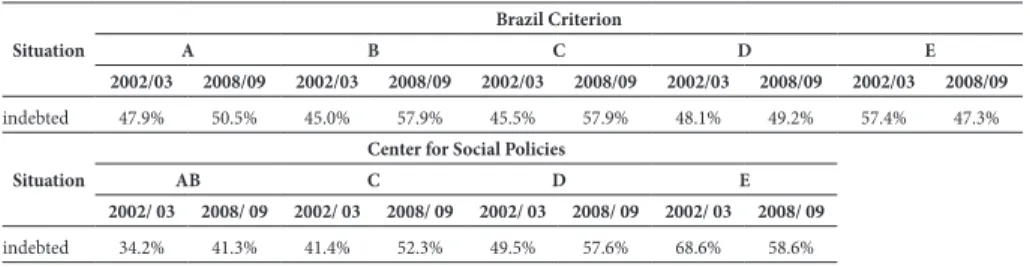
5.5. DEBT SITUATION
It is relevant to point out that more than half of the consumption units in the popu‑ lation were in debt situation in 2008/2009. The worst case is observed for stratum E that, even though featured a decrease in the share of families in debt from 2002/2003 to 2008/2009, is nonetheless the most affected group according to both criteria (Table 6).
Table 6 – Percentage of consumer units in debt situation
Situation
Brazil Criterion
A B C D E
2002/03 2008/09 2002/03 2008/09 2002/03 2008/09 2002/03 2008/09 2002/03 2008/09
indebted 47.9% 50.5% 45.0% 57.9% 45.5% 57.9% 48.1% 49.2% 57.4% 47.3%
Situation
Center for Social Policies
AB C D E
2002/ 03 2008/ 09 2002/ 03 2008/ 09 2002/ 03 2008/ 09 2002/ 03 2008/ 09
indebted 34.2% 41.3% 41.4% 52.3% 49.5% 57.6% 68.6% 58.6%
Source: Authors’ elaboration.
There are many reasons why debt commitment increased so widely among consu‑ mer units in the 2000s: favourable expectations about the future, price stability, incre‑ ase in employment rate, decrease in interest rates and so on. Also, bank institutions changed their strategies, as the degree of confidence in the future prospects of the Brazilian economy was improving. Therefore, one should consider that banks, under greater competition due to economic opening and in an environment of stable infla‑ tion, identified potential gains in loans to households, supported by optimistic expec‑ tations regarding the recovery of employment and income under Lula’s government (PRATES et al., 2009, p. 5). On the other hand, regulation concerning access to credit changed in 2003, when a special type of personal credit, the consigned loans (or payroll loans as banks are allowed to discount the pay back of loans direct from wages depo‑ sits) was authorized10. Actually, a change in Central Bank regulation expanded this type of credit to all employees and retirees, as before 2003, it was restricted to civil servants. According to Central Bank (2005), this sort of loan stimulates competition among bank institutions, while both smaller and bigger banks took advantage of this opportunity of expanding credit. Indeed, Central Bank time series shows that in 1995 consumer credit was 8% of total credit and in 2008 it reached 33%.
Therefore, the government strategy to give access to credit to all social economic classes must be seen as noteworthy to boost aggregate consumption expenditure and
to contribute to social mobility11. However, the high level of indebtedness also imposes limits to family expenditure plans. Hence, as the access to credit came in very force‑ fully, households are now facing new constraints as families budgets are committed to pay debts (SCIRÉ, 2009).
5.6. AVERAGE NUMBER OF PERSONS PER CONSUMER UNIT
Comparing the number of persons per consumer unit, which is a key characteristic related to consumption pattern of the households, we observe that the average number of persons per consumer unit is the same for all strata in the case of Brazil Criterion (Table 7). Taking the Center for Social Politics criterion into account, the number in‑ creases from stratum AB to stratum E, revealing that richer families have on average few people per household.
Table 7 – Average number of persons per consumption units by strata in 2002/2003 and 2008/2009
Brazil Criterion Center for Social Policies Strata 2002/2003 2008/2009 Strata 2002/2003 2008/2009
A 3.97 3.69 AB 2.58 2.38
B 3.51 3.31 C 3.13 2.81
C 3.51 3.26 D 3.81 3.70
D 3.63 3.28 E 5.03 4.89
E 3.97 3.5
Source: Authors’ elaboration.
The difference between each criterion in relation to the average number of persons
per stratum can be explained by its corresponding method of construction. The Brazil Criterion method is based on the quantity of durable goods in the household and it is reasonable to assume that a consumption unit with more people will present more domestic items. This may explain the higher number of persons per household in the stratum A in the Brazil Criterion in relation to the Center for Social Policies.
For the other criterion, the classification is based on per capita household income, the same information used to establish poverty line and the strata limits are defined
according to the deciles of the empirical income distribution. In this way, a household with low per capita income can associated to more residents with less income.
5.7. TYPES OF FAMILY ARRANGEMENTS
Types of family arrangements vary considerably among criteria. Table 8 provides evi‑ dence that the choice of a stratification criterion implies that the analyst would deal with different profiles of family arrangements.
In the case of Brazil Criterion, for example, couples with children older than 15 years represent almost 40% of the families classified in stratum A, whereas couples with children younger than 15 years have higher percentage in strata B, C, D and E. One should also note that those families with only one person correspond to the type of arrangement that has the second higher participation in stratum E. On the other hand, for the Center criteria, families with only one person and couples without children have higher participation in strata AB and couples with children younger than 15 years are over‑represented in strata D and E. The one person family is classified in different strata in each of the two criteria. One reason is that Brazil Criterion takes into account the possession of durable goods and the employment of housekeepers, which are con‑ verted to points in a scale. However, individuals who live alone may not necessary own (or even need) a quantity of durable goods to be positioned in the higher strata (they may eat out more frequently and make use of laundry services, for example).
Table 8 – Percent distribution of family arrangements by strata Brazil Criterion (2002/2003 and 2008/2009) (continues)
Family arrangements Overall A B C D E
2002/03 2008/09 2002/03 2008/09 2002/03 2008/09 2002/03 2008/09 2002/03 2008/09 2002/03 2008/09
One person 14.72 16.56 3.21 6.13 11.19 11.19 12.61 14.19 16.42 20.63 19.2 24,00
One parent with children
younger than 15 years old 4.22 4.13 0.41 0.78 2.58 2.14 3.39 3.7 4.95 5.21 5.93 6.25 One parent with children
older than 15 years old 9.07 10.35 4.95 6.33 7.89 8.6 8.39 10.38 10.62 11.52 7.64 8.77 One parent with children
younger and older than 15
years old 2.47 2.08 1.73 0.46 1.31 0.81 1.8 1.87 3.16 2.81 3.17 2.63
Couple without children 13.65 16.78 10.46 11.38 14.43 17.47 15.07 17.84 13.42 16.32 10.68 12.09 Couple with children
younger than 15 years old 30.90 25.99 30.68 24.58 29.38 26.49 32.93 27.83 29.08 23.18 32.9 27.71 Couple with children older
than 15 years old 14.84 16.08 38.02 41.58 23.35 24.73 15.6 16.28 12.78 12.65 8.79 9.29 Couple with children
younger and older than 15
years old 10.08 7.79 10.16 7.51 9.75 8.46 10.16 7.71 9.56 7.38 11.69 9,00
Others 0.05 0.24 0.37 1.25 0.12 0.11 0.05 0.2 0.01 0.3 0,00 0.26
Table 8 – Percent distribution of family arrangements by strata Brazil Criterion (2002/2003 and 2008/2009)
Center for Social Policies (2002/2003 and 2008/2009)
Family arrangements Overall AB C D E
2002/03 2008/09 2002/03 2008/09 2002/03 2008/09 2002/03 2008/09 2002/03 2008/09
One person 14,72 16.56 30.00 32.21 18.97 22.01 10.7 9.94 3.81 3.7
One parent with children
younger than 15 years old 4.22 4.13 1.18 1.17 2.74 2.32 5.25 5.53 7.4 10.09 One parent with children
older than 15 years old 9.07 10.35 8.6 9.19 9.51 11.06 9.87 10.76 6.86 5.46 One parent with children
younger and older than 15
years old 2.47 2.08 0.84 0.36 1.8 0.88 2.53 3.06 4.82 5.31
Couple without children 13.65 16.78 21.1 24.39 17,00 21.47 11.62 12.69 5.58 4.37 Couple with children
younger than 15 years old 30.90 25.99 16.47 12.37 25.48 19.41 34.16 31.93 45.45 46.39 Couple with children older
than 15 years old 14.84 16.08 18.18 17.54 16.59 17.4 14.61 15.8 9.35 8.31 Couple with children
younger and older than 15
years old 10.08 7.79 3.5 2.68 7.86 5.24 11.23 9.96 16.74 16.3
Others 0.05 0.24 0,12 0,1 0,05 0,2 0,03 0,32 0 0,05
Total 100.00 100.00 100.00 100.00 100.00 100.00
Source: Authors’ elaboration.
Conversely, individuals who live alone only do so when they have financial condi‑ tions to pay for housing and other maintenance costs. The fact that the per capita in‑ come is the variable used to define the strata boundaries in the case of the Center for Social Policies criterion, gives rise to an inverse situation. It places individuals who live alone in the higher stratum, generating noteworthy participation of this arrangement in stratum AB. The contribution of this type of arrangement has a decreasing trend from stratum AB to E. The lower stratum is mostly composed of families with a higher num‑ ber of children and couples with children younger than 15 years. The latter group may also include couples with young children at the beginning of their professional careers.
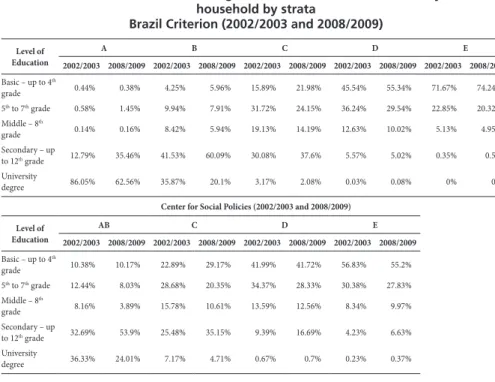
5.8. HEAD OF HOUSEHOLD EDUCATIONAL LEVEL
As for the Center of Social Policies method, the level of education of the head of the household is not a specific constraint for the stratification procedure (although here also there is an effect of correlation between education and income). The percen‑ tage of consumer units whose head of household holds a university degree is much lower in stratum AB than in the Brazil Criterion.
Table 9 – Percent distribution of highest level of education attained by head of household by strata
Brazil Criterion (2002/2003 and 2008/2009)
Level of Education
A B C D E
2002/2003 2008/2009 2002/2003 2008/2009 2002/2003 2008/2009 2002/2003 2008/2009 2002/2003 2008/2009
Basic – up to 4th
grade 0.44% 0.38% 4.25% 5.96% 15.89% 21.98% 45.54% 55.34% 71.67% 74.24%
5th to 7th grade 0.58% 1.45% 9.94% 7.91% 31.72% 24.15% 36.24% 29.54% 22.85% 20.32% Middle – 8th
grade 0.14% 0.16% 8.42% 5.94% 19.13% 14.19% 12.63% 10.02% 5.13% 4.95%
Secondary – up
to 12th grade 12.79% 35.46% 41.53% 60.09% 30.08% 37.6% 5.57% 5.02% 0.35% 0.5%
University
degree 86.05% 62.56% 35.87% 20.1% 3.17% 2.08% 0.03% 0.08% 0% 0%
Center for Social Policies (2002/2003 and 2008/2009)
Level of Education
AB C D E
2002/2003 2008/2009 2002/2003 2008/2009 2002/2003 2008/2009 2002/2003 2008/2009
Basic – up to 4th
grade 10.38% 10.17% 22.89% 29.17% 41.99% 41.72% 56.83% 55.2%
5th to 7th grade 12.44% 8.03% 28.68% 20.35% 34.37% 28.33% 30.38% 27.83% Middle – 8th
grade 8.16% 3.89% 15.78% 10.61% 13.59% 12.56% 8.34% 9.97%
Secondary – up
to 12th grade 32.69% 53.9% 25.48% 35.15% 9.39% 16.69% 4.23% 6.63% University
degree 36.33% 24.01% 7.17% 4.71% 0.67% 0.7% 0.23% 0.37%
Finally, it is understood that choosing one or other stratification criterion genera‑ tes different profiles of consumer units according to the educational level of head of household and consequently different patterns of consumption.
6. CONCLUSION
fication, and an important debate emerged among academics and in the media about the rise of a new middle class in Brazil. To contribute to this debate, this paper evalua‑ ted, using descriptive statistics, two different class stratification methodologies, which reveal slightly different characteristics about the changes in consumption pattern ac‑ cording to socioeconomic stratum. Economic and demographic variables were inves‑ tigated in order to differentiate both criteria.
Both methodologies reveal a decrease at the participation of lower strata, increase of participation of medium strata, increase of total and per capita income, increase on average expenses and increase on average income. Brazil Criterion exposes a raise on the consumption potential and the Center for Social Policies criterion signals a po‑ verty alleviation condition. So, both criteria show an improvement in social mobility with positive impact on aggregate consumption in the period. However, Brazil Crite‑ rion methodology puts more weight on demographic characteristics than the Center for Social Policies methodology, and in this sense, it tends to give less importance to the degree of indebtedness as a problem to inhibit future consumption.
Therefore, our exercise also evaluated the degree of indebtedness according to the economic strata in both criteria and we concluded that this degree has increased for all strata, except for the lower stratum, which was the one with the highest commitment to debt loans in the 2002/2003 period. This is an important contribution of our work, since the sustainability of the private consumption as a driving force to push economic growth can be constrained by the financial fragility of family’s budget. Indeed, the low response of the Brazilian GDP growth in the last years (2011, 2012 and 2013) has been attributed to an exhaustion of the growth model driven by domestic consumption.
In general, we could show that in both criteria there is a trend in the direction of families consuming more, using their savings and reducing their wealth. In aggregate terms, this implies a transfer of income from families to the financial sector. In this sense, if, on one hand, almost universal access to credit has reframed the possibility of consumption in the second half of the first decade of the 2000s, dissociating it from income earnings and savings, on the other, has brought another concern to indebted families. It means saying that these families, which are spread in all socioeconomic strata, have to manage the payment of debt commitments in an environment of incre‑ ased uncertainty in relation to the future.
though demographic characteristics tend to change little over a short period of time, we could observe that the distribution of consumer units by level of education of the head of household has changed from 2002/2003 and 2008/2009 for the highest stratum in both criteria. This change occurred in the direction of reducing the weight of the university degree group. This is an interesting finding as it shows a reduction in the importance of graduate schooling as determinant to be included in the higher social economic class. In addition, it reveals the relevance of having the secondary schooling degree concluded in order to be better positioned in socioeconomic stratification.
7. REFERENCES
ABEP – ASSOCIAÇÃO BRASILEIRA DE EMPRESAS DE PESQUISA. O novo critério padrão de classificação econômica Brasil. São Paulo: ABEP, 2007. Available at: <http://www.abep. org/criterio‑brasil>. Accessed on: April 16, 2015.
BANCO CENTRAL DO BRASIL. Relatório de Inflação, v. 07, n. 2, 2005.
BANCO CENTRAL DO BRASIL. Séries Temporais. Available at: https://www3.bcb.gov.br. Ac‑
cessed on: April 16, 2015.
BANERJEE, A; DUFLO, E. What is middle class about the middle class around the world?
Jour-nal of Economic Perspectives, v. 22, n. 2, p. 3‑28, 2008.
BIRDSALL, N. The Middle class in developing countries – who they are and why they matter.
Poverty in Focus, International Policy Center for Inclusive Growth, UNDP, n. 26, 2013.
CHAUÍ, M. On social classes: a new Brazilian working class. Poverty in Focus, International
Policy Center for Inclusive Growth, UNDP, n. 26, 2013.
CRUCES, C; LOPEZ‑CALVA, L. F.; BATTISTON, D. Down and out or up and in? In search of
Latin America’s elusive middle class. Working Paper, RBLAC‑UNDP, New York, ID‑03‑2010,
2010. Available at: <http://www19.iadb.org/intal/intalcdi/PE/2012/10222.pdf>. Accessed on: April 16, 2015. Available at: <http://www19.iadb.org/intal/intalcdi/PE/2012/10222. pdf>. Accessed on: April 16, 2015.
FERREIRA, F. H. G.; MESSINA, J.; RIGOLINI, J.; LÓPEZ‑CALVA, L.; VAKIS, R. Economic
Mo-bility and the Rise of the Latin American Middle Class. World Bank Latin American and
Caribbean Studies. Washington DC: World Bank, 2012.
IBGE – INSTITUTO BRASILEIRO DE GEOGRAFIA E ESTATÍSTICA. Pesquisa de Orça‑ mento Familiar, 2008/2009. Rio de Janeiro: IBGE, 2010. Disponível em: <http://www.ibge. gov.br/home/estatistica/populacao/condicaodevida/pof/2008_2009/POFpublicacao.pdf>. Acesso em: 12 set. 2016.
MATTAR, F. N. Estratificação socioeconômica e pesquisas de marketing. In: ENCONTRO DA
ANPAD, 18, Curitiba, PR, 1994. Anais. Curitiba: ANPAD, v. 7, p. 307‑325, 1994.
MATTAR, F. N. Porque os métodos de classificação socioeconômicos utilizados no Brasil não fun‑
NERI, M. C.; MELO, L. C. C. Miséria e classe média na década da igualdade. Rio de Janeiro: Fundação Getúlio Vargas/IBRE, CPS, 2008. Available at: <http://www.fgv.br/cps/desigual‑ dade>. Accessed on: September 19, 2011.
NERI, M. A nova classe média: o lado brilhante dos pobres. Rio de Janeiro: FGV / CPS, 2010.
Available at: <http://www.cps.fgv.br/ibrecps/ncm2010/NCM_Pesquisa_FORMATADA. pdf>. Accessed on: July 24, 2013.
PAIVA, G. F. S. Consumo e critérios de classificação socioeconômica: um estudo aplicado à pesquisa de orçamentos familiares. MSc Dissertation (Master in Population Studies and Social Surveys), National School of Statistical Sciences, IBGE, Rio de Janeiro, 2012.
POCHMANN, M. Nova classe média? O trabalho na base da pirâmide social brasileira. São
Paulo: Boitempo, 2012.
PRATES, D. M.; BIANCARELLI, A. M.; CARNEIRO, R. M.; FREITAS, M. C. P.; ROSSI, P.;
AGUIAR, L.; LODI, A. L. Panorama do ciclo de crédito recente: condicionantes e
característi-cas gerais. Projeto de Estudos Sobre as Perspectivas da Indústria Financeira Brasileira e o
Papel dos Bancos Públicos – Subprojeto: Mercado de Crédito Bancário. Campinas: BNDES/ FECAMP / CECON‑IE‑UNICAMP / IE‑UFRJ, 2009.
SAE – SECRETARIA DE ACOMPANHAMENTO ECONÔMICO. Report of the Special
Com-mission for the Definition of Middle Class in Brazil (Relatório da Comissão para Definição
da Classe Média no Brasil). Brasília: Ministério da Fazenda/SAE, 2012, mimeo.
SCALON, C.; SALATA, A. Uma nova classe média no Brasil da última década? O debate a partir
da perspectiva sociológica. Sociedade e Estado, v. 27. n. 2, 2012.
SCIRÉ, C. D. O. Financeirização da pobreza: crédito e endividamento no âmbito das práticas
populares de consumo. Teoria & Pesquisa, v. 20, n. 1, 2011. Available at: <http://www.teoria‑
epesquisa.ufscar.br/index.php/tp/article/viewFile/244/182>. Accessed on: June 30, 2012. SOUZA, J. The “new middle class” or the “new working class”? Who are these new Brazilian
“fighters”? Poverty in Focus, International Policy Center for Inclusive growth, UNDP, n. 26,
Appendix – Scoring scale and
thresholds for the Brazil Criterion
Table 1 – Brazil Criterion scoring scale
Possession of goods or services in the household Points per Quantity of items
0 1 2 3 4
Television 0 1 2 3 4
DVD player 0 2 2 2 2
Radio 0 1 2 3 4
Bathroom 0 4 5 6 7
Car 0 4 7 9 9
Housemaid 0 3 4 4 4
Washing machine 0 2 2 2 2
Refrigerator 0 4 4 4 4
Freezer 0 2 2 2 2
Head of household education level Points
Illiterate up to 4th grade 0
From 5th grade to 8th grade 1
Middle school 2
Secondary school 4
University degree 8
Table 2 – Thresholds for the Brazil Criterion scale
Strata Thresholds (points)
A1 42 to 46
A2 35 to 41
B1 29 to 34
B2 23 to 28
C1 18 to 22
C2 14 to 17
D 8 to13