Article
J. Braz. Chem. Soc., Vol. 26, No. 9, 1781-1789, 2015. Printed in Brazil - ©2015 Sociedade Brasileira de Química 0103 - 5053 $6.00+0.00
A
*e-mail: [email protected]
Solubility and Bioaccessibility of Ba, Ca, Cr, Cu, Fe, Mg, Mn, P, Sr and Zn in Slim
Coffee Infusions by
in vitro
Gastrointestinal Digestion
Anna Szymczycha-Madeja,* Maja Welna and Pawel Pohl
Department of Analytical Chemistry and Chemical Metallurgy, Faculty of Chemistry, Wroclaw University of Technology, Smoluchowskiego 23, 50-372 Wroclaw, Poland
Solubility and bioaccessibility of Ba, Ca, Cr, Cu, Fe, Mg, Mn, P, Sr and Zn in slim coffees were investigated using an in vitro method. Two different compositions of solutions simulating gastric and intestinal juices were tested: SGJ1 + SIJ1 (0.02% pepsin in 0.10 mol L-1 HCl; 0.015% pancreatin with 0.15% bile salts in 0.10 mol L-1 NaHCO
3) and SGJ2 + SIJ2 (0.32% pepsin with 0.20% NaCl in 0.08 mol L-1 HCl; 0.40% pancreatin with 2.5% bile salts in 0.10 mol L-1 NaHCO
3). Soluble and bioaccessible fractions (in %) in reference to total concentrations of studied elements in infusions were as follows: Ba (81.2, 34.2), Ca (84.4, 44.5), Cr (80.1, 44.8), Cu (69.2, 24.1), Fe (72.5, 6.6), Mg (89.5, 69.6), Mn (44.3, 28.4), P (96.6, 84.6), Sr (85.9, 46.8), Zn (80.8, 59.5). These results suggest that slim coffees are not a rich source of minerals.
Keywords: slim coffee, solubility, bioaccessibility, in vitro gastrointestinal digestion, ICP OES
Introduction
The information on the total concentration of elements, i.e., minerals, micronutrients or trace elements, in food and beverages is usually used to assess their quality and safety or to differentiate types of these products. On the other hand, results of the total content analysis are commonly considered to judge the nutritional value of food and the degree of the coverage of daily dietary intakes of various elements. Unfortunately, such a treatment is not entirely justified and cannot be either decisive when considering the uptake of elements from food and their role in the human nutrition. The uptake of elements depends on their contents in food products and beverages and mechanisms of their intake from the gastrointestinal tract. Metal ions released from digested food products and beverages can exist in the intestine in the form of labile species, and/or
soluble complexes with various simple inorganic ligands.1
The nature of such complexes allows to quickly transfer metal ions to the specific pumps or channels located in the
walls of intestine cells.2 In view of this, the estimation of the
bioaccessibility of elements is quite important and should
be evaluated through the in vitro assay under conditions
simulating the physiology of the stomach and intestines.
So far, different in vitro methods have been used to
predict the bioaccessibility of elements from a few food products and beverages, including human, cow, goat,
sheep and soybean milks,3-6 infant formulas,2,3 baby foods,7
milk-based fruit beverages,8 chocolate drink powder,9 fruit
juices,10-12 fruits and vegetables,13 honeys,14 tea,15 herbal
medicines,16 hazelnuts, walnuts and kernels,1 whole grain
tea-biscuits,17 school meals,18 bread,13,19 white cheeses13
and edible seaweeds.20
Unfortunately, standardized or validated methods of the bioaccessibility assays are not available. In the majority of works, a two-step procedure with solutions of amylase, pepsin, pancreatin, bile salts and inorganic compounds or normal gastric juices was used to simulate the digestive process occurring in the stomach and the intestine. The gastric digestion was usually imitated using solutions of pepsin at concentrations in the range of 0.001-16%. This enzyme solution was prepared in a dilute HCl solution (pH ca. 2). The next step, mimicking the intestinal digestion, was frequently carried out using a mixture of pancreatin and bile salts adjusted to pH ca. 7 by the addition of a
Na2CO3 solution (0.1 or 1.0 mol L
-1). The concentrations
of pancreatin and bile salts were typically within the range of 0.015-3.04% and 0.15-2.8%, respectively. All
the gastrointestinal digestions were performed at 37 oC,
(e.g., in a water bath), mimicking gastric and intestinal peristalsis, was typically in the range of 50 min-4 h and 30 min-24 h, respectively. Nevertheless, in most published
works 2 h incubations have been used. After the in vitro
digestion, elements released into solution were separated at each step by centrifugation, ultrafiltration and/or dialysis. The detailed information about reported experimental
conditions of in vitro gastrointestinal digestions, used to
prepare different food samples prior to their elemental analysis by atomic spectrometry methods, is given in the Supplementary Information (Table S1).
Nowadays, an interest in the consumption of specific coffees, e.g., slim coffees, can be observed. These particular coffees, being a mixture of instant coffee and various additional bioactive components, are preferred by people, who wish to reduce their weight. In our recent
study,21 a simple and fast method of the multi-element
analysis of these products using inductively coupled plasma optical emission spectrometry (ICP OES) was developed and validated for the first time. Therefore, due to a growing popularity in consumption of such functional beverages and their intake, we have decided to extend our recent investigation by determining the solubility and the bioaccessibility of physiologically and nutritionally important macro- (Ca, Mg, P), essential trace (Cu, Fe, Mn, Zn) and non-essential trace (Ba, Cr, Sr) elements in
slim coffee products. An in vitro gastrointestinal digestion
method was used under conditions selected based on the mentioned comparison made for different food products and beverages.
Experimental
Samples
Six instant slim coffee products were selected for analysis. All coffees were purchased from a local pharmacy (Wrocław, Poland). A detailed description of analyzed
coffee products is below: (i) Slim Coffee Classic (SCC).
Ingredients: instant chicory, maltodextrin, guarana extract,
Garcina cambogia extract containing hydroxycitric acid,
green tea extract, tiramisu aroma; (ii) Slim Coffee Detox
(SCDe). Ingredients: instant chicory, maltodextrin, wheat
dextrin Nutriose®, guarana extract containing caffeine,
fig prickly pear cactus extract CactilNeaTM, Bacillus
coagulans LactoSporeTM culture, ginger; (iii) Slim Coffee
Diabetic (SCDi). Ingredients: instant chicory, palatinose (isomaltulose), white mulberry extract, ginseng extract,
cinnamon bark extract, cinnamon; (iv) Slim Coffee (SC).
Ingredients: caffeine, guarana extract, Camellia sinensis
extract, Garcina cambogia fruits extract containing
hydroxycitric acid, instant chicory; (v) Coffee Slimmer (CS).
Ingredients: instant coffee (Coffea arabica), green coffee
extract (Coffea robusta), chromium chloride; (vi) Green
Coffee (GC). Ingredients: instant coffee substitute (roasted barley and rye), fiber (inulin), instant coffee, green coffee extract containing chlorogenic acid, L-carnitine, aroma.
Several packages of a certain brand of slim coffee were randomly selected, then mixed together to prepare a laboratory sample. Analytical samples were taken from laboratory samples. Before the analysis, laboratory samples were stored in polyethylene (PE) containers at 4 ºC.
Reagents
All chemicals were of analytical grade. A concentrated
HCl solution and solid NaHCO3 and NaCl were supplied by
POCH SA (Gliwice, Poland). Pepsin from porcine gastric
mucosa (800-2500 units mg-1 of protein), pancreatin from
porcine pancrease, and bile salts were provided by Sigma-Aldrich Chemie GmbH (Steinheim, Germany). A
multi-element (1000 µg mL-1) ICP standard solution was supplied
by Merck (Darmstadt, Germany). For gastrointestinal digestion, solutions of simulated gastric (SGJ) and intestinal (SIJ) juices were prepared using solid reagents. Freshly prepared solutions of both digestive enzymes were used in experiments. Working standard solutions of studied elements (Ba, Ca, Cr, Cu, Fe, Mg, Mn, P, Sr and Zn) were used to prepare multi-element matrix-matching (in reference to amounts of SGJ and SIJ solutions) standard solutions for
calibration. Deionized water (18.3 MΩ cm) was obtained
from an EASYpureTM water purification system (Barnstead
Thermolyne Corporation, Dubuque, IA, USA).
Instrumentation
An inductively coupled plasma optical emission spectrometer JY 38S (Jobin Yvon, Longjumeau, France) was used to measure concentrations of Ba, Ca, Cr, Cu, Fe, Mg, Mn, P, Sr and Zn in all solutions. Operating parameters were as follows: 1.2 kW of a radio frequency (RF) power,
15.0 L min-1 of a plasma flow rate, 0.20 L min-1 of a
sheath-gas flow rate and 0.25 L min-1 of a nebulizing gas
flow rate and a sample uptake flow rate of 0.75 mL min-1.
An Elpin (Katowice, Poland) thermostatic water bath shaker (type 357) was used in incubation experiments. An MPW-350 centrifuge (MPW Med. Instruments, Warsaw, Poland) was used to separate incubates of coffee treated with SGJ and SIJ solutions. A Novagen U-tube concentrator (Merck) with a molecular weight cut-off (MWCO) filter of 10 kDa was used to separate the bioaccessible fraction (< 10 kDa) of analyzed elements from incubates of slim coffee infusions by ultrafiltration.
Preparation of slim coffee infusion
For preparation of slim coffee infusions, 6.0 g of each coffee were placed in 250 mL Pyrex glass beakers. They were poured with 150 mL of boiled deionized water and stirred. After 10 min of brewing, resulting infusions were filtered through 0.45 µm syringe filters. For each slim coffee brand, 3 independent infusions were prepared. In addition, respective procedural/reagent blanks were prepared. Resulting infusions were analyzed by ICP OES for total concentrations of Ba, Ca, Cr, Cu, Fe, Mg, Mn, P, Sr and Zn.
In vitro gastrointestinal digestion of slim coffee infusions
Portions of infusions of slim coffees (20 mL) were
adjusted to pH 2 with a 1.0 mol L-1 HCl solution. Then,
3.0 mL of an SGJ solution were added for in vitro
simulation of gastric digestion. Samples were incubated
in a temperature-controlled shaking water bath at 37 oC
with agitation (250 rpm) for 2 h. The enzymatic reaction was stopped by placing sample tubes into an ice bath for 10 min. Then, pH of resulting gastric digests was increased
to 7.0 by adding an adequate volume of a 0.10 mol L-1
NaHCO3 solution and 3.0 mL of an SIJ solution were added
to simulate intestinal digestion. Incubation was continued
for the next 2 h at 37 oC with agitation (250 rpm). To stop
the enzymatic reaction, sample tubes were placed for 10 min into the ice bath. Final incubates were centrifuged (10 min, 12.000 rpm), filtered over 0.45 µm syringe filters and then through 10 kDa MWCO U-tube concentrators. The whole procedure for separating and determining the soluble and the bioaccessible fractions of studied elements is schematically shown in Figure 1.
For each slim coffee brand infusions were prepared in duplicate samples. For each freshly prepared infusion, the gastrointestinal digestion procedure was repeated twice.
Collected portions of filtrates (n = 4) (“< 0.45 µm”) and
permeates (n = 4) (“< 10 kDa” fraction) were analyzed by ICP OES to evaluate contributions of, respectively, soluble and bioaccessible fractions of Ba, Ca, Cr, Cu, Fe, Mg, Mn, P, Sr and Zn. Results were averaged and corrected for values of respective procedural blanks.
Contributions of soluble or bioaccessible fractions of elements were calculated as 100 × B / T, where B is their
concentration (in µg mL-1) determined in filtrates that
passed 0.45 µm filters (the soluble fraction) and permeates
that passed 10 kDa MWCO ultrafiltration membranes (the bioaccessible fraction) and T is their total concentration
determined in infusions (in µg mL-1).
Results and Discussion
Optimization of in vitro gastrointestinal digestion of slim coffee infusions
To assess contributions of soluble and bioaccessible fractions of Ba, Ca, Cr, Cu, Fe, Mg, Mn, P, Sr and Zn, one selected instant slim coffee, i.e., Coffee Slimmer, was
subjected to gastrointestinal digestion taking into account
in vitro protocols previously reported for different food
samples.3,5,6,11,14,16,18-20,22 In case of slim coffee products,
a mechanical process of chewing was ignored as a coffee brew rapidly passes from mouth to stomach. As
recommended by Cautela et al.10 for fruit juices, a digestive
process included only gastrointestinal steps. In this study, two different compositions of gastrointestinal solutions were used, i.e., SGJ1 + SIJ1 and SGJ2 + SIJ2.
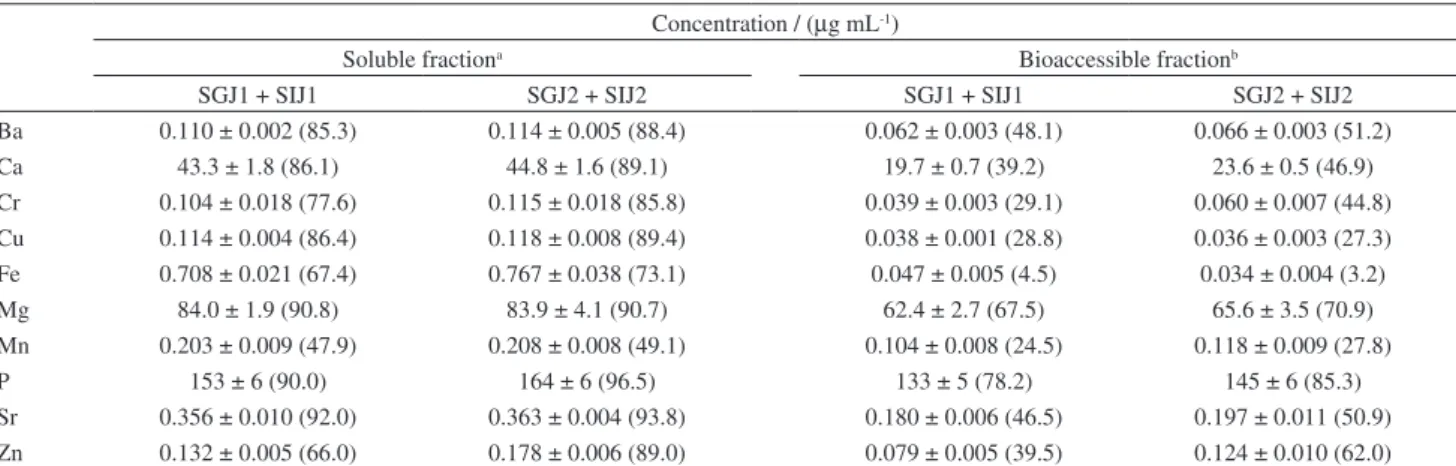
Results related to concentrations of studied elements in soluble and bioaccessible fractions separated from gastrointestinal digested infusions of slim coffee Coffee Slimmer are presented in Table 1.
As can be seen, precision of results, expressed as the relative standard deviation (RSD), for the soluble fraction of all elements obtained applying SGJ1 with SIJ1 solutions are comparable to this achieved when using SGJ2 with SIJ2 solutions. RSDs vary from 1.8 to 4.4% and 1.1 to 6.8% for SGJ1 with SIJ1 and SGJ2 with SIJ2 solutions, respectively. The only exception is Cr, for which evidently higher RSDs, i.e., 17 and 16%, were achieved when using SGJ1 with SIJ1 and SGJ2 with SIJ2, respectively. In case of the bioaccessible fraction of studied elements, precision obtained when using both compositions of gastrointestinal solutions were comparable and ranged between 2.6-7.7% and 2.1-8.3%, respectively for SGJ1 with SIJ1 and SGJ2 with SIJ2. Only for Fe, higher RSDs were obtained (11 and 12% for SGJ1 with SIJ1 and SGJ2 with SIJ2 solutions, respectively), probably due to a low concentration of this element in Coffee Slimmer. Additionally, a higher RSD (up to 12%) was found for the determination of the bioaccessible fraction of Cr obtained after the use of SGJ2 with SIJ2 solutions.
Results of percentage contributions of the soluble and the bioaccessible fractions of studied elements, obtained with the aid of two different gastrointestinal solutions, i.e., SGJ1 with SIJ1 and SGJ2 with SIJ2, were compared
using the paired t-test at the 95% level of significance.23
Importantly, before the application of the paired t-test, the
one-tailed Snedecor-Fisher F-test was used to compare
the standard deviations, because two mean values can be
compared using the t-test only if irrelevant differences in
variance for comparing sets of results (F-test) are present.
The critical parameter for this test (Fcritical) at the 95.0%
significance level (p = 0.05) was 19.00.23
It was found that in most cases differences between results obtained for the soluble fraction of elements using SGJ1 with SIJ1 and SGJ2 with SIJ2 solutions were statistically insignificant. Calculated values of the paired
t-test (tcalculated) were lower than the critical value (tcritical)
equal to 2.447. Only in case of Fe, P and Zn, mentioned differences in percentage contributions of their soluble fraction were statistically significant. For the bioaccessible fraction of elements, only for 4 out of 10 elements investigated here, i.e., Ba, Cu, Mg and Mn, differences between their percentage contributions resulted from applying SGJ1 with SIJ1 and SGJ2 with SIJ2 solutions were also statistically insignificant. For other elements, including Ca, Cr, Fe, P, Sr and Zn, results were statistically significant (see Table S2).
Considering results obtained it seems that concentrations of enzymes in solutions of simulated gastric and intestinal juices are critical for the study of solubility and bioaccessibility of elements from slim coffee products. The highest average percentage contributions of soluble and bioaccessible fractions of elements were obtained
Table 1. Concentrations of elements in the soluble and the bioaccessible fractions distinguished in gastrointestinal digested infusions of slim coffee Coffee Slimmer
Concentration / (µg mL-1)
Soluble fractiona Bioaccessible fractionb
SGJ1 + SIJ1 SGJ2 + SIJ2 SGJ1 + SIJ1 SGJ2 + SIJ2
Ba 0.110 ± 0.002 (85.3) 0.114 ± 0.005 (88.4) 0.062 ± 0.003 (48.1) 0.066 ± 0.003 (51.2)
Ca 43.3 ± 1.8 (86.1) 44.8 ± 1.6 (89.1) 19.7 ± 0.7 (39.2) 23.6 ± 0.5 (46.9)
Cr 0.104 ± 0.018 (77.6) 0.115 ± 0.018 (85.8) 0.039 ± 0.003 (29.1) 0.060 ± 0.007 (44.8) Cu 0.114 ± 0.004 (86.4) 0.118 ± 0.008 (89.4) 0.038 ± 0.001 (28.8) 0.036 ± 0.003 (27.3)
Fe 0.708 ± 0.021 (67.4) 0.767 ± 0.038 (73.1) 0.047 ± 0.005 (4.5) 0.034 ± 0.004 (3.2)
Mg 84.0 ± 1.9 (90.8) 83.9 ± 4.1 (90.7) 62.4 ± 2.7 (67.5) 65.6 ± 3.5 (70.9)
Mn 0.203 ± 0.009 (47.9) 0.208 ± 0.008 (49.1) 0.104 ± 0.008 (24.5) 0.118 ± 0.009 (27.8)
P 153 ± 6 (90.0) 164 ± 6 (96.5) 133 ± 5 (78.2) 145 ± 6 (85.3)
Sr 0.356 ± 0.010 (92.0) 0.363 ± 0.004 (93.8) 0.180 ± 0.006 (46.5) 0.197 ± 0.011 (50.9) Zn 0.132 ± 0.005 (66.0) 0.178 ± 0.006 (89.0) 0.079 ± 0.005 (39.5) 0.124 ± 0.010 (62.0)
aAverage value (n = 4) ± standard deviation (SD) (soluble fraction contribution / %); baverage value (n = 4) ± SD (bioaccessible fraction contribution / %).
SGJ1: 0.02% pepsin in 0.10 mol L-1 HCl; SIJ1: 0.015% pancreatin with 0.15% bile salts in 0.10 mol L-1 NaHCO
3; SGJ2: 0.32% pepsin with 0.20% sodium
with the use of SGJ2 with SIJ2 solutions. Therefore, this composition of gastrointestinal solutions was chosen to examine other slim coffees analyzed here.
Solubility of elements from slim coffee infusions
Table 2 presents concentrations of studied elements
in infusions of slim coffees, and soluble (“< 0.45 µm”)
and bioaccessible (“< 10 kDa”) fractions as separated and determined in infusions by the gastrointestinal digestion procedure developed here. Additionally, percentage contributions of soluble and bioaccessible fractions of elements are given.
As it can be seen, precision of measurements varies from 0.2 to 6.8%. The only exception is Cr, for which RSDs exceed 10%. Limits of detection (LODs) of elements, calculated as concentrations corresponding to signals equal to 3 times standard deviations of 10 replicates of
respective blank solutions (3σ criterion), determined for
the soluble fraction were 2.5 (Ba), 17 (Ca), 0.90 (Cu), 1.5 (Cr), 0.92 (Fe), 2.0 (Mg), 0.66 (Mn), 146 (P), 0.12 (Sr)
and 1.6 (Zn) ng mL-1.
In general, concentrations of elements in the soluble fraction likely varied due to a coffee brand and contribution of different ingredients. The highest concentrations of most elements in the soluble fraction were determined in Coffee Slimmer (Ba, Cr, Cu, Mg, P, Sr) and Slim Coffee (Ca, Fe, Mn, Zn). The lowest contents of elements in this fraction were found in Green Coffee (Ca, Fe, Mg, Mn, Sr, Zn). The concentration of Cr in Slim Coffee Detox, Slim Coffee Diabetic, Green Coffee was below its LOD.
It was established that solubility (%) of macro-elements fulfilled the following order: P > Mg > Ca. The exception was Slim Coffee Detox, for which a different relation
was noticed, i.e., P > Ca ≈ Mg. Solubility of essential
trace elements, i.e., Cu, Fe, Mn and Zn, can be arranged as follows: Zn > Fe > Cu > Mn. In case of Slim Coffee Classic and Coffee Slimmer, solubility of mentioned elements followed another pattern: Cu > Zn > Fe > Mn. The relation between solubilities of non-essential trace elements differed markedly between types of slim coffees and could be ascribed: Sr > Ba > Cr for Slim Coffee Diabetic, Slim Coffee and Coffee Slimmer, Ba > Sr > Cr for Slim Coffee Detox and Green Coffee, and Sr > Cr > Ba for Slim Coffee Classic.
None of elements was 100% soluble because average contributions of their soluble fractions ranged between 44.3-96.6%. The highest contributions of the soluble fraction (> 85%) were established for Mg and P. Solubility of Ca was slightly lower and varied within 68.0-91.0%. Solubility of Sr (79.8-94.2%), Zn (74.8-89.0%) and
Ba (72.6-88.4%) was also high. In case of Cu, the average contribution of this fraction was 69.2% with the lowest and highest values of 48.0 and 89.4%, respectively. Solubility of Fe was lower and amounted from 57.6 to 78.4%. The lowest contribution of the soluble fraction was noted for Mn, i.e., from 39.7 to 49.6%. Significant discrepancies were also noticed for Cr. Concentrations of this element in the soluble fraction changed from not detected (ND) in Slim Coffee Detox, Slim Coffee Diabetic and Green Coffee to
0.009-0.115 µg mL-1 in Slim Coffee, Slim Coffee Classic
and Coffee Slimmer that corresponded to the contribution within 72.7-85.8%.
Bioaccessibility of elements from slim coffee infusions
As can be seen from Table 2, in most cases, precision of replicated measurements is very good and varies from 0.1% (for Mg in Green Coffee) to 9.1% (for Cu in Slim Coffee Classic and Green Coffee). Only for Cr in Coffee Slimmer and for Cu in Slim Coffee Detox and Slim Coffee Diabetic, RSD values are higher, i.e., 12, 10 and 13%, respectively. LODs for elements determined in the bioaccessible fraction were 1.1 (Ba), 17 (Ca), 2.1 (Cu), 1.7 (Cr), 1.6 (Fe), 3.3 (Mg),
0.51 (Mn), 160 (P), 0.08 (Sr) and 1.4 (Zn) ng mL-1.
Bioaccessibility (%) of macro-elements can be arranged in the following descending order: P > Mg > Ca. For essential trace elements, the relation fulfilled the order: Zn > Mn > Cu > Fe. Bioaccessibility of non-essential elements decreased in the following order: Sr > Ba > Cr. It is evident from Table 2 that contributions of the bioaccessible fraction of elements are generally 1- to 3-fold lower than those observed for the soluble fraction. Only in case of Fe, a much higher discrepancy was noticed, i.e., an 8- to 23-fold lower contribution of the bioaccessible fraction than the contribution of the soluble fraction. Such low bioaccessibilities of elements as compared to their solubilities are probably due to the composition of food material, chemical forms of elements, nutrients’ interactions including element-element and element-organic content relations, and the presence of inhibitors, such as phytates, dietary fibers, proteins of plant origin, oxalates and
polyphenols.17,24 Phytates have a strong negative influence
on absorption of Ca, Cu, Fe, Mg, Mn and Zn because they form insoluble salts with ions of these elements or
co-precipitate as phytate complexes.25 Only Cu-phytate
complexes are soluble in pH of the gastro-intestinal tract.7,13
High levels of Ca in the diet reduce Fe and Zn absorption. Furthermore, bioaccessibility of Mn is inversely related to the level of Fe and Ca. High intakes of Ca and/or P may also inhibit Cu absorption. Additionally, inhibitors of Cu
Solubility and Bioaccessibility of Ba, Ca, Cr
, Cu, Fe, Mg, Mn, P
, Sr and Zn in Slim Cof
fee Infusions
J. Br
az. Chem. Soc.
Concentrationa / (µg mL-1)
Infusiona
SCC SCDe SCDi SC CS GC Minimum-Maximum Mean
Ba 0.051 ± 0.001 0.080 ± 0.003 0.085 ± 0.004 0.057 ± 0.003 0.129 ± 0.002 0.082 ± 0.002 0.051-0.129 0.081
Ca 34.8 ± 0.8 36.3 ± 0.4 48.3 ± 1.5 85.7 ± 3.1 50.3 ± 1.6 31.9 ± 1.2 31.9-85.7 47.9
Cr 0.011 ± 0.001 < LODb < LODb 0.022 ± 0.002 0.134 ± 0.003 < LODb < LODb-0.134 0.056
Cu 0.033 ± 0.002 0.037 ± 0.002 0.046 ± 0.003 0.051 ± 0.003 0.132 ± 0.006 0.077 ± 0.005 0.033-0.132 0.063 Fe 2.32 ± 0.01 2.15 ± 0.03 2.10 ± 0.09 3.42 ± 0.09 1.05 ± 0.03 0.772 ± 0.016 0.772-3.42 1.97
Mg 15.9 ± 0.4 18.5 ± 0.3 20.4 ± 0.2 26.1 ± 0.7 92.5 ± 3.4 15.0 ± 0.1 15.0-92.5 31.4
Mn 0.506 ± 0.016 0.327 ± 0.011 0.398 ± 0.002 0.645 ± 0.028 0.424 ± 0.004 0.172 ± 0.002 0.172-0.645 0.412
P 54.8 ± 1.0 64.0 ± 2.4 63.2 ± 2.6 89.9 ± 2.6 170 ± 2 130 ± 1 54.8-170 95.3
Sr 0.261 ± 0.012 0.426 ± 0.008 0.342 ± 0.016 0.416 ± 0.016 0.387 ± 0.016 0.247 ± 0.009 0.247-0.426 0.346 Zn 0.245 ± 0.006 0.231 ± 0.011 0.326 ± 0.014 0.324 ± 0.012 0.200 ± 0.002 0.198 ± 0.006 0.198-0.326 0.254
Soluble fractionc
SCC SCDe SCDi SC CS GC Minimum-Maximum Mean
Ba 0.037 ± 0.002 (72.6) 0.064 ± 0.001 (80.0) 0.066 ± 0.001 (77.6) 0.046 ± 0.001 (80.7) 0.114 ± 0.005 (88.4) 0.072 ± 0.003 (87.8) 0.037-0.114 (72.6-88.4) 0.067 (81.2) Ca 30.7 ± 1.2 (88.2) 32.4 ± 0.1 (89.3) 38.9 ± 0.7 (80.5) 78.0 ± 1.4 (91.0) 44.8 ± 1.6 (89.1) 21.7 ± 0.8 (68.0) 21.7-78.0 (68.0-91.0) 41.1 (84.4) Cr 0.009 ± 0.001 (81.8) < LODd (–)e < LODd (–)e 0.016 ± 0.002 (72.7) 0.115 ± 0.018 (85.8) < LODd (–)e < LODd-0.115 (<72.7-85.8) 0.047 (80.1)
Cu 0.028 ± 0.001 (84.8) 0.028 ± 0.001 (75.7) 0.026 ± 0.001 (56.5) 0.031 ± 0.002 (60.8) 0.118 ± 0.008 (89.4) 0.037 ± 0.002 (48.0) 0.026-0.118 (48.0-89.4) 0.045 (69.2) Fe 1.82 ± 0.02 (78.4) 1.67 ± 0.02 (77.7) 1.60 ± 0.06 (76.2) 2.46 ± 0.07 (71.9) 0.767 ± 0.038 (73.1) 0.445 ± 0.007 (57.6) 0.445-2.46 (57.6-78.4) 1.46 (72.5) Mg 14.6 ± 0.4 (91.8) 16.5 ± 0.7 (89.2) 17.7 ± 0.3 (86.8) 23.9 ± 1.2 (91.6) 83.9 ± 4.1 (90.7) 13.0 ± 0.1 (86.7) 13.0-83.9 (86.7-91.8) 28.3 (89.5) Mn 0.251 ± 0.008 (49.6) 0.131 ± 0.003 (40.1) 0.158 ± 0.006 (39.7) 0.281 ± 0.002 (43.6) 0.208 ± 0.008 (49.1) 0.075 ± 0.002 (43.6) 0.075-0.281 (39.7-49.6) 0.184 (44.3) P 53.0 ± 1.2 (96.7) 62.1 ± 0.7 (97.0) 61.9 ± 0.1 (97.9) 84.9 ± 2.7 (94.4) 164 ± 6 (96.5) 126 ± 2 (96.9) 53.0-164 (94.4-97.9) 92.0 (96.6) Sr 0.246 ± 0.003 (94.2) 0.340 ± 0.008 (79.8) 0.282 ± 0.004 (82.5) 0.343 ± 0.003 (82.4) 0.363 ± 0.004 (93.8) 0.204 ± 0.001 (82.6) 0.204-0.363 (79.8-94.2) 0.296 (85.9) Zn 0.201 ± 0.008 (82.0) 0.183 ± 0.007 (79.2) 0.251 ± 0.001 (77.0) 0.269 ± 0.001 (83.0) 0.178 ± 0.006 (89.0) 0.148 ± 0.005 (74.8) 0.148-0.269 (74.8-89.0) 0.205 (80.8)
Bioaccessible fractionf
SCC SCDe SCDi SC CS GC Minimum-Maximum Mean
Ba 0.018 ± 0.001 (35.3) 0.019 ± 0.001 (23.8) 0.028 ± 0.001 (32.9) 0.018 ± 0.001 (31.6) 0.066 ± 0.003 (51.2) 0.025 ± 0.001 (30.5) 0.018-0.066 (23.8-51.2) 0.029 (34.2) Ca 18.3 ± 0.5 (52.6) 17.1 ± 0.4 (47.1) 21.6 ± 0.1 (44.7) 44.6 ± 1.0 (52.0) 23.6 ± 0.5 (46.9) 7.56 ± 0.14 (23.7) 7.56-44.6 (23.7-52.6) 22.1 (44.5) Cr < LODg (–)e < LODg (–)e < LODg (–)e < LODg (–)e 0.060 ± 0.007 (44.8) < LODg (–)e < LODf-0.060 (<44.8) –e (–)e
Cu 0.011 ± 0.001 (33.3) 0.010 ± 0.001 (27.0) 0.008 ± 0.001 (17.4) 0.013 ± 0.001 (25.5) 0.036 ± 0.003 (27.3) 0.011 ± 0.001 (14.3) 0.008-0.036 (14.3-33.3) 0.015 (24.1) Fe 0.215 ± 0.001 (9.3) 0.212 ± 0.007 (9.9) 0.106 ± 0.007 (5.1) 0.227 ± 0.013 (6.6) 0.034 ± 0.004 (3.2) 0.042 ± 0.003 (5.4) 0.034-0.227 (3.2-9.9) 0.139 (6.6) Mg 12.4 ± 0.1 (78.0) 14.0 ± 0.1 (75.7) 13.5 ± 0.1 (66.2) 18.8 ± 0.8 (72.0) 65.6 ± 3.5 (70.9) 8.24 ± 0.01 (54.9) 8.24-65.6 (54.9-78.0) 22.1 (69.6) Mn 0.178 ± 0.003 (35.2) 0.101 ± 0.004 (30.9) 0.097 ± 0.004 (24.4) 0.200 ± 0.001 (31.0) 0.118 ± 0.009 (27.8) 0.036 ± 0.001 (20.9) 0.036-0.200 (20.9-35.2) 0.122 (28.4) P 48.0 ± 0.9 (87.6) 57.4 ± 3.0 (89.7) 52.8 ± 1.5 (83.5) 68.1 ± 2.4 (75.8) 145 ± 6 (85.3) 111 ± 2 (85.4) 48.0-145 (75.8-89.7) 80.4 (84.6) Sr 0.146 ± 0.011 (55.9) 0.207 ± 0.003 (48.6) 0.157 ± 0.006 (45.9) 0.216 ± 0.002 (51.9) 0.197 ± 0.011 (50.9) 0.068 ± 0.001 (27.5) 0.068-0.216 (27.5-55.9) 0.165 (46.8) Zn 0.163 ± 0.008 (66.5) 0.138 ± 0.008 (59.7) 0.167 ± 0.007 (51.2) 0.204 ± 0.012 (63.0) 0.124 ± 0.010 (62.0) 0.108 ± 0.003 (54.6) 0.108-0.204 (51.2-66.5) 0.151 (59.5)
aAverage value (n = 3) ± standard deviation (SD); bbelow the limit of detection (LOD) (0.97 ng mL-1); caverage value (n = 3) ± SD (soluble fraction contribution / %); dbelow the limit of detection (1.5 ng mL-1); enot calculated; faverage value (n = 3) ± SD (bioaccessible fraction contribution / %); gbelow the limit of detection (1.7 ng mL-1). SCC: Slim Coffee Classic; SCDe: Slim Coffee Detox; SCDi: Slim Coffee
bioaccessibility of Fe in slim coffees can be attributed to the presence of polyphenols, which avidly bind trivalent
ions of Fe and prevent their intestinal absorption.15
The average contribution of the bioaccessible fraction of Ba, Ca, Cu, Cr, Fe, Mn, Sr and Zn was considerably lower than 60%. Only in case of Mg and P, the average contribution of this fraction was higher than 65%. Indeed, both elements were established to be released in the largest quantities under gastro-intestinal conditions. Contributions of the bioaccessible fraction changed from 54.9% (Green Coffee) to 78.0% (Slim Coffee Classic) for Mg and from 75.8% (Slim Coffee) to 89.7% (Slim Coffee Detox) for P. Results obtained for Mg were in a good agreement
with those previously reported by Powell et al.15 for black
tea infusions. The outcome of bioaccessibility of P was generally comparable to the reported for milk-based fruit
beverages,8 but about 2.5-fold higher than the reported for
chocolate drink powder.9
As compared to Mg, quantities of released Mg were lower that corresponded to contributions of the bioaccessible fraction of this element in the range from 23.7% (Green Coffee) to 52.6% (Slim Coffee Classic). Among essential trace elements studied, the highest bioaccessibility was assessed for Zn, i.e., from 51.2% (Slim Coffee Diabetic) to 66.5% (Slim Coffee Classic).
Szentmihalyi et al.26 established that bioaccessibility of
Zn from herbal remedies was within a little bit lower range, i.e., 42.5-46.1%. Additionally, our results for Zn are significantly higher than those reported for different types
of milks,6 infant formulae,4 baby foods7 and school meals,18
where bioaccessibility of Zn was assessed to be within 1-34%. Contributions of the bioaccessible fraction of Mn and Cu were in the range of 20.9-35.2% and 14.3-33.3%, respectively. The highest bioaccessibility of both elements was found in Slim Coffee Classic, whereas the lowest one
was in Green Coffee. Obtained results for Mn and Cu are in an agreement with those reported for decoctions of different
herbal medicines,16 but are slightly lower than those
obtained in the study of tea infusions.15 For all analyzed
slim teas, bioaccessibility of Fe was the lowest and varied from 3.2% (Coffee Slimmer) to 9.9% (Slim Coffee Detox). This was, however, similar to results on bioaccessibility of
Fe found in tea infusions,15 herbal medicines decoctions,16
as well as vegetables,13 infant formula and human milk,4
and school meals.18
Non-essential elements (Ba, Sr and Cr) were moderately bioaccessible from analyzed slim coffees. Bioaccessibility of Ba ranged from 23.8% (Slim Coffee Detox) to 51.2% (Coffee Slimmer). This value was higher than the one
reported for chocolate drink powder,9 but in a quite good
agreement with a finding of Szentmihalyi et al.26 for herbal
remedies. Bioaccessibility of Sr was slightly higher than this for Ba and varied between 27.5% (Green Coffee) and 55.9% (Slim Coffee Classic). Chromium was determined only in the bioaccessible fraction in Coffee Slimmer and its bioaccessibility amounted to 44.8%.
All results showed that bioaccessibility of elements such as Ca, Cu, Mg, Mn, Sr and Zn from Green Coffee was much lower than those from other analyzed slim coffees. This could be related to a specific composition of Green Coffee, i.e., the content of barley, rye and fiber, which
inhibit absorption of elements.25
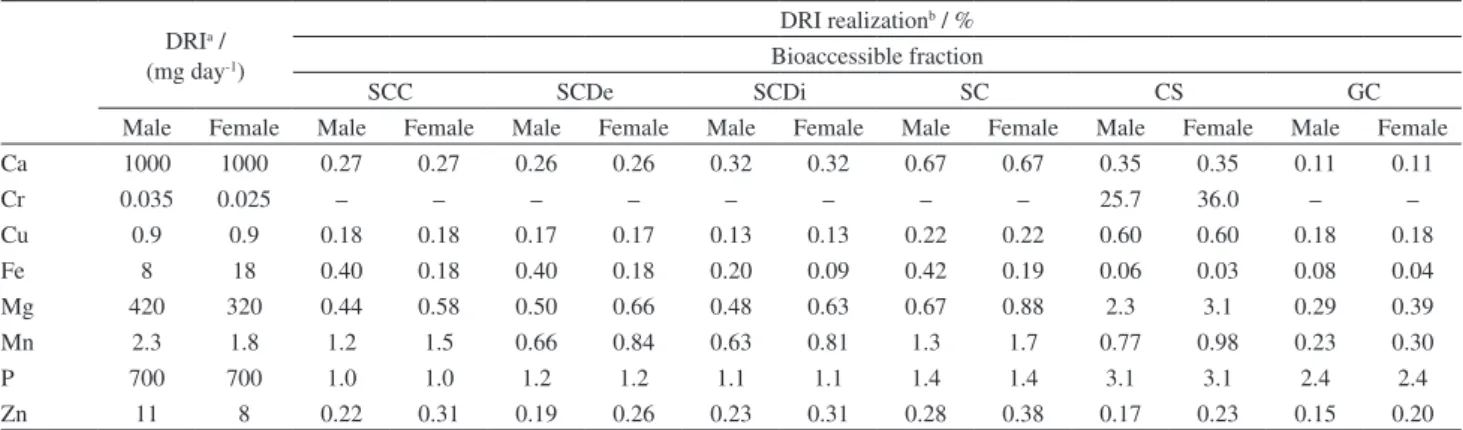
Dietary reference intakes (DRIs) for elements (i.e., recommended dietary allowances, tolerable upper intake
levels) for individuals in the 31-50 life stage group27 can serve
for evaluating nutrition characteristics of examined slim coffees (see Table 3). Based on results of the bioaccessible fraction of elements, it appears that consumption of a cup of different slim coffees (6.0 g of coffee brewed with 150 mL of boiling water) slightly covers DRIs of Ca (0.11-0.67%),
Table 3. Contribution of slim coffee infusions to DRI of examined elements related to the daily consumption of 1 cup of slim coffee
DRIa /
(mg day-1)
DRI realizationb / %
Bioaccessible fraction
SCC SCDe SCDi SC CS GC
Male Female Male Female Male Female Male Female Male Female Male Female Male Female
Ca 1000 1000 0.27 0.27 0.26 0.26 0.32 0.32 0.67 0.67 0.35 0.35 0.11 0.11
Cr 0.035 0.025 – – – – – – – – 25.7 36.0 – –
Cu 0.9 0.9 0.18 0.18 0.17 0.17 0.13 0.13 0.22 0.22 0.60 0.60 0.18 0.18
Fe 8 18 0.40 0.18 0.40 0.18 0.20 0.09 0.42 0.19 0.06 0.03 0.08 0.04
Mg 420 320 0.44 0.58 0.50 0.66 0.48 0.63 0.67 0.88 2.3 3.1 0.29 0.39
Mn 2.3 1.8 1.2 1.5 0.66 0.84 0.63 0.81 1.3 1.7 0.77 0.98 0.23 0.30
P 700 700 1.0 1.0 1.2 1.2 1.1 1.1 1.4 1.4 3.1 3.1 2.4 2.4
Zn 11 8 0.22 0.31 0.19 0.26 0.23 0.31 0.28 0.38 0.17 0.23 0.15 0.20
aDRI: dietary recommended intake for a 31-50 year life stage group (males and females); bone cup of slim coffee was considered: 6.0 g of powdered coffee
Cu (0.13-0.60%), Fe (0.03-0.42%), Mg (0.29-3.1%), Mn (0.23-1.7%), P (1.0-3.1%) and Zn (0.15-0.38%). This tends to a conclusion that slim coffee products are not a rich source of macro- and essential elements. Only in case of Cr in Coffee Slimmer (this slim coffee is artificially doped with
CrCl3), the concentration of this element in the bioaccessible
fraction contributes to the highest DRI realization, i.e., 25.7 and 36.0% for males and females, respectively.
Conclusions
In this work, the solubility and the bioaccessibility of macro- (Ca, Mg, P), essential trace (Cu, Fe, Mn, Zn) and non-essential trace (Ba, Cr, Sr) elements of slim coffee
products were evaluated for the first time by the in vitro
gastrointestinal digestion. Results of this study demonstrate that concentrations of enzymes in solutions of simulated gastric and intestinal juices are critical for the study of the solubility and the bioaccessibility of these elements. Additionally, the solubility and the bioaccessibility depend on the element studied and the sample matrix. In general, solubilities of elements are 1- to 3-fold higher than their respective bioaccessibilities. For Fe, the contribution of the soluble fraction is even 8- to 23-fold higher than the contribution of the bioaccessible fraction of this element. The average bioaccessibility of studied elements varied from 3.2 to 89.7%, so the degree of the release of elements in the gastrointestinal tract, potentially absorbed by the human organism, is significantly differentiated. The highest bioaccessibility (> 65%) is noticed for Mg and P, while the lowest (< 60%) refers to Ba, Ca, Cu, Cr, Fe, Mn, Sr and Zn. In view of undertaken experiments, it appears that the slim coffee products are not a rich source of macro- and essential elements. Only for Cr, results show that its bioaccessibility assessed highly contribute to the required DRI for this element.
Supplementary Information
Supplementary information is available free of charge at http://jbcs.sbq.org.br as PDF file.
Acknowledgments
The work was funded by the National Science Centre (decision no. 2013/09/B/NZ9/00122).
References
1. Arpadjan, S.; Momchilova, S.; Venelinov, T.; Blagoeva, E.; Nikolova, M.; J. Agric. Food Chem.2013, 61, 6086.
2. Frausto da Silva, J. J. R.; Williams, R. J. P.; The Biological Chemistry of the Elements. The Inorganic Chemistry of Life, 2nd ed.; Oxford University Press: Oxford, 2001.
3. Bermejo, P.; Pena, E. M.; Domınguez, R.; Bermejo, A.; Cocho, J. A.; Fraga, J. M.; Food Chem.2002, 77, 361.
4. Bosscher, D.; Lu, Z.; Van Cauwenbergh, R.; Van Caillie-Bertrand, M.; Robberecht, H.; Deelstra, H.; Int. J. Food Sci. Nutr.2001, 52, 173.
5. Chaiwanon, P.; Puwastien, P.; Nitithamyong, A.; Sirichakwal, P. P.; J. Food Compos. Anal.2000, 13, 319.
6. Shen, L.; Robberecht, H.; Van Dael, P.; Deelstra, H.; Biol. Trace Elem. Res.1995, 49, 107.
7. da Silva, E. N.; Leme, A. B. P.; Cidade, M.; Cadore, S.; Talanta
2013, 117, 184.
8. Cilla, A.; Lagarda, M. J.; Alegria, A.; de Ancos, B.; Cano, M. P.; Sanchez-Moreno, C.; Plaza, L.; Barbera, R.; Food Res. Int.2011, 44, 3030.
9. Peixoto, R. R. A.; Mazon, E. A. M.; Cadore, S.; J. Braz. Chem. Soc.2013, 24, 884.
10. Cautela, D.; Santelli, F.; Boscaino, F.; Laratta, B.; Servilloe, L.; Castaldof, D.; J. Sci. Food Agric.2009, 89, 2283.
11. de Lima, A. C. S.; Soares, D. J.; da Silva, L. M. R.; de Figueiredo, R. W.; de Sousa, P. H. M.; Menezes, E. A.; Food Chem.2014, 161, 142.
12. Haro-Vicente, J. F.; Martinez-Gracia, C.; Ros, G.; Food Chem.
2014, 98, 639.
13. Khouzam, R. B.; Pohl, P.; Lobinski, R.; Talanta2011, 86, 425. 14. Pohl, P.; Stecka, H.; Greda, K.; Jamroz, P.; Food Chem.2012,
134, 392.
15. Powell, J. J.; Burden, T. J.; Thompson, R. P. H.; Analyst1998, 123, 1721.
16. Zhou, Y.; Gao, X.; Wu, Ch.; Wy, Y.; J. Trace Elem. Med. Biol.
2014, 28, 173.
17. Vitali, D.; Vedrina Dragojevic, I.; Sebecic, B.; Food Chem.
2008, 100, 62.
18. Camara, F.; Amaro, M. A.; Barbera, R.; Clemente, G.; Food Chem.2005, 92, 481.
19. Gawlik-Dziki, U.; Dziki, D.; Baraniak, B.; Lin, R.; LWT--Food Sci. Technol.2009, 42, 137.
20. García-Sartal, C.; Romarís-Hortas, V.; del Carmen Barciela-Alonso, M.; Moreda-Piñeiro, A.; Dominguez-Gonzalez, R.; Bermejo-Barrera, P.; Microchem. J.2011, 98, 91.
21. Szymczycha-Madeja, A.; Welna, M.; Pohl, P.; Food Chem.2014, 146, 220.
22. Romarís-Hortas, V.; García-Sartal, C.; del Carmen Barciela-Alonso, M.; Domínguez-González, R.; Moreda-Piñeiro, A.; Bermejo-Barrera, P.; Food Chem.2011, 124, 1747. 23. Miller, J. N.; Miller, J. C.; Statistics and Chemometrics for
Analytical Chemistry, 5th ed.; Pearson Education Ltd.: London,
2005.
25. Kumar, V.; Sinha, A. K.; Makkar, P. S.; Becker, K.; Food Chem.
2010, 120, 945.
26. Szentmihalyi, K.; Hajdu, M.; Fodor, J.; Kotai, L.; Blazovics, A.; Samogyi, A.; Then, M.; Biol. Trace Elem. Res. 2006, 114, 143.
27. Otten, J. J.; Hellwig, J. P.; Meyers, L. D.; Dietary Reference Intakes: the Essential Guide to Nutrient Requirements; The National Academies Press: Washington, 2006.
Submitted: March 28, 2015