Printed in Brazil - ©2007 Sociedade Brasileira de Química 0103 - 5053 $6.00+0.00
ArticleArticleArticleArticleArticle
*e-mail: [email protected]
Determination of Thallium Traces by ETAAS after On-Line Matrix
Separation and Preconcentration in a Flow Injection System
Taherah Asadoulahi, Shayessteh Dadfarnia* and Ali Mohammad Haji Shabani
Department of Chemistry, Faculty of Sciences, Yazd University, Yazd, 89195-741, Iran
Um sistema de injeção em fluxo sensível e simples foi desenvolvido para separação, pré-concentração e determinação de tálio. A pré-pré-concentração é baseada na sorção do analito em uma microcoluna de dibenzo-18-coroa-6 (DB18C6) imobilizada em alumina revestida com surfactante e subseqüente eluição com solução de ácido nítrico (500 µL, 2 mol L-1). A concentração
de tálio no eluente foi determinada por espectrometria de absorção atômica com atomização eletrotérmica. Os fatores que influenciaram a sorção e dessorção de íon tálio foram investigados. Para um volume da amostra de 5 mL, a calibração foi linear no intervalo de 0,1 a 20 µg L-1 (r =
0,9996) com um limite de detecção de 0,05 µg L-1. A capacidade máxima de sorção foi de 1432
µg de tálio por grama do sorbente. A precisão do método para 1 µg L-1 foi 5,7% RSD (n = 11). O
método foi aplicado para determinação de tálio em água, cabelo, unha e em materiais de referência certificados. A exatidão foi avaliada empregando experimentos de adição e recuperação ou por comparação dos resultados com materiais de referência certificados.
A simple and sensitive flow injection system was developed for separation, preconcentration and determination of thallium. Preconcentration is based on the analyte sorption on a microcolumn of dibenzo-18-crown-6 (DB18C6) immobilized on surfactant coated alumina with subsequent elution using a nitric acid solution (500 µL, 2 mol L-1). The concentration of thallium
in the eluent was determined using electrothermal atomic absorption spectrometry. Factors influencing the sorption and desorption of thallium ion were investigated. Using a sample volume of 5 mL, the calibration was linear from 0.1 to 20 µg L-1 range (r = 0.9996) with a detection
limit of 0.05 µg L-1. The maximum sorption capacity was 1432 µg of thallium per gram of
sorbent. The precision of the method at 1 µg L-1 was 5.7% RSD (n = 11). The method was
applied for determination of thallium in water, hair, nail, and standard reference samples. The accuracy was assessed using addition-recovery experiment or by comparison of the results with certified reference materials.
Keywords: thallium determination, immobilized crown ether, flow injection, electrothermal atomic absorption spectrometry, matrix separation, analyte preconcentration
Introduction
Thallium and its compounds are used in high tech industries such as semiconductors, low temperature thermometers, scintillation counter, nuclear medicine, dye and pigment. The main anthropogenic sources of thallium are emission from industrial processes, such as smelting of zinc and lead sulfide, and burning of coal and cement. Because of its toxicity, it was included in the list of 129 so-called “priority pollutants” by the US Environmental
Protection Agency.1 It is regarded as one of the most toxic
of the heavy metals, causing both chronic and acute
poisoning.1,2 Thus, thallium poisoning is recognized as
an industrial hazard and its monitoring in different
matrices have drawn the attention of researchers.3-6 The
extremely low concentration of thallium in environmental
sample (down to ng L-1 level) requires an analytical method
featuring high sensitivity and a low detection limit. Thallium had been determined by inductively coupled
plasma mass spectrometry (ICP- MS)6-8 and laser-excited
atomic fluorescence spectrometry (LEAFS).9 However,
ICP-MS is an expensive analytical method and incurs high
running cost, and LEAFS is less frequently used.9
Electrothermal atomic absorption spectrometry (ETAAS) appears to be the method of choice for
very sensitive and relatively simple method has been used
by several workers for determination of thallium.4,11-14
However, direct determination of thallium with ETAAS involves many difficulties because of spectral and non
spectral interference in environmental matrices.15 The
absorbance signal of thallium is seriously depressed by the presence of chloride in the graphite furnace. This is due to the formation of volatile thallium monochloride with high dissociation energy in the condense phase which is difficult to dissociate in the gas phase. The presence of sulfate and iron, a common constituent of environmental samples, cause spectral interference, because the
molecular absorption of SO2 has a maximum around the
Tl line and exhibits a pronounced rotational fine structure. Also iron has an atomic band near the resonance line of thallium. Thus, a separation/preconcentration step is beneficial for determination of thallium in real sample.
Several separation/enrichment techniques, such as
liquid-liquid extraction,11,16 flotation,17,18 separation on a
chelex 100 resin column,18 and solid phase extraction using
cellulose nitrate resin (CNR)12 or polyurethane foam20 have
been used for determination of thallium with ETAAS. However, these manual batch procedures are labor, time and reagent consuming, and require large volume of samples.
Flow injection (FI) separation and preconcentration techniques are effective for enhancing sensitivity of atomic spectrometry which provides a simple and rapid procedure for Tl determination. However, automation of
deter-mination of thallium with ETAAS is just beginning.21,22
Ivanova et al.21 reported a flow injection on-line sorption
preconcentration in a knotted reactor coupled with ETAAS
for determination of thallium. Tl3+
-tetramethylenedithio-carbamate (pyrrolidinedithio-tetramethylenedithio-carbamate) complex was sorbed on the inner walls of a PTFE knotted reactor and eluted with 45 mL of ethanol. The adsorption efficiency
of 51% and detection limit of 0.015 mg L-1 was reported.
Also, Xu et al.22 developed a sequential injection system
for on-line sorbent extraction preconcentration in ETAAS for determination of traces of thallium in geochemical
samples. The TlBr4– complex was adsorbed on a packed
microcolumn of XAD-8 resin and was eluted by injection of 50 µL of acetone. An enrichment factor of 15 and
detection limit of 18 ng L-1 was reported. Thus,
development and application of FIA-ETAAS for performing pretreatment and measurement steps for determination of thallium is still attractive area of research. Macrocyclic polyether commonly called crown ethers are ion-selective reagents that had been widely studied within
separation science.23-26 The commercially available
immobilized crown ether (Pb-Spec and Sr-Spec resin) has
been used for preconcentration of lead in various matrices.27,28
The physical immobilization of crown ether on the knotted reactor has been also used for preconcentration and separation
of palladium in tunnel dust.29 However, to the best of our
knowledge, reports on physical immobilization of crown ethers on solid supports used as the sorbent for preparation of column or microcolumn of solid phase extraction of metal
ions is rare.30
Over the past decade, the effectiveness and versatility of physically immobilization of chelating agents on surfactant coated alumina as a column preconcentration media in
batch31-33 and FIA34-36 system had been demonstrated.
However, hitherto no such study has been directed for immobilization of macrocyclic ligands. So, it was appropriate to investigate the possibility of physical immobilization of crown ether. Recent studies have confirmed the immo-bilization of dibenzo-18-crown-6 (DB18C6) on surfactant coated alumina. Also, a rapid method has been developed for matrix separation and preconcentration of thallium in different sample on FI-ETAAS.
Experimental
Reagents
All chemicals and solvents were analytical reagent grade, which were used without further purification. The chemicals were purchased from Merck Company, Germany, unless otherwise stated. Double deionized water
was used throughout. A stock solution (100 mg L-1) of Tl+
and Tl3+ was prepared by dissolving an accurate mass of
either TlNO3 or Tl(NO3)3•3H
2O into a 100 mL flask and
diluting to the mark with distilled water. Standard solutions were prepared daily from the stock solution by serial dilution with water. Pd/Mg modifier was prepared from palladium modifier solution for ETAAS and Mg
(NO3)2•6H
2O according to reference.
37,38
Alumina (10-50 µm, γ-type chromatography grade)
was purified by shaking with 5 mol L-1 nitric acid and
washing three times with water. Sodium dodecyl sulfate (SDS), dibenzo-crown-6 (DB18C6) (Fluka) and 18-crown-6 (18C6) (Fluka) were used without further purification. A 0.1% solution of DB18C6 was prepared by dissolving 100 mg of DB18C6 in acetone. Reagent
blank was prepared by processing a solution of 2 mol L-1
nitric acid through a column of immobilized DB18C6.
Apparatus
in this study. Recording of the absorbance signal profile was done with a PC computer. A Varian spectra-AA hollow cathode lamp for thallium was also used as the light source. The furnace tube was a standard platform tube with a pyrolytic graphite coating. The analytical wavelength (276.8 nm), spectral bandwidth (0.5 nm), lamp current (10 mA) and the furnace programme (Table 1) were used as recommended by the manufacturers. Peak height measurement was used for all quantifications. The flow injection manifold consisted of peristaltic pump (Ismatec, Ms-4 REGLO 8-100, Switzerland), rotary injection valve (Rheodyne, California, USA) and microcolumn of dibenzo-18-crown-6 immobilized on surfactant-coated alumina (PTFE, tube 3 cm × 2 mm i.d.)
Preparation of the sorbent and microcolumn
A volume of 50 mL of a solution (pH≈2) containing
100 mg SDS and 1.5 g of alumina was mixed with a magnetic stirrer for 10 min. The supernatant was decanted and the SDS-coated alumina was washed thoroughly with
water. Then ca. 20 mL of water and 5-7 mL of crown
ether (0.1 g dissolved in acetone) was added. The solution was shaken for 15 min. The mixture was then filtered through a Millipore filter, washed, air-dried and kept in a closed bottle before use. It was stable for over 4 months. The resulting sorbent was characterized by employing Fourier transform infrared spectrometry (FTIR). The
characteristic IR bands in cm-1 for immobilized DB18C6
were: 1454.5, 1509.7, and 1596.4 (skeleton bands of aromatic rings) and 1131.0, 1231.1, 1255.9, and 1331.0 (C-O stretching). These prove the loading of crown ether on SDS coated alumina.
A microcolumn was fabricated by using PTFE (Teflon) tubing (3 cm in length with internal diameter of 2 mm) containing DB18C6 immobilized on surfactant
coated alumina (ca. 60 mg). The end of the tube was fitted
with foam to retain the sorbent in the tube.
Preparation of real samples
Hair and nail
The hair and nail sample were rinsed with acetone, chloroform and doubly deionized distilled water, and finally dried at 60 °C. Exact amount of dried sample (0.1194 g for nail or 1 g for hair) was placed in three 50
mL beakers and 5 mL concentrated HNO3 was added to
the beakers. The beakers were then heated on a hot plate (initially at 100 °C for 45 min and then at 120 °C for 15 min). Following dissolution, the solution was cooled to
70 °C and 2 mL of 30% m/m H2O2 was added. The
mixtures were heated to dryness on a hot plate, with the temperature set at 150 °C, to yield a white residue.
Approximately 10 mL of 0.1 mol L-1 HNO
3 was added to
the beakers and the contents were heated at 100 °C for 1
h. The pH of solutions was adjusted to ca. 8. The solutions
were then transferred to a 50 mL volumetric flask and the volumes were adjusted upon addition of distilled water.
Water and urine
The samples were filtered through a Millipore filter;
the pH was adjusted to ca. 8 with ammonium hydroxide
solution, and was treated according to the given procedure.
Certified reference materials
A volume of 5 mL of concentrated nitric acid was added to 0.1 g of ore sample (BCR, No. 288 certified reference material). The solution was heated over a water bath for
few minutes and 2 mL of 30% m/m H2O2 was added. The
solution was filtered, diluted with water and the pH was
adjusted to ca. 8. The solution was then transferred to 50
mL flask, and was diluted with addition of distilled water. Also 2 mL of concentrated nitric acid was added to 0.1403 g of igneous rocks (GSJ reference sample). The
solution was heated over a water bath for ca. 45 min, and
few drops of H2O2 were added.The solution was then heated
to nearly dryness. Few mL of water was added to the solution, filtered, and pH was adjusted. The mixture was diluted to 20 mL and was treated according to the given procedure.
Recommended procedure
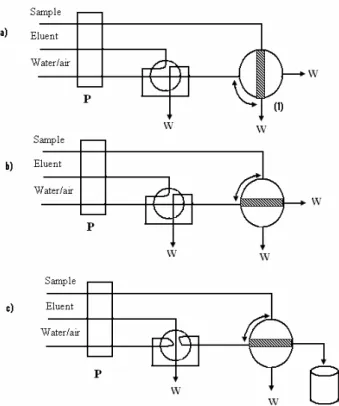
The flow injection manifold is presented in Figure 1. The microcolumn of immobilized DB18C6 on surfactant coated alumina was used as the operation column and was located in the sample loop of injection valve. At the end of sampling (Figure 1a), the valve 1 was switched
on-line and water (ca. 1 min) and air was passed through
the microcolumn respectively (Figure 1b). Then the eluent
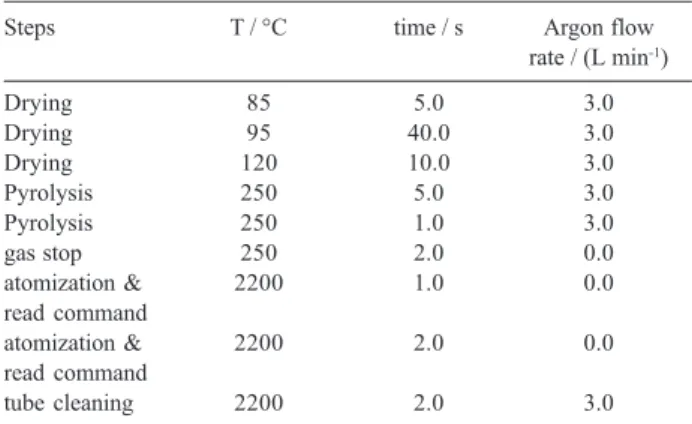
Table 1. Temperature program of ETAAS
Steps T / °C time / s Argon flow
rate / (L min-1)
Drying 85 5.0 3.0
Drying 95 40.0 3.0
Drying 120 10.0 3.0
Pyrolysis 250 5.0 3.0
Pyrolysis 250 1.0 3.0
gas stop 250 2.0 0.0
atomization & 2200 1.0 0.0
read command
atomization & 2200 2.0 0.0
read command
(500 µL, 2 mol L-1) was injected with the use of second
valve to promote elution (Figure 1c).
The pH of solution was adjusted to ca. 8 with
ammonium hydroxide solution. Standard solution or samples were passed through the immobilized crown ether microcolumn (time based sampling e.g. 2 min at a
flow rate of 3 mL min-1) to promote the sorption of the
analyte (Figure 1a). The column was washed then with water to remove all traces of the sample matrix. Then, air was drawn into the microcolumn in order to completely evacuate it between sample loading and elution, so that excess liquid will not end up in the graphite tube in the final elution step (Figure 1b). The retained analyte was then eluted by injection of nitric
acid (500 µL, 2 mol L-1) and the eluent was directly
collected into an auto sampler cup of the graphite furnace (Figure 1c). Afterwards, thallium was determined by ETAAS. The column was re-established by processing
ca. 2 mL of water through the column before the next
sorption/elution cycle.
Results and Discussion
Preliminary experiment had shown that when DB18C6 or 18C6 is added to the solution containing particle of alumina coated with SDS, the crown ethers
trapped homogenously on the hemi micelles or ad-micelles formed by SDS on the alumina surface in a manner similar
to reports for classical ligands.31-36 It was also confirmed
that, while microcolumn of alumina or alumina coated with SDS show no tendency for retention of thallium ions, the microcolumn of immobilized macrocycle on surfactant coated alumina was capable of retaining thallium ions from the sample solution quantitatively. However, the immobilized DB18C6 sorbent was more stable with better repeatability than immobilized 18C6 at high precon-centration volume. Therefore, it was chosen as the sorbent for subsequent work. Furthermore, the effect of modifier on determination of thallium was considered. Different
recommended modifiers38-40 such as palladium, sulfuric
acid, ascorbic acid and palladium/ magnesium were also examined. It was found that Pd/Mg were the most suitable modifier for this purpose, which is consistent with the
previous report.38 With ascorbic acid, Pd, and H
2SO4, the
background absorption was high with wide peak, and the linearity of calibration graph was limited.
In order to achieve the best performance from this system, different parameters were optimized. The pH of sample solution, effect of sample and eluent flow rate on the extraction efficiency, nature and concentration of eluent, amount of sorbent, and the effect of sample volume along with maximum capacity of the sorbent for thallium
(Tl+) recovery were studied. The procedure was optimized
by using the univariate method.
Effect of sample pH and mass of packing material
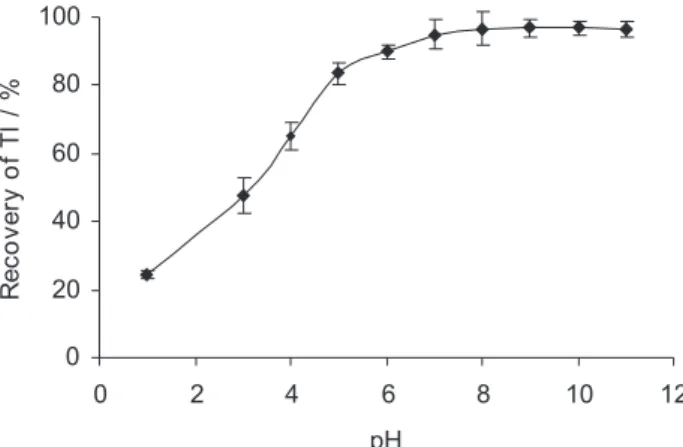
The effect of sample pH on the retention of thallium
(25 ng of Tl+) was studied by varying the pH within the
range of 1-11. The pH was adjusted by using 0.1 mol L-1 of
either nitric acid or ammonium hydroxide solution. The results showed (Figure 2) that the absorbance was increased with pH increase up to 6, and then leveled off at higher pH. The progressive decrease in absorbance at lower pH is due
to competition of proton with Tl+ for complexation with
DB18C6 (log Kf (Tl+/DB18C6)= 5.05, and log K
f (H +/
DB18C6) = 2.3).41 An optimum pH of 8 was selected for
subsequent experiments. The effect of length of column on efficiency of analyte sorption was considered and a packed
column with a length of 3 cm (corresponding to a ca. 60
mg of sorbent) was found to be sufficient.
Effect of sample flow rate on analyte sorption
The flow rate of the sample establishes the contact time between the sample solution and the sorbent. The effect of
Figure 1. Schematic of flow injection manifold; a) preconcentration step; b) washing/drying step; c) elution step; P: peristaltic pump; W: waste; flow rate 3 mL min-1, eluent (500 µL, 2 mol L-1 HNO
sample flow rate on analyte sorption was considered by
varying the flow rate from 1-6 mL min-1, while keeping
the amount of preconcentration analyte constant (25 ng
of Tl+). It was found that the kinetic of adsorption is fast
and independent of the flow rate. Flow rate greater than 6
mL min-1 was not tested because of the increasing back
pressure in the system. In order to achieve a good precision,
a flow rate of 3 mL min-1 was chosen for subsequent studies.
Selection of desorpting solution
In order to find the best eluent for desorbing the thallium ion from the sorbent, a series of eluents such as sulfuric, phosphoric, acetic and nitric acid at concentration level of 2
mol L-1 were selected. 5 mL of solution containing 25 ng of
thallium was passed through the sorbent at a flow rate of 3
mL min-1. The adsorbed thallium was then eluted by passing
500 µL of the aforementioned eluent, and the amount of thallium was determined by ETAAS. The results showed that the best recovery and peak shape was achieved with
nitric acid. The background absorbance was high with H2SO4,
due to formation of molecular SO2; while with H3PO4, the
absorbance peak split in two parts, and the recovery was low with acetic acid.
Effect of concentration, volume and flow rate of eluent on desorption of analyte
The effect of concentration of nitric acid on the recovery of thallium ion was studied. For desorbing 25 ng of thallium ions retained on microcolumn, different concentration of eluents were used. The results indicate that quantitative recovery (>95%) for thallium ion was achieved at 1.5 mol
L-1 of nitric acid and then leveled off at higher concentration.
Therefore, for subsequent work, 500 µL nitric acid with a
concentration of 2 mol L-1 was chosen as eluent. The effect
of varying the eluent flow rate (fixed flow rate for sorption)
was considered by varying the flow rate from 1-7 mL min-1.
It was found that the kinetic of desorption is fast and
independent of the flow rate. Flow rate above 7 mL min-1
was not tested due to the back pressure in the system. For
convenience, a flow rate of 3 mL min-1 was selected.
Furthermore, the effect of eluent volume on recovery was examined by using three loops with the sizes of 250, 500, and 750 µL. It was found that 500 µL of eluent was sufficient for quantitative recovery of thallium.
Evaluation of sorbent properties
The capacity of immobilized DB18C6 sorbent was examined by processing different volumes (5-20 mL) of
thallium solution (20 mg L-1) at optimum condition
through the microcolumn containing 60 mg of sorbent. The retained analyte was then eluted with 500 µL of 2
mol L-1 nitric acid, collected in 10 mL volumetric flask,
and diluted to the mark with distilled water. The thallium content was determined by FAAS. The breakthrough capacity of the microcolumn under the working conditions
was found to exceed 1432 µg of thallium per gram of
packing material. Furthermore, the capacity of the sorbent for retention of thallium was examined in the batch
experiments and was found to be 1693 ± 4 µg g-1 of packing
material. The results were in agreement with the finding of FI experiment. This high value indicated the high performance of the microcolumn for thallium enrichment, even in the presence of competing ions.
The capability of microcolumn for preconcentration
of Tl+ and Tl3+ was considered by processing 5 mL of 10
µg L-1 solution of either Tl+, Tl3+ or mixture of both
according to the given procedure. The results also revealed that the column did not distinguish between different species of thallium; thus, the microclumn is capable of
retaining both Tl+ and Tl3+ ions.
A single microcolumn was subjected to seven loadings with sample solution and subsequent elution with eluent. It was observed that retention properties of the sorbent did not change, even after seven cycles of sorption and desorption. Furthermore, by processing hundreds of sample retention and elution cycles during the course of this work, the stability of newly synthesized sorbent was tested, which was stable over for 4 months.
Interference study
The sensitivity and utility of the microcolumn in the preconcentration of thallium in the presence of potential interfering ions in water and environmental samples at a initial mole ratio of 1000 (ion/thallium) was examined,
Figure 2. Effect of pH on thallium retention, Tl+ solution (5 mL, 5 µg L -1) and eluent (500 µL, 2 mol L -1 HNO
3).
0 20 40 60 80 100
0 2 4 6 8 10 12
pH
Re
c
o
v
e
ry
o
f
T
l
/
however, when an interference was observed the concentration of interfering ion was lowered (Table 2). A relative error of less than 10% was considered to be within the range of experimental error. At the given level, no significant interference was observed in the determination of thallium at trace levels. Thus, the present system indicates that high concentration of matrix salts, have minimal effect on thallium species relative to matrix ions.
Analytical figures of merit
Analytical figures of merit were evaluated for the proposed system using 5 mL aliquot of thallium solution
(0.1-20 µg L-1), which after sorption on the sorbent was
eluted with 500 µL of 2 mol L-1 nitric acid. The calibration
curve obtained upon analysis of the eluent using ETAAS had the equation A= 0.0243C+0.0027 with r²=0.9993, where A is the absorbance value of the eluent, and C is
the concentration of thallium (µg L-1) in solution. With 5
mL sampling volume over 30 samples were concentrated in 1 h; however, analysis using ETAAS took longer time (Table 1). The precision of the method for eleven replicate measurements for standard solution (5 mL) containing 1
µg L-1 of thallium was 5.7% expressed as relative standard
deviation.
The limit of detection (LOD), defined as the concentration of thallium that gives a response equivalent to three times the standard deviation of the blank analyses
(3S) for processing 5 mL volume were 0.05 µg L-1.
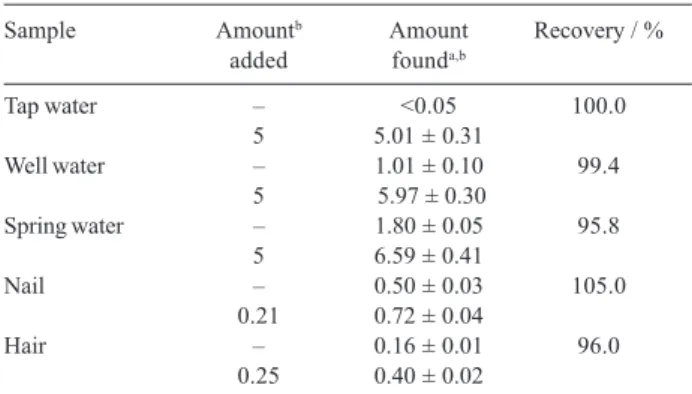
Analysis of real sample
In order to assess the applicability of the method to real sample, the procedure was applied to the determination of thallium in water (tap, well and spring water), hair and nail samples. The reliability was checked using spikes (Table 3). It was shown that the recovery of spiked sample was good, suggesting that the proposed method is suitable
for preconcentraion of thallium ion at the trace level in the sample type examined. The procedure was also applied for determination of thallium in two different certified reference materials, namely, BCR No 288 and igneous rock (GSJ), with thallium concentration of 2.3±0.1 and
1.54 µg g-1, respectively. The accuracy of the method was
checked by comparing the data with the certified value. The amount of thallium in BCR and igneous rock were
found to be 2.35±0.15 and 1.58±0.12 µg g-1 respectively.
This indicates that at 95% confidence limit there is no significant difference between these results and certified values, which confirm the suitability of the method for this type of sample. Thus, the procedure is reliable for determination of thallium in a wide range of samples.
Conclusions
This study presents a simple method for physical immobilization of crown ether ligands such as DB18C6 on solid support used for preparation of column and microcolumn for extraction of ions. Furthermore, the proposed FI system incorporating immobilized DB18C6 microcolumn permits effective separation and precon-centration of thallium and final determination by ETAAS in different matrices.
The main benefits of this system were the easy preparation of the sorbent , high stability and repeatability of the microcolumns, high tolerance to interference from the matrix ions in different samples, enhanced sensitivity of ETAAS, and low cost. Future work will address the suitability of the immobilized microcolumn for field sampling of thallium.
References
1. Townshend, A; Encyclopedia of Analytical Science, Academic Press: London 1995.
Table 2. Interference study
Coexisting Mol Recovery / % Coexisting Mol Recovery / %
ions ratio ions ratio
Mg2+ 1000* 100.1 ± 5.0 Cd2+ 500 098.2 ± 3.0 Na+ 1000* 095.4 ± 6.1 Ag+ 750 099.1 ± 1.3 Ca2+ 1000* 096.2 ± 4.2 Cs+ 250 094.0 ± 4.1 K+ 250 094.5 ± 5.1 Fe2+ 500 093.5 ± 3.4 Zn2+ 500 105.1 ± 2.2 Cl– 500 095.2 ± 2.2 Pb2+ 500 094.1 ± 3.2 CO
32– 500 104.1 ± 1.1 Cu2+ 500 095.2 ± 2.4 I– 750 105.0 ± 2.3 Co2+ 750 094.5 ± 4.1 PO
43– 250 094.5 ± 3.2 Ni2+ 750 103.0 ± 2.0
*maximum value tested.
Table 3. Analysis of real sample
Sample Amountb Amount Recovery / %
added founda,b
Tap water – <0.05 100.0
5 5.01 ± 0.31
Well water – 1.01 ± 0.10 99.4
5 5.97 ± 0.30
Spring water – 1.80 ± 0.05 95.8
5 6.59 ± 0.41
Nail – 0.50 ± 0.03 105.0
0.21 0.72 ± 0.04
Hair – 0.16 ± 0.01 96.0
0.25 0.40 ± 0.02
2. Asami, T.; Mizuic, C.; Shimada, T.; Kubota, M.; Fresenius J. Anal. Chem. 1996, 356, 348.
3. Das, A. K.; Chakraborty, R.; Cervera. M. L., de la Guardia, M. D. I.; Anal. Bioanal. Chem. 2006, 385, 665.
4. Nukatsuka, I.; Seitoh, H.; Ohzeki, K.; Microchim. Acta 2004, 148, 177.
5. Twining, B. S.; Twiss, M. R.; Fisher, N. S.; Environ Sci. Technol. 2003, 137, 2720.
6. Karthikeyan, J.; Parameshwara, P.; Shetty, A. N.; Shetty P.; J. Braz. Chem. Soc. 2006, 17, 316.
7. Saleh, M. A.; Ewane, E.; Jones, J.; Wilson, B. L.; J. Food Compos. Anal. 2001, 14, 127.
8. Dabeka, R. W.; Conacher, H. B. S.; Lawrence, J. F.; Newsome, W. H.; Mckenzie, A.; Wagner, H. P.; Chadha, R. K. H.; Pepper, K.; Food Addit. Contam. 2002, 19, 721.
9. Cheam, V.; Lawson, G.; Lechner, J.; Desrosiers, R.; Nriagu, J.; Fresenius J. Anal. Chem. 1996, 355, 332.
10. Fernandes, K. G.; Nogueira, A. R. A.; Gomes Neto, J. A.; Nóbrega, J. A.; J. Braz. Chem. Soc. 2004, 15, 676.
11. Zendelovska, D.; Stafilov, T.; Anal. Sci. 2001, 17, 425. 12. Nukatsuka, I.; Horiguchi, R.; Seitoh, H.; Ohzeki, K.; Miyashita,
F.; J. AOAC Int. 2004, 87, 986.
13. Villar, M.; Alava, F.; Lavilla, I.; Bendicho, C.; J. Anal. At. Spectrom. 2004, 16, 1424.
14. Silva, A. F.; Borges, D. L. G.; Welz, B.; Vale, M. G. R.; Silva, M. M.; Klassen, A.; Heitmann, U.; Spectrochim. Acta, Part B 2004, 59, 841.
15. Goreti, M.; Vale, R.; Welz, B.; Spectrochim. Acta, Part B 2002, 57, 1821.
16. Cvetkovic, J.; Arpadjan, S.; Karadjova, I.; Stafilov, T.; Spectrochim. Acta, Part B 2002, 57, 1101.
17. Pavolovska, G.; Cundeva, K.; Stafilov, T.; Croat. Chem. Acta 2001, 74, 121.
18. Cundeva, K.; Pavolovska, G.; Stafilov, T.; J. Ser. Chem. Soc. 2001, 66, 709.
19. Lin, T.; Nriaju, J. O.; Anal. Chim. Acta 1999, 395, 301. 20. Luo, F. G.; Hou, X. D.; At. Spectrosc. 1994, 15, 216. 21. Ivanova, E.; Yan, X. P.; van Mol, W.; Adams, F.; Analyst 1997,
122, 1.
22. Xu, Z. R.; Xu, S. K.; Fang, Z. L.; At. Spectrosc. 2000, 21, 17. 23. Alexandratos, S. D.; Stine, C. L.; Sachlebem, R. A.; Mojer, B.
A.; J. Polymer 2005, 46, 6347.
24. Jia, C.; Luo, Y.; Pawliszyn, J.; J. Microcol. Sep. 1998, 10, 167. 25. Abov-Mesalam, M. M.; EL-Nagar, I. M.; Abdel-Hai, M. S.; EL-Shahawi, M. S.; J. Radioanal. Nucl. Chem. 2003, 258, 619. 26. Gesser, H. D.; Ahmed, S.; J. Radioanal. Nucl. Chem. 1990,
140, 395.
27. Sooksamiti, P.; Geckeis, H.; Grudpan, K.; Analyst 1996, 121, 1413.
28. Bakircioglu, Y.; Segade, S. R.; Yourd, E. R.; Tyson, J. F.; Anal. Chim. Acta 2003, 485, 9.
29. Dimitrova, B.; Benkhedda, K.; Ivanova, E.; Adams, F.; Can. J. Anal. Sci. Spectrosc. 2004, 49, 346.
30. Yost, T. L.; Fagan, B. C.; Allain, L. R.; Barnes, C. E.; Dai, S.; Sepaniak, M. J.; Xue, Z.; Anal. Chem. 2000, 72, 5516. 31. Hiraide, M.; Sorouradin, M. H.; Kawaguchi, H.; Anal. Sci. 1994,
10, 125.
32. Manzoori, J. L.; Sorouradin, M. H.; Haji Shabani, A. M.; J. Anal. At. Spectrom. 1998, 13, 305.
33. Dadfarnia, S.; Haji Shabani, A. M.; Dehghan Shirie, H.; Bull. Korean Chem. Soc. 2002, 23, 545.
34. Dadfarnia, S.; Salmanzadeh, A. M.; Haji Shabani, A. M.; J. Anal. At. Spectrom. 2002, 17, 1434.
35. Haji Shabani, A. M.; Dadfarnia, S.; Dehghan, K.; Talanta 2003, 59, 719.
36. Dadfarnia, S.; Haji Shabani, A. M.; Tamaddon, F.; Rezaei, M.; Anal. Chim. Acta 2005, 539, 69.
37. Falomir, F.; Alegria, A.; Barbera, R.; Farre, R.; Lagarda, M. J.; Food Chem. 1999, 64, 111.
38. Schlemmer, G.; Welz, B.; Spectrochim. Acta, Part B 1986, 41, 1157.
39. Xiao-Quan, S.; Zhe-Ming, N.; Li, Z.; Talanta 1984, 31, 150. 40. Stafilov. T.; Cundeva, K.; Talanta 1998, 46, 1321.
41. Izatt, R.; Bradshaw, J.; Nielsen, S. A.; Lamb, J. D.; Christensen, J. J.; Chem. Rev. 1985, 85, 271.