Printed in Brazil - ©2007 Sociedade Brasileira de Química 0103 - 5053 $6.00+0.00
ArticleArticleArticleArticleArticle
*e-mail: [email protected]
Chemical Equilibrium in the Complexation of First Transition Series Divalent Cations
Cu
2+, Mn
2+and Zn
2+with Chitosan
Raúl Bonne Hernández,a,b Oscar Reyes Yolac and Ana Lucia Ramalho Mercê*,a
a
Departamento de Química,Centro Politécnico, Universidade Federal do Paraná, CP 19081, Jd. das Américas, 81431-990 Curitiba-PR, Brazil
b
Centro de Toxicología e Biomedicina, Instituto Superior de Ciencias Médicas, CP 90400, Autopista Nacional Km 1,5, Santiago de Cuba 4, Cuba
c
Facultad de Ingeniería Química, Universidad de Oriente, Santiago de Cuba, Cuba
O presente estudo forneceu dados para o cálculo das constantes de estabilidade formadas em um sistema aquoso e HCl contendo quitosana e cátions Cu2+, Mn2+ e Zn2+. Os diagramas de
espécies foram gerados para demonstrar como o pH influencia esses equilíbrios estudados por titulações potenciométricas e espectrofotométricas. Os sólidos extraídos dessas soluções aquosas em HCl foram estudados por espectroscopia no infravermelho. A quitosana complexa-se com os cátions Cu2+, Mn2+ e Zn2+ a pHs >4 >5 e >2 respectivamente, na razão ligante:metal, 1:1. As
constantes de estabilidade calculadas para ML apresentaram a seguinte ordem de estabilidade: Cu2+>Zn2+>Mn2+. Algumas estruturas para os possíveis complexos formados foram sugeridas
envolvendo ambos os átomos de N e/ou O como sítios quelantes de uma ou duas unidades monoméricas do biopolímero estudado.
This study provided the data for calculating the stability constants formed in the aqueous HCl equilibrium of chitosan and Cu2+, Mn2+ and Zn2+, and determined the species distribution
diagrams to show the influence of pH in the complexation systems based on data obtained from potentiometric and spectrophotometric titrations. The solid complexes further obtained from these aqueous HCl systems, were investigated by infrared spectroscopy. It was verified that chitosan coordinated with the cations Cu2+, Mn2+ and Zn2+ at pHs >4 >5 and >2 respectively, in
ligand to metal ratio of 1:1. The logarithms of the binding constants for ML species presented the following stability order: Cu2+>Zn2+>Mn2+. Some possible complexed structures were suggested
having both N and/or O atoms as binding sites with one or two monomers of the biopolymer studied.
Keywords: chitosan, divalent cations, pH, stability constants, biodegradable and biocompatible polymers
Introduction
Chitosan (Chit) is a linear polysaccharide composed
of β (1 → 4) linked 2-amino-2-deoxy-D-glucose and
2-acetamido-2-deoxy-D-glucose. It presents biodegradable and biocompatible properties, gelling ability, and can be shaped into several derivatives by further modifications
of its amino and hydroxyl groups.1
Chit is obtained on an industrial scale by the alkaline deacetylation of chitin, one of the most abundant biopolymers in nature which can be extracted from
crabs and shrimp shells, fungal biomass, insect cuticle
or squid pen.2
The main parameters that are used for chitosan characterization are deacetylation fraction, molecular weight and cristallinity of the biopolymer. When the degree of deacetylation of chitin is higher than 50%, the so called chitosan becomes soluble in aqueous acidic media. Higher deacetylation degree, more than 95%, are high cost and are generally reserved for biomedical
applications.3,4
metal ions. So, in the literature, there are many reported works taking advantage of the complexing ability of chitosan and some of its derivatives with polyvalent metal
ion to remediate various hazardous waste waters.4-7
Although these many works in the literature showing
the complexing ability of chitosan8-10 and stating the
dependence of pH in the complexation, virtually none so far, have studied the chemical equilibrium measuring the binding constants and the pH dependence in the formation
and destruction of the complexed species.11,12
In the complexation studies of chitosan and metal ions, different coordination mechanisms have been proposed.
Some examples6-14 are structures found, called “bridge
model’’, where the metallic ion is bound to four nitrogen atoms of either the same or to different chains. Another model, “pendant model’’, considers the metallic ion linked to the amino group like a pendulum. This last model was
confirmed by Domard8 through theoretical calculations
of functional density (DFT) and it was suggested that
chitosan coordinates with divalent ions, like Cu2+ and Ni2+,
through the nitrogen of the amino group and indistinctly through the hydroxyl groups of C-3 and C-6 of some sugar
unit of the biopolymer.9
Much is yet to be said on chitosan complexation ability
since the two type basic sites, –NH2 and –OH are capable
of binding metal ions. In a recent review3 in the literature,
chitosan is presented as mainly a –NH2 chelating agent
although the literature showed complexation with metal ions through –OH in the sugar unit of this and other
biopolymers.11,12,15
It is important to state that it is not possible to determine the exact pKa value for each amino and C-6 –OH groups in chitosan since its complex structure, therefore a mean value can be obtained as a function of the degree of dissociation which in itself, is dependent on several values amongst which are the degree of deacetylation (DD), molecular mass (MM) and expe-rimental conditions such as ionic strength (I), pH,
temperature and solvent.1 It is important then, to state a
mathematical model for the use of microcomputer programs to calculate the binding and protonation constants of the biopolymer studied. According to the
literature,11,12,16-18 considering small parts of the biopolymer
repeating units proved to be useful among other set conditions.
It is well known that at trace levels metal ions are essential nutrients for living organisms, but their lack or
excess leads to adverse effects.19
Studies in the literature involved absorption of metal
ions in chitosan,20-22 but complete equilibrium
inves-tigations with determination of binding constants, as well
as pH speciation, have only recently been addressed in the
literature.23-26 Also, the reported studies presented different
experimental conditions from this present work.
The chelating ability of chitosan makes it a powerful metal ion remediating agent as well as having other applications in the chemical industrial processes. The study of the interaction between this biopolymer and metallic cations in different experimental condition is a relevant topic, though. In this sense, the main objectives
of this work were to study the influence of the H+
concentration in the solubility of chitosan, calculation of the binding constants and the speciation according to pHs in different ligand to metal ratios in HCl aqueous media systems. In that sense, the analytical tools of poten-tiometric and spectrophotometric titrations, and FTIR spectroscopy were also employed to help unravel the possible complexed structures formed.
Experimental
Reagents
Chitosan (75% degree of deacetylation, medium molecular weight, 200000D, Aldrich, Germany) was dissolved in a standard HCl solution (Merck, Brazil),
≈ 0.1 mol dm-3. Metal ion solutions were prepared from
reagent grade salts, CuCl2·2H2O, MnCl2·4H2O, ZnCl2
(Merck, Germany) and were used without further
purifications. Standardized (≈ 0.1 mol dm-3) KOH aqueous
solution (Merck, Brazil) was the titrant, 0.100 mol dm-3
KCl (Merck, Germany) was the ionic strength providing
electrolyte. A 0.01 mol dm-3 solution of standardized
Na2EDTA was employed to standardize the metal ion
solutions, and bi-distilled water free of CO2 was used in
all solutions.
Potentiometry
The potentiometric titrations were carried out in duplicate, according to the methodology developed in the
Chemical Equilibrium Laboratory-LEQ-UFPR24-26 for
biopolymers, in a Micronal pH meter (Brazil, model
B-374) with a glass electrode H3O+ sensitive
(Analyser-Brazil, model SM01), and a saturated calomel reference electrode (Analyser-Brazil, model SR 02). The poten-tiometric apparatus was calibrated with standard HCl and
KOH (Merck, Brazil) solutions in order to read -log [H+]
directly. The pKw used for water at I = 0.100 mol dm-3 was
13.78. The air in the reaction cell was purged by an inert
N2 atmosphere (White-Martins, Brazil), previously
KOH 1.0 and 0.1 mol dm-3. A thermostated bath
maintained the temperature (25.0 ± 0.1 ºC, MQBTC 99-20, Microquímica, Brazil) and a piston burette (Metrohm AG Herisäu / E 274, Switzerland) was used to deliver the
titrant solution (KOH, 0.1 mol dm-3, 0.05 cm-3 increments
of volume, standardized by potassium hydrogen phthalate (Carlo Erba, Italy). Solutions of 0.10 mmol of Chitosan in 0.485 mmol HCl were titrated in the absence and in
the presence of previously standardized27 metal solutions
in ligand to metal ratios of 1:1 and 2:1.
The Hyperquad28 microcomputer program was used
to calculate the protonation and the binding constants for the complexed species found in percentage higher than 10% of total metal concentration in the equilibria. The mathematical model took into account the experimental average pH data from each potentiometric titration employed in triplicate, the hydrolysis constants for the
metal ions, Cu2+, Zn2+ and Mn2+,29 the millimols of
chitosan, calculated taking into account the dimeric
repeating unit of the biopolymer (MM=344.3 g mol-1).
The dimeric unit was chosen to minimize any bias introduced in the calculations by the use of a low deacetylation degree chitosan. The calculations proceeded until the simulated curve matched the experimental one, thus minimizing the propagation errors in the experimental conditions employed. HySS (Hyperquad simulation and
speciation)30 program was used to calculate the species
distribution diagrams using as input Hyperquad28 data.
Ultraviolet-Visible spectroscopy
The measurements were carried out using an HP (8452 Diode Array Spectrophotometer), UV-Visible spectro-photometer, using quartz cells (1 cm), from 190 to 820 nm.
Previously acidified (HCl) solutions of chitosan and
metal ions (both at 10-3 mol dm-3) were obtained by mixing
proper quantities of the reagents to obtain different ligand to metal ratios in pH values from 1.8 to 8.0 depending on the metal ion employed.
Fourier Transform Infrared Spectroscopy
The IR spectra were obtained in an FTIR spectrophotometer, BioRad (USA), with KBr (Merck,
Brazil) pellets from 400 to 4000 cm-1. The solid complexes
were obtained from aqueous solutions of ligand to metal ratio of 2:1 freshly prepared and the pH set at 1.8 to 8.0 with KOH solution. The resulting solutions were placed
in an oven (40 oC, for 48 h). The solid samples thus
obtained were washed repeatedly with absolute ethanol,
and placed once again in the oven at the same temperature for another 24 h. The resulting solid was ground and used in 1% m/m in the KBr pellets (total mass of 0.1000 g) made at 8 tons for 3 min.
Results and Discussion
Potentiometric titrations and metal speciation
The formation of the complexes can be described according to the Lewis acid-base theory, where an acid is the acceptor of electron pairs from a base. Chitosan (generally referred as L or Chit) is the Lewis base
presenting –OH and –NH2 basic sites, and Cu2+, Zn2+ and
Mn2+ are the acids (generally referred as M).
Equations 1 and 2 represent the protonation equilibria for the two potentially basic sites of the dimeric repeating
unit of chitosan, the amino group –NH2 and the hydroxyl
of C-6, –OH. Equations 1’ and 2’ represent generically, the equations 1 and 2. The acidity of this C-6–OH group in other sugar-derived biopolymers was studied and
determined previously:23-26
–O-Chit-NH
2 + H
+ = HO–Chit–NH
2 log K1 = 12.37±0.08 (1)
H-1L + H = L (1’)
HO-Chit- NH2 + H+ = HO–Chit–NH
3
+ log K
2 = 6.35 ±0.08 (2)
L + H = HL (2’)
where H-1L is the completely deprotonated sugar unit, L
the chitosan dimeric unit with C-6 hydroxyl group protonated, and HL, the fully protonated species.
The complexed species with the overall stability constants associated with equilibrium in this work can be represented by the generic equations 3 to 5, charges omitted for simplicity.
L + M = ML βML = [ML]/[L][M] (3)
M + L + H = MHLβMHL = [MHL]/[M][L][H] (4)
M + L + OH = MLOH βMLOH = [MLOH]/ [M][L][OH] (5)
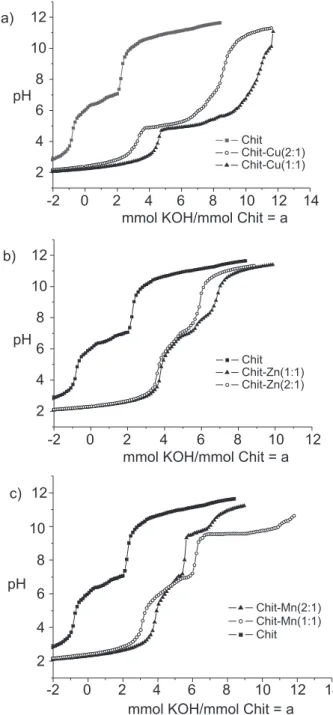
mineral acid added to each experiment in order to prevent metal hydrolysis and to fully solubilize chitosan. The curve of the ligand in the positive portion of the x axis showed
the neutralization of chitosan from pH 6 to 11. Protonation constants for the dimeric sugar unit of chitosan were calculated from potentiometric data and were compared with the values reported in the literature for amino and primary alcohol groups in a generic sugar monomeric unit. The potentiometric equilibrium profiles of chitosan in the presence of the metal ions studied (Figure 1) presented x axis displacement when compared to the profile of chitosan alone. The calculated equilibrium constants are given in Table
1. The species distribution curves for Cu2+, Zn2+ and Mn2+
are presented in Figure 2, a, b and c, respectively. It can be seen that ML complexes of all metal ions studied appeared
at pH values above 4. MHL complexes of Zn2+ were formed
below pH 2 and the monohydroxo 1:1 ligand to metal complexes of all metals, appeared after pH 6. The late pH formation of all ML suggested that the formation of ML species probably happened through both possible binding sites of chitosan. Even knowing that C-6 hydroxyl group is to be deprotonated at high pHs, it may occur at lower values depending on the metal ions. On the other hand, the presence
of MHL with Zn2+ showed that this metal ion was not capable
to deprotonate the C-6–OH group. It was not possible to
detect further species in the equilibrium with Zn2+. The
profiles were almost coincidental whatever the ligand to metal ratio employed.
In general, the ML order of stability found was:
Cu2+>Zn2+>Mn2+. This sequence maintained the trend in
the well-known Irvin-Williams series.
Spectroscopy
The spectroscopic studies were carried out in the same ligand to metal ratios as employed in the potentiometric studies.
Ultraviolet-Visible spectroscopy
Previous work in the literature has showed that chitosan
absorbs in the UV region, near 214 nm.13
Figure 3 shows the behavior of Cu2+–chitosan system,
where two bands appear in the ultraviolet region, one around ~ 206 nm and the other, between 249-270 nm. The first one was attributed to the free ligand and the second, to
Cu2+–chitosan charge transfer band (TCLM).12,13,31 Although
some authors suggest a 2:1 amino-copper ratio complex,
Figure 1. Potentiometric equilibrium curves for solutions containing 0.1 mmol of aqueous HCl chitosan and 0.1 and 0.05 mmol of the metal ion: a) Cu2+; b) Zn2+; c) Mn2+; T = 25.0 oC; I = 0.100 mol dm-3 (KCl).
Table 1. Logarithms of calculated binding constants for chitosan (L) and Cu2+, Zn2+ and Mn2+ (M) in HCl aqueous equilibria. T=25.0 oC, I=0.100 mol dm-3 (KCl)
species log K ± s.d species log K ± s.d. species log K ± s.d.
ChitH–Zn 7.5 ± 0.1 Chit–Cu 11.35 ± 0.06 Chit–CuH-1 4.75 ± 0.06
Chit–Zn 11.1 ± 0.3 Chit–ZnH-1 4.5 ± 0.3
Chit–Mn 9.3 ± 0.3 Chit–MnH-1 2.6 ± 0.1
based on the appearance of a second wide band in this
region,12,13 in this work it was associated to overlapping of
bands of the –O → Cu2+ group in the hydroxyl groups
(–OH) or due to water molecules in the metal coordination
sphere.32 A third much less intense d-d band (2T
2g→ 2Eg)
at 586 nm was identified. However, it was not possible to clearly identify the influence of N donor atom in the complexation of chitosan in this d-d transition band due to gelling of the solutions as concentration was increased.
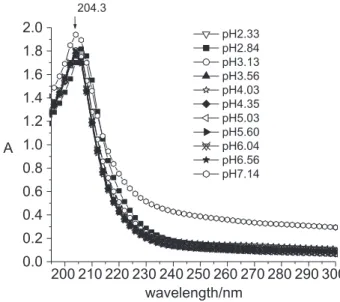
The Zn2+–chitosan system (Figure 4) presented a
spectrum similar to that of the free polymer with only a
band around 204 nm. The electronic configuration of Zn2+
presenting completely full “d” orbitals, does not allow the occurrence of d-d transitions and the configuration is extremely stable. Under the experimental conditions employed, the energy difference between the orbitals that give or receive electrons would be high in such a way that
the absorption of the type (TCLM–NH2→Zn2+) would be
displaced toward smaller wavelength, being able to overlap with the observed band.
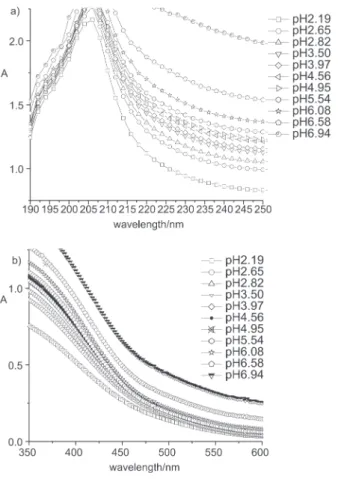
The Mn2+–chitosan system in the ultraviolet region
(Figure 5) presented a spectral behavior similar to the one with copper, although the charge transfer band (TCLM–
NH2 → Mn2+) appeared as a shoulder around 306 nm at
pH>3. As the shoulder extends up to 400 nm, associated
bands like those arisen from O→Mn2+ group, were
probably overlapped.32 No bands were observed in the
visible region as a consequence of semi-filled “d” orbital
configuration of Mn2+, implying prohibited electronic spin
transitions. Isosbestic points were observed mainly at pH around 4.5 till 6.1, confirming the presence of the new species with the variation of pH.
Figure 2. Species distribution curves of Cu2+, Zn2+ and Mn2+, aqueous HCl chitosan solutions, ligand to metal 1:1, with total metal concentra-tion set at 100%. H-1 stands for OH–.
a)
b)
c)
Figure 3. UV-Vis spectra at various pHs of aqueous HCl chitosan solu-tion and Cu2+, ligand to metal ratio of 1:1.
200 300 400 500 600
0.0 0.5 1.0 1.5 2.0 2.5
pH1.92 pH2.45 pH2.87 pH3.42 pH4.10 pH4.39 pH5.02 pH5.41 pH6.02 pH6.41 pH7.07 206.22
248.88
A
wavelength/nm
Figure 4. UV spectra at various pHs of aqueous HCl chitosan solution and Zn2+, ligand to metal ratio of 1:1.
200 210 220 230 240 250 260 270 280 290 300 0.0
0.2 0.4 0.6 0.8 1.0 1.2 1.4 1.6 1.8
2.0 pH2.33
pH2.84 pH3.13 pH3.56 pH4.03 pH4.35 pH5.03 pH5.60 pH6.04 pH6.56 pH7.14 204.3
A
Charge transfer bands from the ligand to the metal “TCLM” presented by complexes in this work, have similarities to those of certain dinuclear compounds of the studied metallic cations with chlorine atoms bridging
two metallic centers. The bands for Cu2+ complex appeared
at 265-420 nm,33 for zinc at 260 and 316 nm33 and for
manganese, at 265-415 nm.33,34 It can be reasonably
supposed that these matching bands are due to the presence of structural units similar to the compounds obtained in this present work.
Fourier Transform Infrared Spectroscopy
The infrared spectra were obtained from pH 4 to 8 where the highest interaction was detected with same mass of samples. All infrared bands presented different intensities and thus showed that the binding groups when the chit-metal complexes were formed have undergone different bonding as pHs changed. It has also been demonstrated that the spectrum of chit for the same pH interval showed little
variation.35
The IR spectrum of chitosan presents νOH bands at 3453
cm-1, ν
NH at 3345 cm
-1, ν
CH at 2923 cm
-1, ν
C-O at 1089 cm
-1 36
and when chitosan is not completely deacetylated, the
appearance of a νCO band at 1670 cm-1 and β
NH2 at 1590
cm-1 has also been reported.36,37
The Cu2+–chitosan system is presented in Figure 7.
The region above 2700 cm-1 shows characteristic bands
of the aliphatic groups, specifically CH2 and CH, between
2880 and 2960 cm-1, as well as that of OH of alcohol at
3445 cm-1 and of amine NH
2 at 3365 cm
-1. These last two
groups showed a decrease of 8 and 20 units, respectively, toward higher wave numbers if compared to chitosan
alone. In the case of Zn2+ (Figure 8) and Mn2+ (Figure 6)
complexes, the shifts were 67 and 75 units, respectively. The three complexes also presented a sharp difference in
the band of δNH2 around 1600 cm
-1, the bending vibrations
of NH groups, as the pH was steadily increased.
The region between 1020 and 1080 cm-1 presented
alterations in the intensity and displacement. This region
accounts for νCO stretching vibrations of primary and
Figure 5. UV-Vis spectra at various pHs of aqueous HCl chitosan solu-tion and Mn2+, ligand to metal ratio of 1:1. a) 190 to 250 nm; b) 350 to 600 nm.
Figure 6. IR spectra of solid complexes of chitosan and Mn2+ extracted from aqueous HCl solutions at various pHs in ligand to metal ratio of 1:1.
secondary alcohols respectively.38 The region around 1150
cm-1 (ν
CO) also showed changes in intensity and
displacement which also indicates changes in the secondary carbon hydroxyl groups. In the IR spectra of chitosan alone, no significant bands are seen in the region below 1000
cm-1.35 However, there were sharp changes in the spectra
when chitosan is complexed to the metal ions studied. Such
were the cases of M–L vibrations, νNH2 and ρNH2 (amino
complexes),6,35,38 this last one possibly coinciding with the
vibrations of ρHOH (aquo complexes),38 ν
OH (hydroxyl
complexes) and νOH (aquo complexes)38 (refer to Table 2).
Moreover, another signal was detected for the
complexes, around 1250 cm-1 (Figures 6 to 8) associated
with δCO in the sugar ring which was not present in the
spectrum of the ligand alone. This could be associated with structural rearrangement induced by the coordination which causes a higher polarization of this group and then
leads to the appearance of bands in the infrared region.39
Although it is more likely that chitosan-metal cation complexation occurs primarily through the amino group (as ligand), hydroxyl groups in the sugar unit can play an important role when the stereochemistry favors the complexation through these groups or when either the pH or the metal ion strength deprotonate C-6 OH. It is not possible to rule out the participation of –OH groups (either from C-6 or C-3) in chitosan complexation since competition of the different metal ion Lewis acidity can provide the proper conditions for this complexation and
also that the deprotonation constant of C-6 OH is within the pH range of aqueous solution (refer to equation 1). Above pH 8, all studied systems formed insoluble hydrolytic products.
Proposed coordination mechanism and possible structures
Data obtained so far allowed proposition of some structures for the complexed species formed in the chemical
equilibria studied. The proposed structures may bear Cl– as
the counter anion in the complex structure, to give the
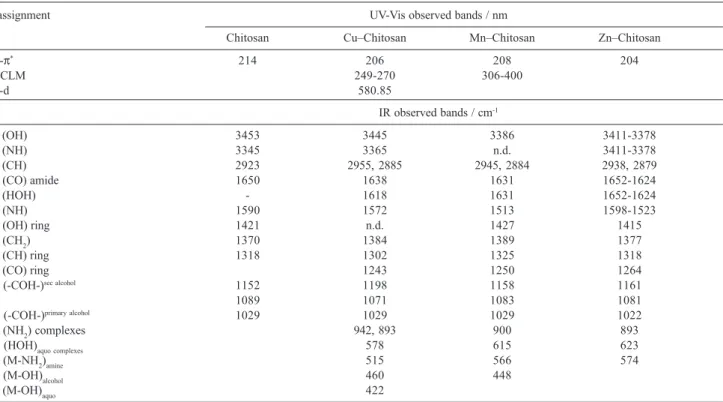
Table 2. UV-Vis and IR bands for the solid complexes of chitosan (L) and Cu2+, Zn2+ and Mn2+ extracted from HCl aqueous equilibria at different pHs
assignment UV-Vis observed bands / nm
Chitosan Cu–Chitosan Mn–Chitosan Zn–Chitosan
π-π* 214 206 208 204
TCLM 249-270 306-400
d-d 580.85
IR observed bands / cm-1
ν (OH) 3453 3445 3386 3411-3378
ν (NH) 3345 3365 n.d. 3411-3378
ν (CH) 2923 2955, 2885 2945, 2884 2938, 2879
ν (CO) amide 1650 1638 1631 1652-1624
ν (HOH) - 1618 1631 1652-1624
δ (NH) 1590 1572 1513 1598-1523
δ (OH) ring 1421 n.d. 1427 1415
δ (CH2) 1370 1384 1389 1377
δ (CH) ring 1318 1302 1325 1318
δ (CO) ring 1243 1250 1264
ν (-COH-)sec alcohol 1152 1198 1158 1161
1089 1071 1083 1081
ν (-COH-)primary alcohol 1029 1029 1029 1022
ρ (NH2) complexes 942, 893 900 893
ρ (HOH)aquo complexes 578 615 623
ν (M-NH2)amine 515 566 574
ν (M-OH)alcohol 460 448
ν (M-OH)aquo 422
n.d.: not detected
Figure 8. IR spectra of solid complexes of chitosan and Zn2+ extracted from aqueous HCl solutions at various pHs in ligand to metal ratio of 1:1.
species, zero final charge balance. Nitrate is not likely to be in the complex structures but can be present probably in the second coordination sphere of the complexes for the same
reason stated as for Cl–. Since the three dimension-structure
of a biopolymer, chitosan can coordinate with the metal ions forming mono or dinuclear units with possible metallic
bridges with chlorine atoms.40-42 In this way, tetracoordinated
[MNOCl2], pentacoordinated [MNOCl2X] or [µ–Cl–
MNOCl2] hexacoordinated [µ–Cl–MNOCl2X] structures
can be formed, where X are OH– or H
2O molecules (Figure
9).
Conclusions
This work provided the calculated binding constants
for chitosan and the divalent cations Cu2+, Zn2+ and Mn2+.
The order of stability found was Cu2+>Zn2+>Mn2+. The
coordination happened through amino and hydroxyl groups (coordination through either C-6 or C-3 hydroxyl group of the dimeric sugar unit) in bridge-like structure with the metallic centers, originating tetracoordinated
[MNOCl2], pentacoordinated [MNOCl2X] or [µ–Cl–
MNOCl2] hexacoordinated [–Cl–MNOCl2X] compounds,
with chloride anions completing the coordination sphere of the complexes. These species are in agreement with
the literature43 where the thermodynamic parameters for
chit and copper(II) have shown that after the primary interaction with the N atom, a second interaction happens through –OH of C-3 involving one or more monomer of the same or different chain, with the same cation forming stable complexes and with the references 40 and 42, where there are the reports of structures of two metal ions bridged
by two Cl atoms bound to two monomers from different chains of chit or to a dimeric unit of the same chain of chit (refer to Figure 9).
It has to be emphasized that as the dimeric structure of chit was considered in all calculations as the minimum structure, ML can be the representation of the complexation through N or O binding sites of either a monomeric or dimeric sugar units of chit. In this way the
equilibrium was conceived, ML2 is hardly to be expected.
The present study helped clarify Cu2+, Zn2+ and Mn2+
selectivity of the coordinating and remediating agent chitosan, in aqueous HCl chemical equilibrium.
References
1. Cristóbal, L. V.; Reviberpol 2003, 4, 91.
2. Morimoto, M.; Saimoto, H.; Shigemasa, Y; TIGG 2002, 14, 205.
3. Ravi Kumar, M. N. V.; Muzzarelli, R. A. A.; Muzzarelli, C.; Sashiwa, H.; Domb, A. J.; Chem. Rev. 2004, 104, 6017. 4. Jeuniaux, C.; Bull. Soc. Zool. Fr. 1982, 107, 363. 5. Guibal, E.; Sep. Purif. Technol. 2004, 38, 43.
6. Varmaa, A. J.; Deshpandea, S. V.; Kennedy, J. F.; Carbohydr.
Polym. 2004, 55, 77.
7. Ogawa, K.; Oka, K.; Yui, T.; Chem. Mater. 1993, 5, 726. 8. Domard, A.; Int. J. Biol. Macromol. 1987, 9, 98. 9. Braier, N. C.; Jishi, R. A.; THEOCHEM 2000, 499, 51. 10. Raíz, M.; Desbrieres, J.; Tolaimate, A.; Rinaudo, M.; Vottero,
P.; Alagui, A.; El Meray, M.; Eur. Polym. J. 2002, 38, 1523. 11. Lima, I. S.; Airoldi, C.; Thermochim. Acta 2004, 421, 133. 12. Park, J. W.; Park, M.; Park, K. K.; Bull. Korean Chem. Soc.
1984, 5, 108.
13. Raíz, M.; Desbrieres, J.; Tolaimate, A.; Rinaudo, P.; Vottero, P.; Alagui, A.; Polymer 2002, 43, 1267.
14. Ruey-Shin, J.; Feng-Chin, Wu.; Ru-Ling, T.; Water Res. 1999,
33, 2403.
15. Chihpin, H.; Ying-Chien, C.; Ming-Ren, L.; J. Hazard. Mater.
1996, 45, 265.
16. Hiroaki, M.; Hisayoshi, I.; Nobumasa, A.; Tadao, O.; Anal.
Chim. Acta 1999, 378, 279.
17. Yang-Chuang, C.; Song-Wen, C.; Dong-Hwang, C.; React.
Funct. Polym. 2006, 66, 335.
18. Qian, A. X. S.;He, G. H. F.; Han, X.; Analyst 2001, 126, 239. 19. Xiaohui, W.; Yumin, Du.; Hui, L.; Carbohydr. Polym. 2004,
56, 21.
20. WHO, Manganese, Environmental Health Criteria, No. 17, ICPS, 1981.
21. WHO, Copper, Environmental Health Criteria, No. 200, ICPS, 1998.
22. WHO, Zinc,Environmental Health Criteria, No. 221, ICPS, 2001.
23. Franco, A. P.; Mercê, A. L. R.; React. Funct. Polym. 2006, 66,
667.
24. Lombardi, S. C.; Mercê, A. L. R.; Bioresour. Technol. 2003,
89, 63.
25. Mercê, A. L. R.; Carrera, L. C. M.; Romanholi, L. K. S.; Recio, M. A. L.; J. Inorg. Biochem. 2002, 89, 212.
26. Mercê, A. L. R.; Landaluze, J. S.; Mangrich, A. S.; Szpoganicz, B.; Sierakowski, M. R.; Bioresour. Technol. 2001, 76, 29. 27. Schwarzenbach, G.; Flaschka, H.; Complexometric Titrations,
Methuen & Co.: UK, 1969.
28. Gans, P.; Sabatini, A.; Vacca, A.; Talanta 1996, 43, 1739. 29. Baes, C. F; Mesmer, R. E.; The Hydrolysis of Cations, John
Wiley & Sons: USA, 1976.
30. Alderighi, L.; Gans, P.; Ienco, A.; Peters, D.; Sabatini, A.; Vacca,
A.; Coord. Chem. Rev. 1999, 184, 311.
31. Chiessi, E.; Branca, M.; Palleschi, A.; Pispisa, B.; Inorg. Chem.
1995, 34, 2600.
32. Silva, J. A.; Felcman, J.; Mercê, A. L. R.; Mangrich, A. S.; Lopes, R. S. C.; Lopes, C. C.; Inorg. Chim. Acta 2003, 56, 155. 33. Lever, A. B. P.; Inorganic Electronic Spectroscopic, 2nd ed.,
Elsevier: Netherlands, 1984.
34. Jian, G.; Shun, Z.; J. Mol. Catal. A: Chem. 2002, 186, 25. 35. Sipos, P.; Berkesi, O.; Tombácz E.; Pierre, T. G.; Webb, J.; J.
Inorg. Biochem. 2003, 95, 55.
36. Cárdenas, G.; Orlando, P.; Edelio, T.; Int. J. Biol. Macromol. 2001, 28, 167.
37. Osman, Z.; Arof, A. K.; Electrochim. Acta 2003, 48, 993. 38. Nakamoto, K.; Infrared Spectra of Inorganic and Coordination
Compounds, 4th ed., John Wiley & Sons: New York, 1963.
39. Vázquez, C. R.; Compuestos de Coordinación, Pueblo y Educación: Habana, 1983.
40. Puschmann, H.; Batsanov, A. S.; Howard, J. A. K.; Soto, B.; Bonne, R.; Au-Alvarez, O.; Acta Crystallogr. 2001, E57, m524. 41. Puschmann, H.; Howard, J. A. K.; Soto, B.; Bonne, R.;
Au-Alvarez, O.; Acta Crystallogr. 2001, E57, m581.
42. Annigeri, S. M.; Sathisha, M. P.; Revankar, V. K.; Trans. Metal Chem. 2007, 32, 81.
43. Monteiro Jr., O. A. C.; Airoldi, C.; J. Colloid Interface Sci.
1999, 212, 212.