Generating more realistic complex networks from power-law distribution of fitness
G. A. Mendes and L. R. da Silva
Departamento de F´ısica and National Institute of Science and Technology for Complex Systems, Universidade Federal do Rio Grande do Norte
59072-970 Natal-RN, Brazil
(Received on 27 February, 2009)
In this work we analyze the implications of using a power law distribution of vertice’s quality in the growth dynamics of a network studied by Bianconi and Barab´asi. Using this suggested distribution we show the degree distribution interpolates the Barab´asiet al.model and Bianconiet al.model. This modified model (with power law distribution) can help us understand the evolution of complex systems. Additionally, we determine the exponent gamma related to the degree distribution, the time evolution of the average number of links,<ki>∝
(t/i)β(i coincindes with the input-time of theithnode), the average path length and the clustering coefficient.
Keywords: Power-law, Scale-free networks, Complex networks, Fitness model
1. INTRODUCTION
The complex system’s range is broad, covering not only the daily phenomenon in our lives, but sophisticated problems with amazing results (phase transition, S.O.C, small-world). One subject of this range is the complex networks that have received a lot of attention from researchers. It is composed by a set ofNnodes (or vertices) and a set of links (or edges) that connect two vertices in the system. The large-scale topology systems are determined by in the dynamic forces that act at the level of an individual node. The preferential attachment might have important consequences in dynamic process tak-ing place in the topology defined by the network because it is responsible for the system’s correlations. Nowadays the study of complex networks is focused on random graphs and scale-free nets. For a long time graphs have been modeled as completely random. A well known example is the paper pub-lished by the Hungarian mathematicians Erd¨os and R´enyi [1] where a network generated by placing links among the nodes at random is studied. However such a model cannot describe the topological properties of real complex networks due to some physic quantities them associated by usual exponential laws instead of power-law asymptotic behavior. Furthermore, in general real networks are more complex than Erd¨os and R´enyi model and exhibit birth and death of nodes, aging [2], the links depending on some parameter (connectivity [3], fit-ness [4, 5], geographic distance [6, 7], etc).
In 1999 Barab´asi and Albert (BA) [3] introduced the model of random growth graphs displaying power law distributed connectivity. To obtain this fantastic result, they used at least two coexisting mechanisms, they are (i) growth (the system expands by adding new nodes which attach to the nodes al-ready present in the network) and (ii) preferential attachment (a new node links to nodes which already exist. This process takes place with a higher probability when the sites present a higher number of neighbours ”Barab´asi and Albert model”). Despite its success in exhibiting the degree distribution fol-lowing a power law (Fig. 1), this simple and basic model predicts that all nodes increase their connectivity in time as ki(t) = (t/ti)β, where β=1/2 and ti is the time at which
node i has been added into the network. As the exponent has the same value for all nodes, the oldest vertices will have the highest number of links. Note that new nodes attach pref-erentially to the oldest ones, i.e. the most connected ones.
100 101 102 103 104
k 1e-06
1e-04 1e-02 1e+0
P(k)
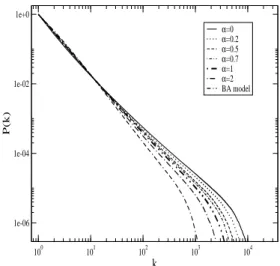
α=0 α=0.2 α=0.5 α=0.7 α=1 α=2 BA model
FIG. 1: It shows the cumulative degree distributionsP(k)in log-log plot for typical valuesαand BA model (γtheoretic=3). The continu-ous lines are the numerical results (network with 100000 nodes and 3000 runs).
hu-man sexual contacts where individuals are the nodes and sex-ual relations among them are the links [9]; and the citation networks where published articles are the nodes and a link represents a reference to a previously published article [10]. All these examples establish a methodology that defines links and vertices in their specific subject. However they appear to display considerable topological similarity, having degree distributions which behave as power-law.
Another feature easily seen from the examples above is the number of nodes increases during the evolution of the net. Better observing the WWW, we note that some new HTML documents acquire links at a higher rate than the oldest nodes (e.g. the site http://www.youtube.com has a high degree dis-tribution despite being new). This phenomenon allows new documents to become hubs. Our intuition indicates that pref-erential attachment for systems similar to WWW must de-pend on connectivity and other parameters. A good candidate to be the other parameter is something associated to content and marketing of this document. Bianconi and Barabsi [4] associate the ”good candidate” with some intrinsic quality of nodes, such as the content of a web page in the WWW, the skill in the sexual network or the knowledge in the citation network. They call this parameter the node’s fitness. In this direction, the system becomes heterogeneous and its individ-ual elements influence the net depending on the qindivid-uality factor. The plan of this paper is as follows: in Section II, we present the mechanism which generates more realistic net-works, i.e. nodes having different fitness which follow a power-law distribution, ρ(η)∝ ηα, growth and preferential attachment. Further we present numerical simulations and the method of calculation which are based on monte carlo method and continuum theory respectively employed here. Finally, we determine the exponentγ related to degree distribution, the time evolution of the average number of links, <ki >,
the average path length and the clustering coefficient. Section III is devoted to the discussion and results of the topological properties.
2. MODEL AND THEORY
The examples discussed above and others presented in the literature indicate that the incorporation of additional features change the scaling behavior of random growth networks. In particular the BA and fitness model differ markedly in pref-erential attachment. The first one, P(i←→ j =N+1) = ki/∑Ni=Nki, obtains P(k)∝k−3. The second one, P(i←→
j=N+1) =niki/∑Ni=Nniki, generatesP(k)∝k−2.25/log(k)if
the fitness’s variable is uniformly distributed. But in nature we believe that the distribution does not follow this simple distribution. So, we are interested in focusing on the effects of power-law distribution of vertice’s quality in the growth dynamics of a network . There are two choices to study these fields, they are (i) (α>0) it means that a small part of the nodes has short fitness and a major portion of sites has high fitness and (ii) (−1<α<0) a little part of nodes has high fitness and a major portion of sites has short fitness. So their distribution is exactly the opposite. In the present paper, we choose the first case (α>0). It doesn’t implicate this case is more realistic than other case. Moreover, both situations con-verge to the same value ofDbeing also limited by BA model
and Fitness model. We hope with this distribution to better characterize the real aspect of existing correlations in nature and technology.
The complex net was constructed with links which are not direct and weightless. The network grows sequentially by adding a node at each time. It starts withm0nodes, each one
with fitnessηithat is distributed according to a function given
by:
ρ=Aηα, (1)
where A is a constant and theηi is assigned a value in the
range from 0 to 1.
At every time step we add a new node iwith fitness ηi.
Again this parameter follows the same power-law distribu-tion. We link this node tom(≤m0)of the pre-existing nodes
in the system. After it, we establish its connections by consid-ering the linking probability which depends on connectivityki
and the fitnessηiof the nodei, and is given by:
P(i←→ j=m0+1) =
niki ∑Ni=Nniki
. (2)
This procedure is used to include the third site, the fourth site, and so on. The network growth process is sequentially repeated up to the size desired for the system (N=t+m0)
wheret is the time variable. Note how the rule above priv-ileges the connection between new nodes and those having high nearest neighbors and fitness jointly. The dynamical properties of this model can be addressed using the partial differential equation given by:
∂ki(t) ∂t =m
ηiki ∑
j
kjηj
, (3)
whereki(t) is a continuous real variable and the boundary
condition ki=t(t) =m. It gives us the temporal dependence
of number of links and, more precisely, it tell us how asymp-totically it increases with timet/i. The equation 3 describes the rate at whichkiproportionally changes to preferential
at-tachment. The factor mis related to the fact that one new node contributes withmlinks to the network and the sum in the denominator is over all pre-existed nodes. The solution to equation 3 is given by [4]:
kηi(t,t0) =m t
t0
β(ηi)
, (4)
wheret0 is the time at which the nodei was born and the
dynamic exponent,β(ηi), depends on the fitness of the node,
i. The dynamic exponent can be written as β(ηi) =
ηi
D, (5)
where
D=
Z
dη ρ(η) η
0 50 100 150 200 250 300
α
1 1.1 1.2 1.3 1.4 1.5 1.6 1.7 1.8 1.9 2 2.1
D
0 50 100 150 200 250 300
FIG. 2: Asymptotic behavior ofDobtained from equation (8) by varyingα.
For a long time, the sum over all existing nodes is
<
∑
jηjkj>→Dmt. (7)
Note that β(ηi) depends on D and this depends on ρ(η).
Then, to calculate the dynamic exponent, it is necessary to solve the integral (6) substitutingβ(η) byη/D. After this step, the integral becomes
1= ηmax
Z
0
dη ρ(η)D1 η−1
, (8)
whereηmax is the highest quality presented in the network.
Note that the exponentβ(η)>0 because a node always in-creases the number of connections with the time evolution. Another condition is that connectivity site,ki(t), cannot gain
more than one link by each time step,t, soβ(η)<1, i.e. the term D/ηinside of the integral (7) has a value higher than one. And, the upper limit of constant isD≤2ηmax, which
is obtained from equation (7), and the expression∑jηjkj≤ ηmax∑jkj=2mtηmax. Finally, we can calculate the value of
constant D (associated to the know-how of all the network sites) that only depends on the fitness distributionρ(η)(Eq. ((8)).
Now, we will obtain the exponentγof degree distribution, P(k)∼k−γ[4, 17]. The probability that a node has a degree ki(t)smaller thankis:
P(kη(t)>k) = P
"
m
t t0
β(η) >k
#
= P
t0<t
m
k
Dη
. (9)
Remember that in this model we have a spectrum of dynam-ics exponents β(η)and the sites were added at equal time intervals, so the constant probability density is given by
P(ti) =
1 m0+t
. (10)
Using the equations 9 and 10, the probability that a site hask links can be written in this form:
P(k) = ηmax
Z
0
dη∂P(kη(t)>k) ∂k
∝
ηmax
Z
0
dη ρ(η)D η
m
k
Dη+1
. (11)
Bianconi and Barab´asi showed the agreement between the prediction (Eqs. 11, 5 e 8) and the simulation for the exponent βand degree distributionP(k)[4].
100 101 102 103 104 105
t/t0 100
101 102 103
kη
(t,t
0
=9)
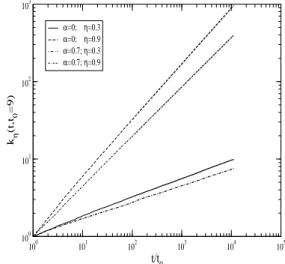
α=0; η=0.3 α=0; η=0.9 α=0.7; η=0.3 α=0.7; η=0.9
FIG. 3: The symbols are the numerical results of the temporal de-pendency of the average connectivity for different values ofαandη. The plot is on a log-log plot and the results are obtained for networks with 100000 node and 1000 runs.
0 0.1 0.2 0.3 0.4 0.5 0.6 0.7 0.8 0.9
η
0 0.1 0.2 0.3 0.4 0.5 0.6 0.7 0.8
β(η)
alpha=0 alpha=0.2 alpha=0.5 alpha=1 alpha=2
3. RESULTS AND CONCLUSIONS
In this section we will present our numerical results in or-der to characterize a scale-free network with power-law dis-tribution of fitness. First of all, to analyze the implications in the quality model using the power-law distribution of fitness, ρ(η) =Aηα, where we should substituteρin the equation (8). It gives
1 A=
Z D
D−ηmax
dy(D−y) α+1
y . (12)
and its normalization is
Z 1
0 ρ(η)
dη=1. (13)
Thus, A=α+1 and the fitness distribution diverges for α<0, so we studied only the effects of α≥0. Solving the integral (12) by numerical methods and varying the para-menter α (α≥0), one may find a crossover between the Barab´asiet al. [3] and Bianconiet al. model [4] (Fig. 2). The alternative manner to find the constantDis calculating
<∑iηiki> /mt→D in thet→∞limit. In particular, the
casesα=0 andα→∞represent the network with uniform distribution of fitness and system without quality factor (or all sites with the same fitness factorρ(η) =δ(η−1)), respec-tively. It is easy to see the upper limit being the Barab´asiet al.model observing the plot (2). Whenαgoes to infinity, the average fitness goes to unity andD→2, recovering the BA model (β=0.5). Another topologic property (connectivity distribution, average path length and clustering coefficient) must interpolate the BA model and Bianconi et al. model (Figs. (1, 5 and 6)).
When we observe the time dependence of the connectivity, kη(t)(Figs 3 and 4), an interesting feature of power-law dis-tribution of fitness is found. For a smallαfactor, the value of fitness is very strong to compete for links, while for a highα factor this difference becomes negligible. The explanation is simple, as theαvalue increases, the vertices’ quality becomes similar, so the termηiin the preferential attachment becomes
only a constant.
In Fig. 1, we show the accumulative connectivity distri-bution for different values ofα and BA model. From this plot, we check that exponentγvaries from 2.255 (Bianconi and Barab´asi model) to 3 (BA model). The number of hubs and their connectivity decrease asαbecomes large. Note that most the networks in nature and technology have exponentγ in similar interval of values studied by us for example: World Wide Web [17], citations [10], telephone [18], and energy landscape [19].
Figure 5 shows the average path length,<l>, which de-pends on α for m=2 and can be compared with the BA model. The average path length,<l>, of a network is de-fined as the number of edges in the shortest path between two nodes averaged over all the pairs of nodes present in the net. We see that, whenαincreases,<l>behaves like a<l>
well-known of BA model. It is explained by the number of hubs in the system. The system with more hubs has a small value of average path length, i.e., the caseα=0 has the high-est<l>in our study.
1e+04 1e+05
number of vertices 4
4.5 5 5.5 6
average path length
BA model α=300 α=2 α=1 α=0.7 α=0.5 α=0.2 α=0 m=2
FIG. 5: It shows the average path length in linear-log plot for typical valuesα. The symbols are the numerical results (80 runs for each size of network).
1e+04 1e+05
number of sites 1e-03
1e-02 1e-01
clustering coefficient
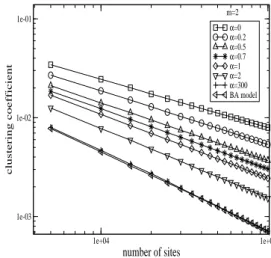
α=0 α=0.2 α=0.5 α=0.7 α=1 α=2 α=300 BA model m=2
FIG. 6: It shows the clustering coefficient log-log plot for typical valuesα. The symbols are the numerical results (80 runs for each size of network).
Plot 6 shows the clustering coefficient which depends onα form=2 and can be compared with the BA model. The clus-tering coefficient of network characterizes the density of con-nections close to a node. Note that whenαincreases, the clus-tering coefficient becomes similar to Bianconi and Barab´asi model.
In this paper, we study the effect of the competition be-tween the relevant variable for connectedness when we use a power-law distribution of fitness. In the fitness model, the popular nodes compete with younger nodes when the fitness is an important factor that permits them to obtain more links. By including the exponentαwe control the influence of fit-ness factor of each node in the net. Whenαis null we recover the Bianconi and Barab´asi model; whenα→∞, we recover the BA model. The average connectivity<ki>, the average
appre-ciably influenced by the exponentα. When we compare our results with the BA model, we find that the number of links per nodes has risen for all values ofα.
Acknowledgements We acknowledge valuable
discus-sions with Constantino Tsallis. The authors gratefully ac-knowledge the financial support from Conselho Nacional de Desenvolvimento Cient´ıfico e Tecnol´ogico (CNPq)-Brazil and Coordenac¸˜ao de Aperfeic¸oamento de Pessoal de N´ıvel Superior (CAPES)-Brazil.
[1] P. Erd¨os and R´enyi, Publ. Math. (Debrecen)6, 290 (1959). [2] S.N. Dorogovtsev and J.F.F. Mendes, Physical Review E62,
1842 (2000).
[3] A.L. Barab´asi and R. Albert, Science286, 509 (1999). [4] G. Bianconi and A.-L. Barab´asi, Europhysics Letters54, 436
(2001).
[5] A. V´azquez, cond-mat/0006132 (2000).
[6] D.J.B. Soares, C. Tsallis, A.M. Mariz and L.R. da Silva, Euro-physics Letters70, 70 (2005).
[7] M.D. de Meneses, D.J.B. Soares, S.D. da Cunha and L.R. da Silva, Progress of Theoretical Physics Supplement 162, 131 (2006).
[8] R. Albert, H. Jeong and A.-L. Barab´asi, Nature 401, 130 (1999).
[9] F. Liljeros, C.R. Edling, L.A.N. Amaral, H.E. Stanley and Y. Aberg, Nature411, 907 (2001).
[10] S. Redner, Eur. Phys. J. B23, 267 (1998).
[11] P.G. Lind, L.R. da Silva, J.S. Andrade Jr and H.J. Herrmann, Physical Review E74, 036117 (2007).
[12] A.A. Moreira, J.S. Andrade Jr and L.A.N. Amaral, Physical Review Letters89, 268703 (2002).
[13] P.G Lind, L.R. da Silva, J.S. Andrade Jr and H.J. Herrmann, Europhysics Letters78, 68005 (2007).
[14] A.A. Moreira, D.R. Paula, R.N. Costa Filho and J.S. Andrade Jr, Physical Review E73, 06501 (2006).
[15] V. Schwmmle, M.C. Gonz´alez, A.A. Moreira, J.S. Andrade Jr and H.J. Herrmann, Physical Review E75, 066108 (2007). [16] S.N. Dorogovtsev and J.F.F. Mendes, Evolution of Networks
(Oxford University Press, New York, 2003).
[17] R. Albert and A.-L. Barab´asi, Review of Modern Physics74, 47 (2002).