Article
Printed in Brazil - ©2016 Sociedade Brasileira de Química 0103 - 5053 $6.00+0.00
*e-mail: [email protected], [email protected]
Kinetic Analysis of the Decomposition of the KFe
3(SO
4)
2−x(CrO
4)
x(OH)
6Jarosite
Solid Solution in Ca(OH)
2Medium
Ister Mireles,a Iván A. Reyes,*,b,c Víctor H. Flores,d Francisco Patiño,e Mizraim U. Flores,d,f Martín Reyes,a Manuel Acosta,g Roel Cruzb and Emmanuel J. Gutiérrezb,c
aÁrea Académica de Ciencias de la Tierra y Materiales, Universidad Autónoma del Estado de
Hidalgo, 42183 Mineral de la Reforma Hidalgo-HI, Mexico
bInstituto de Metalurgia, Universidad Autónoma de San Luis Potosí,
78210 San Luis Potosí-SL, Mexico
cCatedratico CONACyT - Consejo Nacional de Ciencia y Tecnología, Colonia Crédito Constructor
Del. Benito Juárez, 03940 México-DF, Mexico
dEscuela Superior de Ingeniería Química e Industrias Extractivas, Instituto Politécnico Nacional,
Unidad Profesional Adolfo López Mateos, 07738 México-DF, Mexico
eIngeniería en Energía, Universidad Politécnica Metropolitana de Hidalgo,
43860 Tolcayuca-HI, Mexico
fÁrea de Electromecánica Industrial, Universidad Tecnológica de Tulancingo,
43642 Tulancingo-HI, Mexico
gDivisión Académica de Ciencias Básicas, Universidad Juárez Autónoma de Tabasco,
86690 Cunduacán-TB, Mexico
The decomposition of the solid solution of potassium jarosite with chromium(VI) in Ca(OH)2 media was studied in the present work. According to experimental results, the incorporation of CrO42− into the crystal structure of jarosite resulted in a solid solution with the following approximate formula: [K0.86(H3O)0.14]Fe2.67[(SO4)1.23(CrO4)0.77][(OH)5.01(H2O)0.99]. The experimental data describe a reaction based on the shrinking core model with chemical control for spherical particles. A reaction order of n = 0.67 and an activation energy (Ea) of 63.75 kJ mol−1 were obtained in the induction period (tind). The progressive conversion period is characterized by the diffusion of K+, SO42− and CrO42− ions into the solution. In this stage, n = 1.99 with respect to OH−, and Ea = 51.56 kJ mol−1. The CrO42− diffusion is slower compared to that of sulfate, a slight amount of chromate is adsorbed in the layer of the solid residue consisting on Fe(OH)3. Finally, the equations that satisfactorily describe the reaction process were established from the data obtained.
Keywords: jarosite, chromate ion, solid solution, dissolution rates, kinetics analysis
Introduction
Chromium is one of the most important elements in the world and it is widely used in the chemical and metal industries. The toxicity of chromium has been a matter of interest in several industrialized countries. The sources of anthropogenic contamination include: fuel and carbon burning, production of ferrochrome, chromate, steels containing chromium, fungicides, cement, pigments,
catalysis and oxidizers. Metal coating, leather tanning and oil drilling have increased this kind of pollution.1 This kind
of industrial and mining activities are the main source of chromium(VI) release into the environment.2 The recent
public concern regarding chromium(VI) in drinking water has boosted the research on technologies with potential to remove it from drinking water.3
posed by this metal has a great significance worldwide. The main chromium(VI) species are the chromate (CrO42−) and
dichromate (Cr2O72−) ions, which are quite soluble at any
pH level affecting its mobility and transport of chromium. Chromium(VI) may be leached from the soil and penetrate phreatic zones; it can become a part of an aquifer and even migrate into surface water.4 Due to the potential hazards to
human health, there is a growing interest in understanding the process controlling the mobility of chromium(VI) in the environment. This, in order to assess the risks associated with released chromium and to design effective measures to clean the polluted sites. A key issue in the process that affects the mobility of chromium in the surface is the precipitation of solid phases containing chromium.5
Throughout the years, attempts have been made to design more efficient systems of remediation for polluted water containing heavy metals. Some methods have been studied to control and reduce contamination by chromium(VI) in water and soil, including residual
biomass from tanneries to remove chromium(VI),6
removal by biomaterials,7 bioremediation,8-12 reduction of
chromium(VI) to chromium(III),13 use of residual organic
adsorbents,14 and electrochemical treatments.15 Among the
existing alternatives for the removal of chromium(VI), there can be found minerals such as goethite, schwertmannite and jarosite. Jarosite-type compounds have proved to be better adsorbents compared to other minerals in the removal of dangerous metals, such as arsenic.16 Since different ions can
be incorporated into the jarosite structure, their precipitation has been used as a method to concentrate metals in solution. Its solubility depends on the pH and, therefore, jarosite dissolution is of great importance when controlling the mobility of trace elements adhered to its structure.17
Jarosite belongs to the isostructural group jarosite-alunite, which has a general formula AB3(ZO4)2(OH)6.
Site A usually contains monovalent or divalent cations with a coordination number equal to or higher than 9,18 with most
of the ions in site A being K+, Na+ and H
3O+;19,20 however,
Pb2+, Ca2+ and NH
4+ can also be incorporated.21 Site B,
octahedrally coordinated, in which solid substitutions are not commonly complete, is filled by Fe3+ in the jarosite
group, and Al3+ in the alunite group,22 but this site may
also be partially substituted by Cr3+, V3+ and Ga3+. Site Z
is tetrahedrally coordinated, with SO42− being the dominant
ion in jarosites and alunites; however, partial substitutions by PO42−, AsO43−, CO32−, SbO42−, CrO42, SiO44− and SeO42−
have been reported.23-25 The stability and reactivity of the
jarosite mineral group depend on the substitution degree of other ions in sites A, B and on the tetrahedrons. The substitutions may result in an unbalance of the local charges and distort the lattice, thus introducing variations
in the free energy, which have an influence on the mineral’s stability. Jarosites remain stable at highly acid and oxidizing conditions.26 Several substitutions have been reported
showing the flexibility of the jarosite structure towards the ion size and the charge arrangement. This characteristic makes minerals such as jarosite ideal to incorporate undesirable metallic elements that are also potentially dangerous for the environment.27 The ion substitutions that
alter the parameters of the unit cell of the ideal jarosite have been shown regarding the influence of dissolution and solubility rates. The substitution of H3O and Na in site A
significantly increases the jarosite solubility compared to jarosite with K, while the substitution of chromate by sulfate decreases the solubility of potassium jarosite.5,22
The most widespread method used to mitigate acid effluents is an active treatment process involving addition of a chemical-neutralizing agent, being lime the most common used agent. Addition of lime to acid mine drainage (AMD) raises its pH, accelerates the rate of chemical oxidation of ferrous iron and causes precipitation of metals present as hydroxides and carbonates.28,29 For this reason, it is
important to know the behavior of the phases that may contain elements of environmental importance, such as chromium(VI) in their structure, produced from Ca(OH)2
under alkaline conditions. Understanding the dissolution reactions of such phases is notably important for an environmental assessment (for water and soil), since some of these elements could either return to the environment after being subjected to a mitigation process with a chemical-neutralizing agent. Although several studies have been conducted in KFe3(SO4)2(OH)6 and KFe3(CrO4)x(OH)6
solid solutions, there are no kinetic studies related to the decomposition of KFe3(SO4)2−x(CrO4)x(OH)6 in Ca(OH)2
medium. In the present investigation, it was decided to incorporate chromium(VI) into the potassium jarosite since it is the most common phase in continental soil environments with enriched K, including AMD sediments and acid soil systems. Hydronium jarosite was synthesized in laboratory, although it is important to mention that its presence is not commonly observed in natural samples, which suggests that in normal soil conditions, sodium and potassium jarosites are the most stable phases that could be preserved at geological time scale.30 Therefore, the aim of
this study is to provide information regarding the stability of the KFe3(SO4)2−x(CrO4)x(OH)6 solid solution in Ca(OH)2
medium, as well as its nature and kinetics. The effects of variables, such as concentration of anion hydroxide ([OH−]), temperature (T) and particle size (d
0), were studied
in turn will allow obtaining information about the stability of this compound under extreme alkalinity and temperature conditions.
Experimental
Synthesis
For the two syntheses performed, a procedure similar to that reported in previous works was followed;31-36
the conditions are specified in Table 1. Iron(III) sulfate n-hydrate, ≥ 73% as Fe2(SO4)3, anhydrous potassium
sulfate (99%), potassium chromate (≥ 99%), iron(III) nitrate 9-hydrate (≥ 98%), calcium hydroxide (≥ 95%) and sulfuric acid (98%) were used, all in ACS grade (J. T. Baker, Tokyo, Japan). Salts that promote the formation of jarosite-type compounds were mixed in a 0.5 L of distilled water (26 MΩ cm) using a reactor (Pyrex, Corning Incorporated, Corning Inc., NY, USA) with a capacity of 1 L. A solution of 0.2 mol L−1 of dissolved K
2CrO4 was prepared in a
100 mL volumetric flask (Pyrex, Corning Incorporated, Corning Inc., NY, USA) and then added to the reactor at a rate of 25 mL h−1. A mechanical stirrer with a three blade
propeller (IKA-RW 16 basic, IKA Works, Inc., Wilmington, NC, USA) was used at a stirring rate of 500 min−1 to keep
the jarosite precipitates in suspension and promote faster crystal growth. The reactor was placed on a heating plate at 94 °C (Barnstead Thermolyne Super-Nuova, Thermo Fisher Scientific, Waltham, MA, USA) and coupled to a spiral condenser to make water circulate as a cooling fluid. The total time for the synthesis was 24 h. The obtained solids were vacuum-filtered with Whatman quantitative filter paper, grade 40 (Sigma-Aldrich, St. Louis, MO, USA) and repeatedly washed with hot (ca. 60 °C) distilled water to remove excess of K+, Fe3+, SO
42− and CrO42−. Then, they
were dried in a furnace at 60 °C for 8 h. The same conditions used for the first synthesis, without adding K2CrO4, were
used for the KFe3(SO4)2(OH)6 synthesis.
Characterization of precipitates
The granulometric characterization was conducted with series of Tyler test sieves (according to ASTM E11 - 13 Standard Specifications for Woven Wire Test Sieve Cloth
and Test Sieves)37 using mesh numbers 120 (d
0≥ 125 µm),
170 (125 < d0 ≥ 90 µm), 200 (90 < d0 ≥ 75 µm),
270 (75 < d0 ≥ 53 µm), 325 (53 < d0 ≥ 44 µm),
400 (44 < d0 ≥ 38) and 500 (38 < d0 ≥ 25 µm). For
the chemical analysis, 1 g of the solid solution KFe3(SO4)2−x(CrO4)x(OH)6 was dissolved in a solution of
20 mL H2O + 20 mL HCl. Atomic absorption spectrometry
(AAS, AAnalyst 200, PerkinElmer, Waltham, MA, USA) was used to determine Fe, K and Cr, while gravimetric analysis were carried out to determine SO42− as BaSO4. Both syntheses
were characterized by scanning electron microscopy (SEM, JEOL JSM-5900LV, JEOL USA, Inc., Peabody, MA, USA) with a coupled energy dispersive X-ray spectrometer (EDS, INCA X-Sight Model, Oxford Instruments plc, Abingdon, UK), and X-ray diffraction (XRD, Siemens D500, Siemens AG, Munich, Germany) using Cu Kα radiation (1.54056 Å) with a scanning step of 0.02° s−1.
Decomposition experiments in Ca(OH)2 medium
T h e d e c o m p o s i t i o n e x p e r i m e n t s o f KFe3(SO4)2−x(CrO4)x(OH)6 solid solution were conducted
in a 1 L glass reactor. Different solution concentrations were prepared by stirring Ca(OH)2 in a volumetric flask;
the stirring time was 3 h and the highest concentration used was 1.4 g L−1, since the solubility of Ca(OH)
2 is 1.65 g L−1 in
H2O at 20 °C;38 the flask was sealed with Parafilm laboratory
film (Pechiney Plastic Packaging, Bemis Company, Inc., Oshkosh, WI, USA) to avoid carbonatation, and it was vacuum filtered with Whatman quantitative filter paper, grade 40 (Sigma-Aldrich, St. Louis, MO, USA). During the reaction, the solution was mechanically stirred with a four-blade propeller at a rate of 500 min−1. The reactor was placed
on a heating plate with automatic temperature control and a precision of ca. 0.5 °C. In addition, 0.2 ± 0.0001 g of the synthetic solid with a particle size of 53-74 µm were used.
The pH was measured in all experiments in the bulk of the solution using an Orion 3-Star pH meter equipped with a Thermo Ultra-Sure flow electrode (Thermo Fisher Scientific, Waltham, MA, USA), which has a reading precision of ca. 0.01 and a range of 0-14 at a maximum temperature of 100 °C. It was also equipped with an automatic temperature compensation (ATC) electrode with an accuracy of 0-100 ± 0.5 °C. To obtain accurate pH measurements,
Table 1. Syntheses conditions of the jarosite-type compounds
Initial condition / (mol L−1)
Fe2(SO4)3 nH2O K2SO4 K2CrO4 Fe(NO3)3 9H2O
Synthesis 1 0.300 0.300 − −
the electrode was calibrated with three standards: 4.00 (potassium biphthalate solution), 7.00 (NaH2PO4-KH2PO4
solution) and 10.01 (H3BO3-HCl-NaOH solution) at 25 °C.
The slope in all of the calibrations was 96.0 ± 5.0%. The pH meter automatically adjusts the calibration and pH readings to the working temperature. The pH in all the experiments was kept constant by adding small amounts of a concentrated Ca(OH)2 solution. During experiments,
either to determine the effect of [OH−], temperature or
particle size effect, one of the variables was modified while the other two were kept constant.
In order to know the progress of the reaction, samples of 5 ± 0.01 mL were taken at different times and then analyzed for K+ and CrO
42− by AAS, and SO42− by gravimetry. To
describe the development of the reaction, the conversion, X, was used. This later, is the mass fraction of the reacting substance and can be calculated according to equation 1:
(1)
where X is the fraction of the KFe3(SO4)2−x(CrO4)x(OH)6
solid solution that has reacted; At is the amount of K, S or Cr
that were released into the solution; and Aτ is the amount of K, S or Cr at the end of the reaction.39 A number of previous
experiments were conducted to select the kinetic model that best describes the behavior of the decomposition reactions. Residual solids were characterized by XRD and SEM-EDS.
Results and Discussion
Synthesis and characterization
Yellow-colored precipitates corresponding to KFe3(SO4)2(OH)6 were obtained in synthesis 1, with a
total yield of 85.76 g. The yield of the solid solution KFe3(SO4)2−x(CrO4)x(OH)6 under the above mentioned
conditions was 29.78 g and a reddish-colored precipitate was obtained due to the considerable decrease of SO42−.
There is also a competition with CrO42− for the substitution
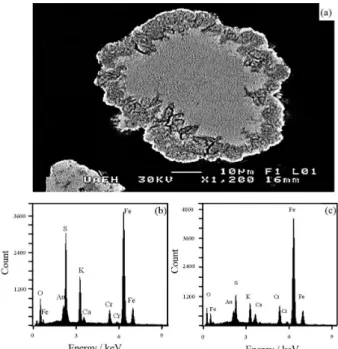
in the structure. Figures 1a and 1b show particles of KFe3(SO4)2−x(CrO4)x(OH)6 with a compact spherical
morphology, which are composed of soundly joined rhombohedral crystals. Most of crystal have sizes between 1 and 5 µm, but even smaller crystals can be observed. These later, are mainly composed of the jarosite analog KFe3(CrO4)2(OH)6.
Chemical analyses of the solids show that the stoichiometry of the syntheses corresponds to that of jarosite-type compounds.The total percentage of the composition of the solid solution is the following: 6.7% K+,
29.88% Fe3+, 27.71% SO
42−, 17.23% CrO42− and 18.48%
(H3O+ + OH− + H2O), which was calculated by difference.
The approximate formula was obtained from the chemical analysis and it is shown in equation 2:
[K0.86(H3O)0.14]Fe2.67[(SO4)1.23(CrO4)0.77][(OH)5.01(H2O)0.99] (2)
It can be observed that there is a deficiency in K+,
which is attributed to the substitution of the H3O+ ion on
site A, forming a solid solution between K+ and H
3O+, with
K + H3O = 1. There is also a deficiency in Fe3+ compared
to the theoretical formula of jarosite, which is due to the conversion of OH− ions into H
2O to balance the charge in
the structure. This kind of behavior is typical of numerous jarosite-type compounds, both natural and synthetic.28,36,38-42
Site Z is fully occupied by SO42− in the potassium jarosite,
but it can be substituted by varying the amount of chromate until it is completely substituted.43 It was observed that, the
larger the radius of the ions that incorporate in the anionic site, the bigger the difficulty to compete with the SO42−
ion. This is the main limiting factor for the incorporation of a larger amount of CrO42− with SO42− still present. The
general stoichiometry of the synthesis of the solid solution is shown in equation 3:
3Fe3+ + K+ + (2 – X)SO
42– + XCrO42– + 6H2O →
KFe(SO4)2–x(CrO4)x(OH)6 + 6H+ (3)
Figure 1. (a) Spherical particle of the obtained precipitates of potassium
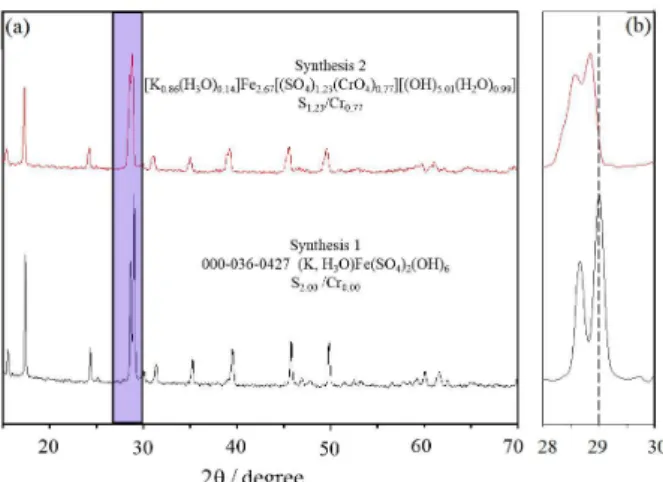
Analysis of the precipitates by XRD (Figure 2a) shows that the peaks obtained in the diffractogram are consistent with those of the Joint Committee on Powder Diffraction Standards (JCPDS; International Centre for Diffraction Data, ICDD) corresponding to the potassium jarosite pattern JCPDS-ICDD.44 The reflections in both syntheses correspond
to jarosite-type compounds KFe3(SO4)2(OH)6. Besides, no
additional intensity peaks that may suggest the existence of other crystal phases are observed. The unit cell volume is larger in the solid solution KFe3(SO4)2−x(CrO4)x(OH)6
than that of synthesis 1, which corresponds to a pure jarosite-type compound. This is due to the fact that chromium(VI) anions have an ionic radius between 0.03225 and 0.05200 nm, while sulfur(VI) anions have an ionic radius between 0.029 and 0.034 nm, which produces thermochemical radii different for each of the two cases (2.4 Å for CrO42− and 2.3 Åfor SO42−). The difference
between bond distances makes the XRD peaks shift towards smaller angles. Figure 2b shows the region where the two most intense peaks of potassium jarosite (synthesis 1) and of the solid solution KFe3(SO4)2−x(CrO4)x(OH)6 (synthesis 2)
appear shifted. This change indicates that a solid solution, instead of a two-phase mix, was obtained. Otherwise, different groups of peaks would appear for each phase, which did not happen.22
Nature of the decomposition reaction
I n o r d e r t o d e t e r m i n e t h e n a t u r e o f t h e decomposition reaction, samples of the solid solution KFe3(SO4)2−x(CrO4)x(OH)6 were taken and treated with
Ca(OH)2; they were analyzed for K+ and CrO42− by AAS,
and for SO42− by gravimetry, at different times. The solid
residues were characterized by SEM-EDS. The general reaction is composed of three stages: induction period,
progressive conversion period and stabilization period. During the induction period, the particles do not react, and the diffusion of K+, SO
42− and CrO42− ions is very slow.
During this stage, the active centers are formed starting and establishing a reaction front. Anions hydroxide start diffusing through the reaction front from the reaction medium into the particle core. This stage is followed by a progressive conversion period, which is characterized by the formation of a layer of inert products that increases in thickness as the reaction progresses; the core size decreases, as well as the diffusion of K+, SO
42− and CrO42−
ions from the particle core into the reaction medium. The stabilization stage indicates that the reaction has ended, with the concentrations of K+, SO
42− and CrO42− constant
in the solution (Figure 3a).
There are two models in heterogeneous kinetics that can define a chemical reaction: the progressive conversion model and the shrinking core model. The performed experiments are useful for knowing the stage that controls the decomposition reaction and for determining the model that best describes its behavior. In numerous cases, the shrinking core model is the one that best describes the real behavior. Since the resistances of the different stages can be different, the stage controlling the rate is that which presents a higher resistance. In the shrinking core model, there are several stages that control the reaction: diffusion through the fluid film, that surrounds the particle; transport of matter through the layer of inert solids; chemical reaction between the unreacted core interface and the layer of inert products; and a mixed control. The resistance of the fluid film that surrounds the particle can be excluded, because when a layer of inert products is formed, the resistance through it is usually much higher. The following kinetic model (equation 4) describes the reaction when the transport of matter through the layer of inert products is the controlling stage:
kexpt = 1 – 2(1 – X) – 3(1 – X)2/3 (4)
where X is the fraction of the solid solution that has reacted, kexp is the experimental rate constant and t is the time.45,46
If the rate of the chemical reaction is slow compared to that of the transport of matter, equation 5 defines the behavior of the reaction:
kexpt = 1 – (1 – X)1/3 (5)
In order to prove which of the two equations describes better the actual behavior, experiments were conducted at constant [OH−], T and d
0 and the solid conversion
was determined at different times. A representation of equations 4 and 5 that are function of XK, fraction of
Figure 2. (a) X-ray patterns corresponding to jarosite-type compounds;
potassium in solution against of time should be linear. The slope of any of the equations is kexp, while the intersection
with t represents the induction time (tind), which represents
the duration of the induction period.
Figure 3a shows the progress of a decomposition reaction for K, Cr and S. On the other hand, Figure 3b presents a comparison between equations 4 and 5 applied to the performed experiments. The shrinking core model with chemical control (equation 5) is the one that best describes the actual behavior of the decomposition reaction of the solid KFe3(SO4)2−x(CrO4)x(OH)6. Since the difference in the
linear regression coefficient for both models is not quite considerable, there can be no doubt that chemical control is the one that rules the global kinetics. However, in the control by transport, the order of reaction is always n = 1.0, the reaction rate depends little on temperature and it is sensitive to the stirring rate. On the other hand, when the chemical reaction is the controlling stage, the chemical rate constant is independent from the hydrodynamics and very sensitive to temperature, the order of reaction is different from n = 1.0; it is also independent from the formation or non-formation of layers of inert product.47 For such reasons, it can be
established that the shrinking core model with chemical control is the one that describes the decomposition reaction.
The experimental rate constant is thus expressed by equation 6:
(6)
where b is a stoichiometric coefficient, kq is the chemical
rate constant, CA is the reactant concentration, n is the
order of reaction, ρB is the density of the reacting solid,
and r0 is the initial particle radius. The density of the
solid was calculated with a 25 mL Brand pycnometer (Brand GMBH + CO KG, Wertheim, Germany) using distilled water as immersion liquid. The result was 2880 kg m−3.
Figure 4a shows a partially decomposed particle where a layer of solid residues, formed by the partial reaction of jarosite, can be observed; it is followed by a reaction front and an unreacted core. EDS analysis (Figures 4b and 4c) shows the presence of Cr, K, S, Fe and O in the particle core, which confirms that it has not reacted. The five analyzed elements can also be observed in the layer of solid residues. However, only Fe, Cr and O remain near the initial concentration, while the intensity peaks of K and S decrease drastically in the layer of solid residues, as they have diffused in larger proportion into the solution.
EDS linear scanning (Figure 5a) from the core to the layer of solid residues shows a uniform amount of K, Cr, S and Fe in the core, followed by a decrease in K and S, and a Fe increase in the solid residues. The amount of Cr remains constant because one part is adsorbed and retained in the reacted particle. Although one would think that S and Cr proportionally diffuse from the core into the solution, Cr diffuses in a much smaller proportion compared to S due to the similarity of their thermochemical radii. In some particles, the outline of the unreacted core may not be perfectly defined, as is the case with the particle used for
Figure 3. (a) Decomposition curve of the solid KFe3(SO4)2−x(CrO4)x(OH)6; (b) comparison between the shrinking core model by transport of matter and the shrinking core model with chemical control. XS, XK and XCr are the sulfur, potassium and chromium fractions in solution, respectively; AAS: atomic absorption spectrometry. Experimental conditions: [Ca(OH)2] = 1.4 g L−1, temperature = 30 °C, particle size (d0) = 53-74 µm, 500 min−1.
Figure 4. (a) Partially decomposed particle of the solid solution
this scanning. However, the shrinking core model with chemical control describes the behavior of the reaction fairly well. In order to confirm the previously described results, one partially decomposed particle was subject to a mapping of the different elements that constitute the solid KFe3(SO4)2−x(CrO4)x(OH)6 (Figure 5b).
It can be observed that Fe and O are distributed evenly throughout the particle, and K and S can be seen in greater proportion in the unreacted core. In a larger proportion compared to K and S, Cr is observed through the core and the layer of solid residues. It is worth noting that the reaction happens along a diffused front instead of a clear surface between the unreacted solid and the ash. Although Levenspiel45 mentions that this kind of behavior is a middle
point between the shrinking core model and the progressive conversion model, the experiments are better described by the shrinking core model. In addition, it is noteworthy that the presence of Ca adhered to the particle due to the formation of CaCO3 during the reaction, which complicated the creation of
active points and the diffusion of OH− ions into the particle
core. In this case, there is no proper diffusion of OH− ions into
the interface between the ash layer and the unreacted core.38,46
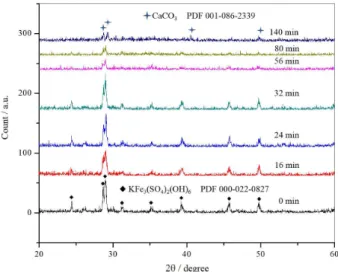
X-ray diffraction analysis shows the gradual decomposition of the synthetic solid, which becomes amorphous at a reaction time of 140 min and a concentration of Ca(OH) = 1.4 g L−1 are shown in Figure 6. The residual
solid is most probably composed of iron hydroxide with weakly adsorbed CrO42−. No formation of new phases with
compositions different from the initial solids was observed. The solids analyzed at 140 min show slight intensity
diffraction peaks corresponding to CaCO3 in 2θ = 28°.
This kind of behavior is similar to that previously studied in synthetic jarosites.29,32,35,48
Decomposition reactions are usually stoichiometric, but in this case the reaction is incongruous, as the molar fractions do not coincide with the conducted calculations. The molar fraction of K+ and SO
42− in aqueous solution is
very close to the molar fraction in solids. However, there is a slight difference in the case of Cr. The formation of an amorphous iron hydroxide with CrO42− weakly adsorbed at
the end of the reaction is proposed, since the attraction forces towards SO42− are probably weaker than those of CrO42−, thus
allowing the presence of a larger amount of Cr. Therefore, the decomposition reaction is expressed by equation 7:
[K0.86(H3O)0.14]Fe2.67[(SO4)1.23(CrO4)0.77][(OH)5.01(H2O)0.99](s)
+ 3.14OH−
(aq)→ 0.86K+(aq) + 1.23SO42−(aq) + xCrO42−(aq) +
2.67Fe(OH)3·yCrO42−(s) + 1.27H2O(l),x + y = 0.77 (7)
Dependence of the induction and progressive conversion period
Figures 7, 8 and 9 show the decomposition curves for the effects of [OH−], T and d
0, respectively, as well as the
plots of the shrinking core model with chemical control for each corresponding effect. All the reactions were monitored by potassium leaching, as kexp is identical for K, Cr or S
(Figures 3a and 3b), and thus, there is no change in the reaction rate.
Then, kexp and tind were determined in order to calculate
the order of reaction and activation energy in each case.
Figure 5. (a) Linear scanning of the particle in Figure 4b; (b) mapping of a partially decomposed particle for K, Fe, S, Cr, O and Ca. Experimental conditions: [Ca(OH)2] = 1.4 g L−1, temperature = 30 °C, particle size (d0) = 53-74 µm, 500 min−1.
If logarithms are applied to equation 7, equation 8 is obtained:
(8)
By plotting the values of the logarithm of kexp as
a function of the logarithm of CA ([OH−]), a straight
line is obtained where the slope represents the order of
reaction n (Figure 10a). For the progressive conversion period, at [OH−] ≥ 0.0206 mol L−1, the order of reaction is
n = 1.99 with respect to OH−, which indicates that at those
conditions the reaction strongly depends on concentration. For [OH−] ≤ 0.0206 mol L−1, the order of reaction is n = 0
with respect to OH−, and under these conditions there
is no dependence on [OH−] that causes a change in the
reaction mechanism. Elwood Madden et al.49 proved that
the dissolution of potassium is dependent on pH, with a minimum rate that occurs at approximately pH 3.5. It was suggested that two dissolution mechanisms can occur: at pH < 3.5 the H+ attack is the dominating mechanism, while
at pH > 3.5 the OH− attack is the controlling mechanism.
Kendall et al.43 suggested a third mechanism for the
dissolution rates of jarosites with arsenic. They propose that near the point of zero charge of the jarosite, the dissolution may be controlled by water attack. Flores et al.48 and
Reyes et al.50 found orders of reaction of n = 0 at low [OH−],
which is indicative of inexistent dependence on the reaction medium. In the present work, it is proposed that when there is no dependence on the reaction medium [OH−], the attack
towards the solid particles is done by water,43 which results
in orders of reaction equal to zero and, therefore, much slower reaction rates independent of [OH−].
The dependence of the chemical rate constant on temperature is given by equation 9 (Arrhenius equation):
(9)
where k0 is the frequency factor, Ea is the activation energy,
R is 8.3144 J mol−1 K−1 and T is temperature in Kelvin.
By substituting the chemical rate constant in the previous equation, arranging factors and applying natural logarithm, the following equation is obtained (equation 10):
(10)
When plotting ln kexp/[OH]n against 1/T, a straight line,
where m = −Ea/R, is obtained; it allows to calculate the
activation energy. Thus, for the progressive conversion period, an Ea = 51.56 kJ mol−1 was obtained (Figure 10b).
The dependence of induction time on concentration was calculated in a similar manner. By plotting [OH−] against
tind, Figure 11a is obtained, where it can be noticed that
when [OH−] decreases, the induction time increases, while
at high OH− concentrations the induction time remains
constant. A possible explanation for this is that in this reaction medium, a layer of CaCO3 is formed, thus blocking
the diffusion of OH− ions into the surface and delaying the
formation of active points for the creation of a reaction
Figure 7. (a) Decomposition curves in Ca(OH)2 medium, [OH−] effect; (b) chemical control model with formation of a layer of solid products. Conditions: temperature = 30 °C, particle size (d0) = 53-74 µm, 500 min−1.
Figure 8. (a) Decomposition curves in Ca(OH)2 medium, temperature effect; (b) chemical control model with formation of a layer of solid products. Conditions: [Ca(OH)2] = 1.4 g L−1, particle size (d0) = 53-74 µm, 500 min−1.
front. Figure 11b shows the log [OH−] against log (t ind−1) for
the dependence of [OH−] with respect to induction time. At
[OH−] ≤ 0.0248 mol L−1, there are no perceptible effects on
the induction period due to the previously stated reasons. At [OH−] ≥ 0.0248 mol L−1 there is an order of reaction
n = 0.62 with respect to OH−. All of the obtained kinetic
parameters for both periods are summarized in Table 2.
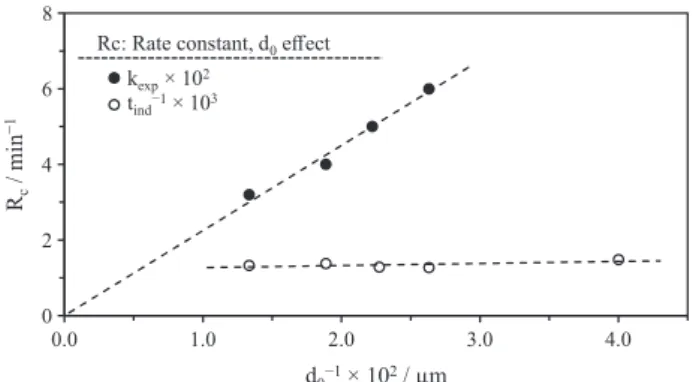
Kinetic modeling
Figure 12a shows the dependence of kexp with respect
to initial particle diameter. As it can be observed, the experimental constant is inversely proportional to particle diameter (kexpα 1 / d0) Therefore, the decomposition of the
solid solution KFe3(SO4)2−x(CrO4)x(OH)6 is described by the
shrinking core model with chemical control and the particle size has no significant effect on the induction period.
The activation energy in the induction period is determined from the slope of the straight line obtained by plotting log tind−1vs. 1/T. The activation
energy corresponding to the induction period is Ea = 63.75 kJ mol−1 (Figure 13a). It can be seen in this
stage that the induction period decreases as temperature is increased (Figure 13b). The activation energy values are consistent with those determined for a chemical control: 40 kJ mol−1.47 The increase of the activation energy in the
induction period is related to the fact that in the initial stage of the reaction a larger amount of energy is needed due to the difficulty of OH− ions to get through the CaCO
3
layer and subsequently form the active centers where the reaction is started; once they are formed, the reaction occurs faster.
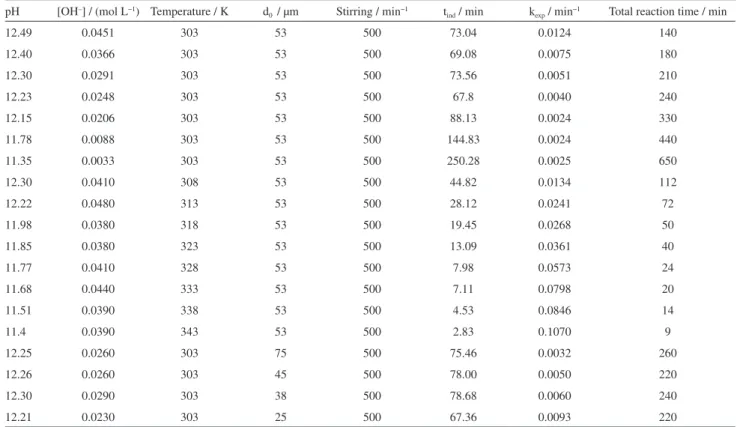
Table 3 shows the processing conditions as well as the experimental data obtained from dissolution experiments.
Concentration of OH− was determined by taking into
account the pH in each experiment, as well as the ionization constant of water for each working temperature.39,47,51 A
Figure. 10. (a) Plot to determine the orders of reaction by equation 8;
(b) activation energy determined by equation 10.
Figure 11. (a) Plot of induction time (tind) vs. OH− concentration; (b) dependence of tind with respect to OH− concentration to calculate the order of reaction.
Table 2. Kinetic parameters calculated in the dissolution experiments of KFe3[(SO4)2−x(CrO4)x](OH)6 in medium Ca(OH)2 for induction and conversion periods
Kinetic parameter Induction period Progressive conversion period
Ea / (J mol−1) 63750 51560
n 0.62 1.99
Vm k0 r0−1 3.27 × 10⁹ 8.915 × 10⁹ Ea: Activation energy; k0: frequency factor; r0: initial particle radius.
Figure. 12. Plot of the dependence of experimental rate constant (kexp) and induction time (tind−1) with respect to particle size (d0).
general kinetic model is presented in equation 11, which is obtained by substituting and arranging equations 6, 7 and 9, and by using the kinetic parameters shown in Table 3:
(11)
The kinetic expression in the induction period is shown in equation 12:
(12)
For the progressive conversion period, the resulting kinetic expression is shown in equation 13:
(13)
The plot of the logarithm of the reaction rates constants (Rc) against the logarithm of the of the experimental values
was obtained from equations 12 and 13 for every kinetic stage (kexp, tind−1; Figure 14a). It can be noticed in this
figure that the values of the equations for the induction and progressive conversion period are satisfactorily consistent with the experimental values. In addition, it is possible to obtain a new expression to determine the
necessary time for any conversion of the solid solution KFe3(SO4)2−x(CrO4)x(OH)6 in Ca(OH)2 medium, which is
described in equation 14:
(14)
Figure 14b shows the necessary reaction time to obtain a conversion of X = 0.75 by taking into account the data obtained for each of the experiments. The experimental values are consistent with the obtained model for any conversion at any given time.
It is observed that for the progressive conversion period in Ca(OH)2 medium, the reaction depends more on [OH−] than on
the other variables. This behavior is related to the adsorption difficulty of OH− ions in the KFe
3(SO4)2−x(CrO4)x(OH)6
particles. In this case, there is no proper diffusion of OH− ions into the interface between the ash layer and the
unreacted core. This happens because CaCO3 blocks the
particles’ pores. It can be confirmed through the order of reaction obtained for the progressive conversion period (n = 1.99), which is higher than that obtained in the induction period (n = 0.69). There is a strong relation
Table 3. Conditions and experimental results of the dissolution of KFe3[(SO4)2−x(CrO4)x](OH)6 in Ca(OH)2 medium.
pH [OH–] / (mol L−1) Temperature / K d
0 / µm Stirring / min−1 tind / min kexp / min−1 Total reaction time / min
12.49 0.0451 303 53 500 73.04 0.0124 140
12.40 0.0366 303 53 500 69.08 0.0075 180
12.30 0.0291 303 53 500 73.56 0.0051 210
12.23 0.0248 303 53 500 67.8 0.0040 240
12.15 0.0206 303 53 500 88.13 0.0024 330
11.78 0.0088 303 53 500 144.83 0.0024 440
11.35 0.0033 303 53 500 250.28 0.0025 650
12.30 0.0410 308 53 500 44.82 0.0134 112
12.22 0.0480 313 53 500 28.12 0.0241 72
11.98 0.0380 318 53 500 19.45 0.0268 50
11.85 0.0380 323 53 500 13.09 0.0361 40
11.77 0.0410 328 53 500 7.98 0.0573 24
11.68 0.0440 333 53 500 7.11 0.0798 20
11.51 0.0390 338 53 500 4.53 0.0846 14
11.4 0.0390 343 53 500 2.83 0.1070 9
12.25 0.0260 303 75 500 75.46 0.0032 260
12.26 0.0260 303 45 500 78.00 0.0050 220
12.30 0.0290 303 38 500 78.68 0.0060 240
between the temperature of reaction and [OH−], given
by the ionization constant of water, which indicates that at high temperatures, pH decreases and consequently OH− concentration also decreases. For this reason, the
[OH−] vs. temperature interaction has a strong influence on
the decomposition process. The behavior of the reaction and experimental data are satisfactorily consistent with the established kinetic models, which involves the induction and progressive conversion periods, as well as the total time of reaction for all the experiments. These models are capable of predicting the behavior of this kind of compound under the studied conditions. However, they will only apply for the used reaction medium. Previous works on the decomposition of jarosites in Ca(OH)2 medium have
had similar results.39,46,47,50
Conclusions
The synthesis of potassium jarosite with chromium(VI) leads to the formation of a solid solution with the following formula: [K0.86(H3O)0.14]Fe2.67(SO4)1.23(CrO4)0.77[(OH)5.01
(H2O)0.99]. The decomposition of the solid solution
KFe3(SO4)2−x(CrO4)x(OH)6 in Ca(OH)2 medium is consistent
with the shrinking core model with chemical control and characterized by two main stages: an induction period and a progressive conversion period.
The induction period decreases when both the OH−
concentration and temperature increase, and particle size does not have an important influence. The dependence on temperature is very significant, and tind tends to zero with
increments in temperature, while the maximum dependence on [OH−] is reached at [OH−] = 0.0248 mol L−1, with an
order of reaction of n = 0.62 with respect to OH− and an
Ea = 63.75 kJ mol−1.
The progressive conversion period is characterized by the formation of a reaction front around an unreacted
core; and there is a diffusion of ions of site A (K+),
site Z [sulfur(VI) and chromium(VI)], from the crystal lattice, through the layer of solid residues (made of iron hydroxides with weakly adsorbed chromate) towards the solution. In this stage at [OH−] ≥ 0.0206 mol L−1, the
order of reaction is n = 1.99 with respect to OH−; and for
[OH−] ≤ 0.0206 mol L−1, the order of reaction is n = 0
with respect to OH−; the activation energy in this stage is
Ea = 51.56 kJ mol−1.
The decomposition rate is faster for smaller initial particle size, according to the relationship kexpα 1/d0.
At room temperature conditions (303 K) and low OH− concentrations, chromium(VI) is retained in the
porous surface of the residue, which makes it convenient for avoiding the transport of chromium(VI) into natural effluents. Since the amount of released chromate during the reaction is less compared to that of sulfate, it can be concluded that potassium jarosite is ideal for retaining amounts of chromium contained in effluents without being released into the environment, even if it reacts in environments of extreme alkalinity.
Since it is difficult to find environments of extreme alkalinity (such as the working conditions presented in this piece of work) in nature, it is possible to use jarosite as a material to reservoir chromium(VI), as long as extended exposition times and high temperatures are avoided, as conditions that appear after a lime treatment process.
Acknowledgments
The authors of the present investigation would like to thank the Autonomous University of the State of Hidalgo, the National Polytechnic Institute, the Institute of Metallurgical Research of the Michoacan University of Saint Nicholas of Hidalgo (Michoacán, MC, Mexico) and the Institute of Metallurgy of the Autonomous University of San Luis Potosi (UASLP). All the facilities at the Mineral Processing Laboratory at the Institute of Metallurgy of UASLP, as well as the valuable time and contributions of José Manuel Martínez, are also recognized.
References
1. Hemalatha, P.; Prasada Rao, P. V. V.; Int. J. Environ. Sci.2012, 2, 2321.
2. Lee, T.; Lim, H.; Lee, Y.; Park, J. W.; Chemosphere2003, 53,
479.
3. Guan, X.; Dong, H.; Ma, J.; Lo, I. M. C.; Dou, X.; Sep. Purif. Technol.2011, 80, 179.
4. Guertin, J.; Jacobs, J. A.; Avakian, C. P.; Chromium(VI) Handbook, 1st ed.; CRC Press: USA, 2005.
5. Baron, D.; Palmer, C. D.; Geochim. Cosmochim. Acta2002,
66, 2841.
6. Anandkumar, J.; Mandal, B.; J. Hazard Mater.2011, 186, 1088. 7. Park, D.; Ahn, C. K.; Kim, Y. M.; Yun, Y. S.; Park, J. M.; J.
Hazard. Mater.2008, 160, 422.
8. Park, D.; Yun, Y. S.; Lee, H. W.; Park, J. M.; Bioresour. Technol. 2008, 99, 1141.
9. Somasundaram, V.; Philip, L.; Bhallamudi, S. M.; J. Hazard. Mater.2009, 172, 606.
10. Martins, M.; Faleiro, M. L.; Chaves, S.; Tenreiro, R.; Santos, E.; Costa, M. C.; J. Hazard. Mater.2010, 176, 1065.
11. Rajeshwari, K.; Kumar, M. S.; Thajuddin, N.; Ann. Microbiol. (Heidelberg, Ger.) 2012, 62, 241.
12. Castro, L.; García-Balboa, C.; González, F.; Ballester, A.; Blázquez, M. L.; Muñoz, J. A.; Hydrometallurgy2013, 131-132, 29.
13. Wang, S. L.; Chen, C. C.; Tzou, Y. M.; Hsu, C. L.; Chen, J. H.; Lin, C. F.; J. Hazard. Mater. 2009, 164, 223.
14. Fiol, N.; Escudero, C.; Villaescusa, I.; Bioresour. Technol.2008,
99, 5030.
15. Hunsom, M.; Pruksathorn, K.; Damronglerd, S.; Vergnes, H.; Duverneuil, P.; Water Res.2005,39, 610.
16. Asta, M. P.; Cama, J.; Martínez, M.; Giménez, J.; J. Hazard. Mater. 2009, 171, 965.
17. Welch, S. A.; Christy, A. G.; Kirste, D.; Beavis, S. G.; Beavis, F.;
Chem. Geol.2007, 245, 183.
18. Jambor, J. L.; Can. Mineral.1999, 37, 1323.
19. Dutrizac, J. E.; Metall. Mater. Trans. B2008, 39B, 771.
20. Dutrizac, J. E.; Chen, T. T.; Hydrometallurgy2009, 98, 128. 21. Basciano, L. C.; Peterson,R. C.; Am. Mineral.2007, 92, 1464.
22. Baron, D.; Palmer, C. D.; Geochim. Cosmochim. Acta1996,
60, 3815.
23. Paktunc, D.; Dutrizac, J. E.; Can. Mineral.2003, 41, 905. 24. Savage, K. S.; Bird, D. K.; O’Day, P. A.; Chem. Geol.2005,
215, 473.
25. Dutrizac, J. E.; Chen, T. T.; Hydrometallurgy2010, 102, 55.
26. Dutrizac, J. E.; Kaiman, S.; Hydrometallurgy1975, 1, 51. 27. Forray, F. L.; Smith, A. M. L.; Drouet, C.; Navrotsky, A.;
Wright, K.; Hudson-Edwards, K. A.; Dubbin, W. E.; Geochim. Cosmochim. Acta2010,74, 215.
28. Johnson, D. B.; Hallberg, K. B.; Sci. Total Environ.2005, 338, 3.
29. Liu, F.; Zhou, J.; Zhou, L.; Zhang, S.; Liu, L.; Wang, M.;
J. Hazard. Mater.2015, 299, 404.
30. Zahrai, S. K.; Elwood Maden, M. E.; Maden, A. S.; Rimstidt, J. D.; Icarus2013,223, 438.
31. Patiño, F.; Viñals, J.; Roca, A.; Nuñez, C.; Hydrometallurgy 1994, 34, 279.
32. Patiño, F.; Salinas, E.; Cruells, M.; Roca, A.; Hydrometallurgy 1998, 49, 323.
33. Patiño, F.; Cruells, M.; Roca, A.; Salinas, E.; Perez, M.;
Hydrometallurgy 2003, 70, 153.
34. Cruells, M.; Roca, A.; Patiño, F.; Salinas, E.; Rivera, I.;
Hydrometallurgy 2000, 55,153.
35. Roca, A.; Patiño, F.; Viñals, J.; Nuñez, C.; Hydrometallurgy 1993, 33, 341.
36. Roca, A.; Cruells, M.; Patiño, F.; Rivera, I.; Plata, M.;
Hydrometallurgy2006, 81, 15.
37. ASTM Committee E-29; Manual on Test Sieving Methods; American Society for Testing and Materials: Philadelphia, 1985. 38. Maloney, J. O.; Perry’s Chemical Engineers’Handbook, 8th ed.;
McGraw-Hill: New York, 2008.
39. Patiño, F.; Reyes, I. A.; Flores, M. U.; Pandiyan, T.; Roca, A.; Reyes, M.; Hernández, J.; Hydrometallurgy2013, 137, 115.
40. Dutrizac, J. E.; Kayman, S.; Can. Mineral. 1976, 14, 151. 41. Dutrizac, J. E.; Metall. Mater. Trans. B1983, 14, 531.
42. Dutrizac, J. E.; Jambor, J. L.; Chen, T. T.; Can. Met.1987, 26, 103.
43. Kendall, M. R.; Madden, A. S.; Elwood Madden, M. E.; Hu, Q.;
Geochim. Cosmochim. Acta2013, 112, 192.
44. The Plessey Company Limited; International Centre for Diffraction Data; Jarosite, syn pattern: PDF 00-022-0827. 45. Levenspiel, O.; Ingeniería de las Reacciones Químicas, 3a ed.;
Reverté: Barcelona, 2010.
46. Patiño, F.; Flores, M. U.; Reyes, I. A.; Reyes, M.; Hernández, J.; Rivera, I.; Juárez, J. C.; Geochem. T.2013, 14:2, 1.
47. Ballester, A.; Verdeja, L. F.; Sancho, J.; Metalurgia Extractiva Fundamentos (Vol. 1), 1ª ed.; Síntesis: Madrid, 2000. 48. Flores, M. U.; Patiño, F.; Reyes, I. A.; Rivera, I.; Reyes, M.;
Juárez, J. C.; J. Braz. Chem. Soc.2012, 6, 1018.
49. Elwood Madden, M. E.; Madden, A. S.; Rimstidt, J. D.; Zaharai, S.; Kendall, M. R.; Miller, M. A.; Geochim. Cosmochim. Acta2012, 91, 306.
50. Reyes, I. A.; Patiño, F.; Rivera, I.; Flores, M. U.; Reyes, M.; Hernández, J.; J. Braz. Chem. Soc.2011, 12, 1260 .
51. Lide, D. R.; Handbook of Chemistry and Physics, 94th ed.; CRC
Press: Boston, 2009.

![Figure 7. (a) Decomposition curves in Ca(OH) 2 medium, [OH − ] effect;](https://thumb-eu.123doks.com/thumbv2/123dok_br/19000022.463439/8.892.94.437.115.305/figure-decomposition-curves-ca-oh-medium-oh-effect.webp)