0103 - 5053 $6.00+0.00
Article
* e-mail: [email protected]
Evaluation of Organic Load Measurement Techniques in a Sewage and
Waste Stabilisation Pond
Pedro Sérgio Fadinia, Wilson F. Jardimb and José Roberto Guimarães*,c
a
Faculdade de Química, PUC-Campinas, CP 317, 13012-970 Campinas - SP, Brazil
b
Instituto de Química, Universidade Estadual de Campinas, CP 6154, 13083-971 Campinas - SP, Brazil
c
Faculdade de Engenharia Civil, Universidade Estadual de Campinas, CP 6021, 13083-970 Campinas - SP, Brazil
A Demanda Bioquímica de Oxigênio (DBO) e a Demanda Química de Oxigênio (DQO) são os principais indicadores rotineiramente utilizados para avaliação de carga orgânica em matrizes de interesse ambiental. Nesse contexto, avaliações da possibilidade de substituição das testes de DBO e DQO por medidas de Carbono Orgânico Dissolvido (COD) são apresentadas para diferentes águas residuárias. Para efluente de lagoa anaeróbia, as seguintes correlações foram obtidas: DQO = 1,08 COD + 79 e DBO = 0,82 COD + 12. Para efluente de lagoa facultativa, DQO = -0,29COD + 109 e DBO = 0,14COD + 26. Para esgoto bruto, DQO = 4,18COD – 2 e DBO = 0,46DQO + 5. Para efluente de lagoa aerada, DQO = 3,57COD + 6 e DBO = 0,27DQO + 3. Para efluente de lagoa de decantação, DQO = -1,34COD + 138 e DBO = 0,73COD + 16,5. A determinação de COD não mostrou-se adequada para uma substituição das alternativas clássicas, para as amostras testadas, a despeito das limitações que estas últimas apresentam.
Biochemical Oxygen Demand (BOD) and Chemical Oxygen Demand (COD) are the major parameters used as routine surrogate tests for measuring the load of organic carbon into the environment. In this context, an evaluation of possible replacement of BOD and COD for Dissolved Organic Carbon (DOC) measurements are presented for different wastewaters. For anaerobic pond effluent, the following correlations were obtained: COD = 1.08 DOC + 79 and BOD = 0.82 DOC + 12. For facultative pond effluent, COD = -0.29DOC + 109 and BOD = 0.14DOC + 26. For raw sewage COD = 4.18DOC – 2 and BOD = 0.46COD + 5. For aerated pond effluent COD = 3.57DOC + 6 and BOD = 0.27COD + 3. For sedimentation pond effluent, COD = -1.34DOC + 138 and BOD = 0.73DOC + 16.5. Determination of COD was not appropriate for substituting classical alternatives in tested samples in despite of the limitations of the samples.
Keywords: BOD, COD, DOC, organic carbon, pollution
Introduction
Measuring organic and inorganic carbon in surface and ground waters is of great interest to assess quality of life in many ecosystems. In pollution abatement works, organic carbon measurement provides a quick and simple method for monitoring pollution levels as well as the accumulation of non biodegradable or refractory organic materials. Under the ecological point of view, organic and inorganic carbon measurements give quantitative information about the carbon cycle and productivity of natural bodies of water. In environmental engineering, measurement of organic carbon provides a non-specific measure for monitoring potentially toxic organic materials in natural waters.1
Efficiency of waste water treatment plants and kinetics characteristics of biological process are usually studied through BOD and COD, although difficulties are encountered in their measurement.2
As pointed out by Dart,3 and Logan and Wangenseller,4
some problems inherent to the use of BOD are, high variability of results; inconsistent results when in the presence of toxic species; possible need for foreign micro-organisms as seed; labour-intensive and time-consuming test; laboratory conditions set in a way that may not reflect real environment; five days period necessary to produce a result may be non-representative due to operational problems that occurred during this period.
Other disadvantage of this test is that the kinetics of biological degradation under natural conditions cannot be inferred.5
Despite the historical use of both BOD and COD procedures to “measure” organic carbon and recent uses of UV absorbance,6 absorbance and fluorescence7 or
biosensors,8 the results always are expressed in terms of
mg O2/L, thus inferring (and not measuring) the amount of organic material present in the sample. In this scenario, the determination of total organic carbon (TOC) would be a more rational approach to this particular problem, and seriously considered as a potential replacement for BOD and COD analysis. This new trend in routine as well as research laboratories has been strengthened in recent years due the dissemination of methods using catalytic oxidation at high temperature (650 – 900 oC), or UV photo-oxidation
at low temperature, both techniques with non-dispersive infrared detectors for the final CO2 measurement.9 It is
important to mention here that due to operational problems, most TOC data are obtained using filtered samples. In this case, they account for the total dissolved organic carbon, and should correctly be quoted as DOC (Dissolved Organic Carbon).
As pointed out by Roscoe,10 TOC automation has been
considered seriously in many agencies devoted to environmental monitoring and protection. For instance, by the NRA, stating “our recommendation (for on-line installation) is TOC. For many categories of effluent there are consistent relationships between BOD and TOC which would permit conversion of BOD to equivalent TOC values”, by the Chief Inspectors Guidance (section 5), HMIP: “There is often a reliable though non-linear relationship between (the standard) BOD and TOC”, by The Urban Waste Water Treatment (England and Wales): “The parameters (BOD or COD) can be replaced by another parameter: TOC or TOD if a relationship can be established between BOD 5 and the substitute parameter”.
Also, in respect to the replacement of BOD, Jones,11
and Aziz and Tebbutt,2 agree with the need of a consistent
correlation between the alternative and the classical methods. Viraraghavan12 recommends caution in the use
of TOC, since he has not obtained significant correlation between BOD, COD and soluble organic carbon in raw sewage, septic tank effluent and polluted ground water samples.
In this paper, correlation between COD, BOD and TOC obtained in samples from waste stabilization ponds are presented and discussed. The use of TOC in routine laboratory work as the key data on the concentration of organic carbon in waste waters is evaluated under the analytical point of view.
Another important aspect related to the routine analysis of DOC and TOC was a tremendous development in this commercial area, and the cost of both equipment and analysis decreased markedly. This development was centred not only in the way carbon is oxidized to CO2 (now carried out by catalytic combustion or wet oxidation using persulphate), but mainly due to the CO2 detection using non-dispersive infrared detector.13
Fadini14 developed an alternative and low-cost
procedure to determine DOC in natural aqueous samples by coupling Flow Injection Analysis (FIA) with a conductimetric detector. The method is based upon an early work of Pasquini and Faria,15 later modified by Jardim et
al.16 The method explores the use of on-line digestion
using UV and persulphate. The CO2 produced in then measured after membrane diffusion by conductimetry. The equipment is able to process 14 samples/h in the determination of DOC and 25 samples/h when determining inorganic carbon. Compared to the vast majority of last generation HTCO (high temperature catalytic oxidation) commercially available equipments, the cost of this “home made” apparatus is 8 times lower (around US $ 4,000.00), showing an operational cost in the range of US $ 7.00 per 1,000 samples analyzed.
Experimental
Samples were collected in a sewage treatment plants at Limeira city and Indaiatuba city, both in São Paulo state, Brazil. The first plant, at Limeira city, consists of one anaero-bic followed by two facultative ponds. The second plant, located in Indaiatuba city have an aerated pond followed by a sedimentation pond. Values of dissolved BOD, COD and DOC in the anaerobic and in the second facultative pond effluents were determined after filtration through baked (500 ºC) Whatman GF/C glass-fiber filter. COD tests were performed as recommended in a open reflux method, and BOD by the 5-day test with azide modification using the Winkler method for DO measurement.17 DOC measurements
were made in a Shimadzu carbon analyzer, model TOC 5000. The values were obtained from six replicates for BOD, three for COD and two or three injections for DOC (third injec-tion was made if the coefficient of variainjec-tion was above 2%). Collection and analysis were performed in the same day without preservation. Samples were collected in a polyethy-lene flasks and transported in a thermal box with ice.
Results and Discussion
the facultative pond, raw sewage, aerated and sedimen-tation pond, respectively.
Mathematical relations involving values of COD, BOD, and DOC obtained for these samples are shown in Table 2.
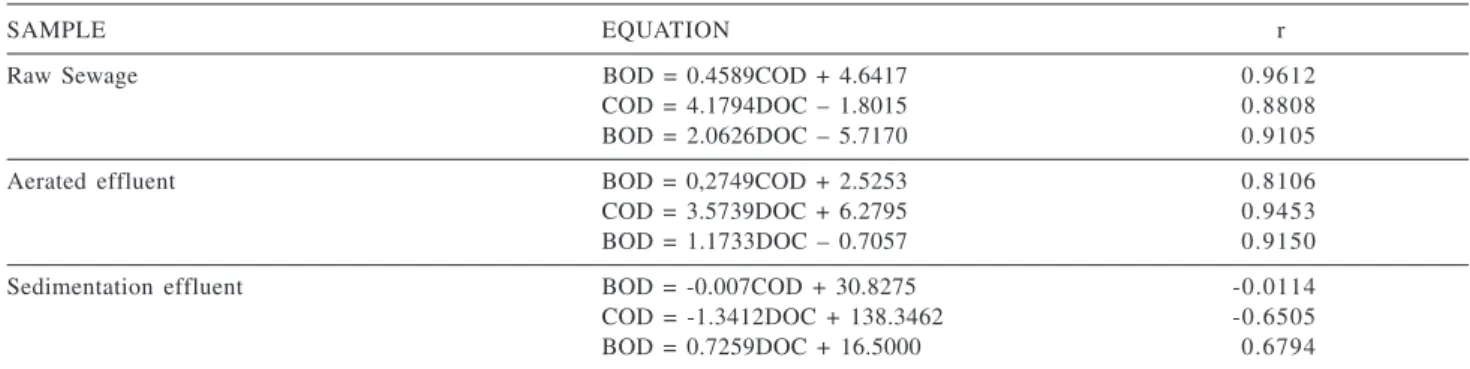
Best significative levels for correlation, between dissolved organic carbon (DOC) and BOD as well as COD were observed for the raw sewage. The worst significative levels was obtained among these parameters for the facultative and sedimentation effluents. Mathematical
Table 1. COD, BOD, and DOC values obtained for different effluents
Source of sample BOD (mgO2/L) COD (mgO2/L) DOC (mgC/L)
Anaerobic pond effluent
Mean ± s 57.8 ± 22.2 138.1 ± 25.9 55.1 ± 22.0
Range 14 – 79 97 – 172 20 – 98
Number of samples 1 0 1 0 1 0
Facultative pond effluent
Mean ± s 31.1 ± 17.2 98.6 ± 13.4 37.4 ± 11.2
Range 16 – 64 77 – 119 18 – 56
Number of samples 1 0 1 0 1 0
Raw sewage effluent
Mean ± s 130.0 ± 43.3 273.2 ± 90.7 65.8 ± 19.1
Range 91 – 191 191 – 419 38 – 88
Number of samples 5 5 5
Aerated pond effluent
Mean ± s 29.8 ± 12.0 99.2 ± 35.5 26.0 ± 9.4
Range 17 – 45 45 – 138 13 – 39
Number of samples 5 5 5
Sedimentation pond effluent
Mean ± s 30.0 ± 6.80 113.4 ± 13.1 18.6 ± 6.3
Range 21 – 37 99 – 131 12 – 29
Number of samples 5 5 5
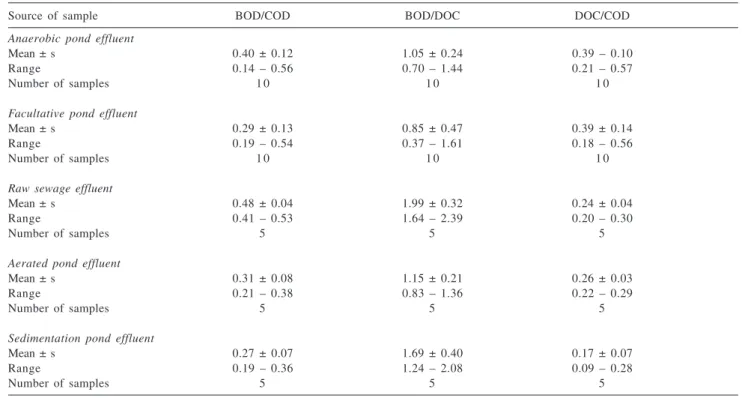
Table 2. Ratio involving BOD, COD, and DOC values obtained for different effluents
Source of sample BOD/COD BOD/DOC DOC/COD
Anaerobic pond effluent
Mean ± s 0.40 ± 0.12 1.05 ± 0.24 0.39 – 0.10
Range 0.14 – 0.56 0.70 – 1.44 0.21 – 0.57
Number of samples 1 0 1 0 1 0
Facultative pond effluent
Mean ± s 0.29 ± 0.13 0.85 ± 0.47 0.39 ± 0.14
Range 0.19 – 0.54 0.37 – 1.61 0.18 – 0.56
Number of samples 1 0 1 0 1 0
Raw sewage effluent
Mean ± s 0.48 ± 0.04 1.99 ± 0.32 0.24 ± 0.04
Range 0.41 – 0.53 1.64 – 2.39 0.20 – 0.30
Number of samples 5 5 5
Aerated pond effluent
Mean ± s 0.31 ± 0.08 1.15 ± 0.21 0.26 ± 0.03
Range 0.21 – 0.38 0.83 – 1.36 0.22 – 0.29
Number of samples 5 5 5
Sedimentation pond effluent
Mean ± s 0.27 ± 0.07 1.69 ± 0.40 0.17 ± 0.07
Range 0.19 – 0.36 1.24 – 2.08 0.09 – 0.28
Table 5. Relation between BOD, COD and DOC from data obtained by Viraraghavan12
SAMPLE EQUATION r
Raw sewage BOD = 0.031DOC + 554 0.016
COD = 1.17DOC + 879 0.344
Septic tank effluent BOD = 1.27DOC + 187 0.395
COD = 3.56DOC + 368 0.341
Polluted ground-water BOD = 1.20DOC + 48 0.340
COD = 3.32DOC + 47 0.559
Table 4. Mathematical relations obtained for COD, BOD, and DOC in the raw sewage, aerated effluent and sedimentation effluent
SAMPLE EQUATION r
Raw Sewage BOD = 0.4589COD + 4.6417 0.9612
COD = 4.1794DOC – 1.8015 0.8808
BOD = 2.0626DOC – 5.7170 0.9105
Aerated effluent BOD = 0,2749COD + 2.5253 0.8106
COD = 3.5739DOC + 6.2795 0.9453
BOD = 1.1733DOC – 0.7057 0.9150
Sedimentation effluent BOD = -0.007COD + 30.8275 -0.0114
COD = -1.3412DOC + 138.3462 -0.6505
BOD = 0.7259DOC + 16.5000 0.6794
Table 3. Mathematical relations obtained for COD, BOD, and DOC in both anaerobic and facultative effluents
SAMPLE EQUATION r
Anaerobic effluent BOD = 0.7394COD – 44.3091 0.8609
COD = 1.0793DOC + 78.6295 0.9156
BOD = 0.8191DOC + 12.6696 0.8090
Facultative effluent BOD = 0.8753COD – 55.2086 0.6824
COD = -0.2890DOC + 109.4080 -0.2426
BOD = 0.1378DOC + 25.9461 0.0902
equations obtained from the plots of each paired parameter and their respective correlation are presented ins Tables 3 and 4.
Aziz and Tebbutt,2 working with activated sludge,
obtained a relation for BOD/DOC in filtered samples that ranged from 1.263 down to 0.488, when the aeration time increased from 1.8 up to 15.5 h. This behaviour is expected since recalcitrant carbon will remain in solution as aeration proceeds. Note that the results obtained in our work for the anaerobic (1.04) and the facultative (0.85) also show the same trend and are within the range obtained by the above mentioned authors.
Viraraghavan,12 also studied the correlation among
BOD, COD, and DOC in 3 different types of water samples. The results, showing a very poor correlation, are presented in Table 5.
Mathematical equations relating these 3 parameters were also investigated by other authors. Maier and
McConnel1 present the following relations: COD =
3.504TOC - 20.3 and BOD = 1.87TOC - 11.6 for typical wastewater samples. Values obtained in a paper plant effluent showed a correlation with between BOD and TOC expressed as TOC = 1.045BOD + 112.7.
Conclusion
It is clear from the preliminary results presented in this paper as well all the information so far published that there isn’t an expected theoretical correlation between COD and DOC or BOD and DOC. However, it is also clear that, as long as some key physico-chemical and biological characteristics of a given effluent remains fairly constant over time, then values of DOC can be used instead of BOD and/or COD. Nevertheless, before this replacement occurs, a solid data bank on these 3 values would be necessary.
consumption. The oxygen is measured by the BOD test and the dichromate ions are measured by the COD test.
The organic matter is oxidized in the DOC determination and the CO2 formed is quantified, which allows an effective measure of the organic matter level.
There is a negative correlation between COD and DOC as shown in Tables 3 and 4.
In both cases the effluent had contact with anaerobic sites where a removal of organic matter could occur through the generation of CH4 and CO2, as well as the reduction of different chemical species that act as electron receptors in the anaerobic respiration process, such as Fe(III), Mn(IV), NO3- and SO
4
2-, that are respectively reduced to Fe(II),
Mn(II), N2 or NH3 and S2-.
An effluent with anaerobic characteristics can be poor in organic matter and enriched with reduced inorganic species that can be oxidized by the dissolved oxygen through the BOD process and by the dichromate ions through the COD process. This explains any eventual negative relationships, which commonly occur between DOC and COD, since the oxidant used in the COD process is very strong.
Acknowledgements
The authors are grateful to FAPESP and FEC-UNICAMP for the support during the progress of this work
References
1. Maier, J. M.; McConnel, H. L.; J. Water Pollut. Cont. Fedn.
1974, 46, 623.
2. Aziz, J. A.; Tebbutt, T. H. Y.; Water Res. 1980, 14, 319. 3. Dart, M. C.; Water Pollut. Control. 1977, 76, 192.
4. Logan, B. E.; Wangenseller, G. A.; Water Environ. Res.1993,
65, 862.
5. Sawyer, C. N.; McCarty, P. L.; Parkin, G. F.; Chemistry for Environmental Engineering, 4th ed., McGraw-Hill: New York, 1994.
6. Muzio, F.M.; Budman, H. M.; Robinson, C. W.; Graff, S.;
Water Res.2001, 35, 1842.
7. Comber, S. D. W.; Gardner, M. J.; Gunn, A. M.; Environ. Technol. 1996, 17, 771.
8. Liu, J.; Björnsson, L.; Mattiasson, B.; Biosens. Bioelectron.
2000, 14, 883.
9. Thomas, O.; El Khorassani, H.; Touraud, E.; Bitar, H.; Talanta
1999, 50, 743.
10. Roscoe, G.; Water Waste Treat. 1994, 37,18. 11. Jones, R. H.; Water Wastes Eng.1972, 9, 32.
12. Viraraghavan, T.; J. Water Pollut. Cont. Fedn.1976, 46, 2213. 13. Bennet, P.A.; Beadles, S.; Am. Lab.1994, 26, 29.
14. Fadini, P. S.; MSc. Dissertion, Universidade Estadual de Campinas, Brasil, 1995.
15. Pasquini, C.; Faria, L.C.; Anal. Chim. Acta1987, 193, 19. 16. Jardim, W. F.; Pasquini, C.; Guimarães, J. R.; Faria, L. C.;
Water Res. 1990, 24, 351.
17. APHA, AWWA and WPCF; Standard Methods for the
Exami-nation of Water and Wastewater, 18th ed., American Public
Health Association: Washington, D.C., 1992.
Received: August 20, 2002
Published on the web: February 6, 2004