A vibrational spectroscopic study of philipsbornite PbAl
3
(AsO
4
)
2
(OH)
5
H
2
O-molecular structural implications and relationship to the crandallite
subgroup arsenates
Ray L. Frost
a,⇑, Yunfei Xi
a, Ross E. Pogson
a,b, Ricardo Scholz
a,c aChemistry Discipline, Faculty of Science and Technology, Queensland University of Technology, GPO Box 2434, Brisbane Queensland 4001, Australia b
Geosciences (Mineralogy & Petrology), The Australian Museum, 6 College St., Sydney NSW 2010, Australia c
Geology Department, School of Mines, Federal University of Ouro Preto, Campus Morro do Cruzeiro, Ouro Preto, MG 35,400-00, Brazil
h i g h l i g h t s
"The presence of arsenic in the
environment is a hazard.
"The accumulation of arsenate in the
formation of minerals provides a mechanism for the remediation of arsenate contamination.
"The formation of the crandallite
group provides a mechanism for arsenate accumulation.
"Raman spectroscopy complimented
with infrared spectroscopy has enabled philipsbornite to be studied.
g r a p h i c a l
a b s t r a c t
a r t i c l e
i n f o
Article history: Received 1 August 2012 Accepted 31 October 2012 Available online 22 November 2012
Keywords: Philipsbornite Arsenate
Arsenic remediation Crandallite Molecular structure
a b s t r a c t
The presence of arsenic in the environment is a hazard. The accumulation of arsenate by a range of cat-ions in the formation of minerals provides a mechanism for the remediation of arsenate contamination. The formation of the crandallite group of minerals provides a mechanism for arsenate accumulation. Among the crandallite minerals are philipsbornite, arsenocrandallite and arsenogoyazite. Raman spec-troscopy complimented with infrared specspec-troscopy has enabled aspects of the structure of philipsbornite to be studied.
The Raman spectrum of philipsbornite displays an intense band at around 840 cm1attributed to the
overlap of the symmetric and antisymmetric stretching modes. Raman bands observed at 325, 336, 347, 357, 376 and 399 cm1are assigned to them
2(AsO4)3symmetric bending vibration (E) and to them4
bending vibration (F2). The observation of multiple bending modes supports the concept of a reduction
in symmetry of the arsenate anion in philipsbornite. Evidence for phosphate in the mineral is provided. By using an empirical formula, hydrogen bond distances for the OH units in philipsbornite of 2.8648 Å, 2.7864 Å, 2.6896 Å cm1and 2.6220 were calculated.
Ó2012 Elsevier B.V. All rights reserved.
Introduction
The mineral philipsbornite PbAl3(AsO4)2(OH)5H2O[1]is a mem-ber of the crandallite subgroup[2,3]of the alunite supergroup. It is the lead analogue of arsenocrandallite (Ca,Sr)Al3(AsO4,PO4)2(OH)5
H2O and arsenogoyazite (Sr,Ca,Ba)Al3(AsO4,PO4)2(OH,F)5H2O, and the arsenate analogue of plumbogummite PbAl3(PO4)2(OH)5H2O. Philipsbornite forms a continuous series of solid solutions with these minerals [4]. The philipsbornite–segnetite series is well known. Philipsbornite is known from a number of locations world-wide[1,5–8]. In Australia, philipsbornite can be sourced from the Kintore open cut mine, New South Wales, Anticline Deposit, Ashburton Downs Station, Western Australia and of course from
1386-1425/$ - see front matterÓ2012 Elsevier B.V. All rights reserved. http://dx.doi.org/10.1016/j.saa.2012.10.076
⇑ Corresponding author. Tel.: +61 7 3138 2407; fax: +61 7 3138 1804. E-mail address:[email protected](R.L. Frost).
Contents lists available atSciVerse ScienceDirect
Spectrochimica Acta Part A: Molecular and
Biomolecular Spectroscopy
Red Lead Mine, Tasmania, Australia[9]. Arsenate and phosphate minerals including philipsbornite are found in Australian soils [10]. The mineral is hexagonal with point group: 3 2/m. The cell data is Space Group: R3m, a= 7.11–7.17,c= 17.05–17.18, andZ= 3. Phil-ipsbornite is a rare secondary mineral in the oxidised zone of hydro-thermal polymetallic mineral deposits and is associated with crocoite, hidalgoite, gorceixite. The stability of many lead arsenate minerals have been reviewed[11].
The reason for this research is that minerals such as philipsbor-nite are found in soils and in old mine sites. Therefore, this research focuses on the spectroscopic determination of philipsbornite and consequential molecular structure. Raman spectroscopy has pro-ven very useful for the study of minerals[12–19]. Indeed, Raman spectroscopy has proven most useful for the study of diagenetically related minerals as often occurs with minerals containing arsenate and sulphate groups, including philipsbornite and crandallite. Raman spectroscopy is especially useful when the minerals are X-ray non-diffracting or poorly diffracting and very useful for the study of amorphous and colloidal minerals[20–29]. Philpsbornite is a mineral which falls into this category.
Due to the somewhat amorphous nature of philipsbornite, the application of vibrational spectroscopy is very important. Only through vibrational spectroscopy can any concepts of the molecular structure of the mineral philipsbornite be determined. The minerals act as a sink for both phosphate and arsenate waste mine dumps. Further the minerals have been found in old or ancient burial sites. Some vibrational spectroscopic studies of the related arsenate con-taining minerals have been undertaken[30]. Some assignment of bands was undertaken and the spectra were simply reported with-out any explanation[30]. There is a vital need to study the molec-ular structure of these types of minerals in more detail.
The first study concerning the spectroscopic characterisation of arsenate bearing minerals of the crandallite group was reported by Gevorkyan et al.[31]. In recent years, the spectroscopic study of ars-enates of the crandallite subgroup was improved by different stud-ies, with special emphasis to the minerals segnitite[32], dussertite [33]and arsenogorceixite[34]. To the best of our knowledge, there have no published papers on the Raman spectroscopy of philipsbor-nite. Raman spectroscopy has proven very useful for the study of minerals. Indeed, Raman spectroscopy has proven most useful for the study of diagenetically related minerals as often occurs with minerals containing phosphate and arsenate groups. This paper is a part of systematic studies of vibrational spectra of the arsenates related to the crandallite subgroup. The objective of this research is to report the Raman spectra of philipsbornite, to relate the spec-tra to the molecular structure of the mineral and to compare the philipsbornite spectra with other crandallite minerals.
Experimental
Mineral
The philipsbornite mineral sample was loaned from The Austra-lian Museum and is registered sample number D 45432. The min-eral originated from the Red Lead mine[35]. The Red Lead Mine is located on the southern edge of the Dundas mining district. The Red Lead ore body is likely connected to the Adelaide Mine that is located on the northern side of the Dundas Ultramafic Complex. The Dundas Ultramafic Sequence consists of a sequence of volca-nic and sedimentary rocks of Eocambrian–Cambrian age. The se-quence was formed in elongate rift troughs within and between regions of polydeformed Precambrian siltstone, orthoquartzite, and minor volcanic rocks. The stratigraphic sequence is represented by sediments of the Success Creek Group which unconformably overlie the Precambrian basement. This sequence is conformably
overlain by the Crimson Creek Formation, that consists of basic vol-caniclastic sedimentary rocks with tholeiitic lavas[36].
Following the Crimson Creek Formation, a phase of high magne-sium andesitic volcanism extruded. During the early Middle Cam-brian a third phase of volcanic activity starts and have produced low-titanium tholeiitic lavas which interdigitate with basal con-glomeratc of the Dundas Group. In the late Middle Cambrian a sub-aerial acid to intermediate volcanic phase, the Mt. Read volcanics, formed contemporaneously with the sedimentary rock sequences of the Dundas Group. During Late Cambrian to Early Devonian, the southeastern part of the Dundas Trough and most of the Mt. Read volcanic belt were covered by marine sediments (Owen Con-glomerate, Gordon Limestone and the Eldon Group)[36].
The surface gossans at the Red Lead Mine lie on the contact of the serpentinites with the Dundas series rocks. The mines origi-nally all worked silver and lead-rich sulphide and carbonate pri-mary ores, but were mostly developed in deeply weathered, to goethite-rich vuggy gossans. These gossanous zones contain a vari-ety of unusual chrome and lead-bearing secondary minerals including crocoite (PbCrO4), grimaldiite (CrO(OH)), petterdite (PbCr2(CO3)2(OH)4H2O), a Cr–Mn oxide, Cr-rich mimetite (Pb5 (AsO4)3Cl) and Cr-rich philipsbornite (PbAl3(AsO4)(AsO3OH)(OH)6).
Raman spectroscopy
Crystals of philipsbornite were placed on a polished metal sur-face on the stage of an Olympus BHSM microscope, which is equipped with 10, 20, and 50 objectives. The power at the sample was 0.1 mW. The spot size of the incident beam was around 1
l
m which is greater than the size of the philipsbornite crystal. This means that the spectrum of several crystals was ob-tained. The microscope is part of a Renishaw 1000 Raman micro-scope system, which also includes a monochromator, a filter system and a CCD detector (1024 pixels). The Raman spectra were excited by a Spectra-Physics model 127 He–Ne laser producing highly polarised light at 633 nm and collected at a nominal resolu-tion of 2 cm1and a precision of ±1 cm1in the range between 200 and 4000 cm1. Repeated acquisitions on the crystals using the highest magnification (50) were accumulated to improve the sig-nal to noise ratio of the spectra. Because of the lack of sigsig-nal, over 1200 scans were made. The spectra were collected over night. Ra-man Spectra were calibrated using the 520.5 cm1line of a silicon wafer. The Raman spectrum of at least 10 crystals was collected to ensure the consistency of the spectra.Infrared spectroscopy
Infrared spectra were obtained using a Nicolet Nexus 870 FTIR spectrometer with a smart endurance single bounce diamond ATR cell. Spectra over the 4000–525 cm1 range were obtained by the co-addition of 128 scans with a resolution of 4 cm1and a mirror velocity of 0.6329 cm/s. Spectra were co-added to improve the signal to noise ratio. The infrared spectra are given in the sup-plementary information.
Spectral manipulation such as baseline correction/adjustment and smoothing were performed using the Spectracalc software package GRAMS (Galactic Industries Corporation, NH, USA). Band component analysis was undertaken using the Jandel ‘Peakfit’ soft-ware package that enabled the type of fitting function to be se-lected and allows specific parameters to be fixed or varied accordingly. Band fitting was done using a Lorentzian–Gaussian cross-product function with the minimum number of component bands used for the fitting process. The Gaussian–Lorentzian ratio was maintained at values greater than 0.7 and fitting was under-taken until reproducible results were obtained with squared corre-lations ofr2greater than 0.995.
Results and discussion
Arsenate vibrations
According to Myneni et al.[37,38]and Nakamoto[39], (AsO4)3 is a tetrahedral unit, which exhibits four fundamental vibrations: the Raman active
m
1 symmetric stretching vibration (A1) at818 cm1; the Raman active doubly degenerate
m
2 symmetric bending vibration (E) observed at 350 cm1, the infrared and Ra-man active triply degenerate
m
3antisymmetric stretching vibration(F2) found around 786 cm1, and the infrared and Raman active tri-ply degenerate
m
4 bending vibration (F2) observed at 405 cm1. Protonation, metal complexation, and/or adsorption on a mineral surface will cause the change in (AsO4)3 symmetry from Td to lower symmetries, such as C3v, C2vor even C1. This loss of degener-acy causes splitting of degenerate vibrations of AsO34 and the shift-ing of the As–OH stretchshift-ing vibrations to different wavenumbers.
Such chemical interactions reduce AsO3
4 tetrahedral symmetry, as mentioned above, to either C3v/C3 (corner-sharing), C2v/C2 (edge-sharing, bidentate binuclear), or C1/Cs (corner-sharing, edge-sharing, bidentate binuclear, multidentate)[37,38]. In associ-ation with AsO3
4 symmetry and coordination changes, theA1band may shift to different wavenumbers and the doubly degenerateE and triply degenerateFmodes may give rise to several newA1, B1, and/orEvibrations[37,38]. In the absence of symmetry devia-tions, AsO3OH2in C3vsymmetry exhibit the
m
sAs–OH andm
asandm
sAsO3OH2vibrations together with corresponding thedAs–OHin-plane bending vibration,d As–OH out-of-plane bending vibra-tion,
m
sAsO3OH2stretching vibration anddas(AsO3OH)2bending vibration [40–42]. Keller [40] assigned observed the following infrared bands in Na2(AsO3OH)7H2O 450 and 360 cm1to thedas (
m
4) (AsO3OH)2bend (E), 580 cm1to thed As–OH out-of-plane bend, 715 cm1to them
As–OH stretch (A1), 830 cm1to the
m
as AsO3OH2stretch (E), and 1165 cm1to thedAs–OH in-plane bend. In the Raman spectrum of Na2(AsO3OH)7H2O, Vansant and Veken [41]attributed observed Raman bands to the following vibrations 55, 94, 116 and 155 cm1to lattice modes, 210 cm1tom
(OH O) stretch, 315 cm1 to (AsO3OH)2 rocking, 338 cm1 to the ds (AsO3)2bend, 381 cm1 to thedas(AsO3OH)2 bend, 737 cm1
to the
m
s As–OH stretch (A1), 866 cm1 to them
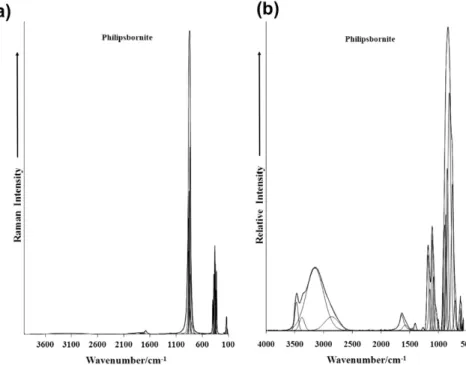
as (AsO3OH)2 stretch (E).Raman and infrared spectroscopy
The Raman spectrum of philipsbornite in the 100–4000 cm1 region is displayed in Fig. 1a and the infrared spectrum in the 500–4000 cm1inFig. 1b. There are large parts of the spectra where no intensity is observed and therefore the spectra are subdivided into sections so that the peaks may be more readily defined. The Raman spectrum of philipsbornite in the 600–1100 cm1region is shown inFig. 2a and the infrared spectrum in the 500–1300 cm1 region inFig. 2b. The Raman spectrum displays an asymmetric peak at 831 cm1with a shoulder on the high wavenumber side. Compo-nent bands may be resolved as is shown. These peaks are attributed to the
m
1(AsO4)3symmetric stretching vibration (A1). It is apparent that the band due to the
m
3 (AsO4)3 antisymmetric stretchingvibration is not observed as a separate band but is coincident with the symmetric stretching vibration. The Raman spectrum of phil-ipsbornite is reported in the RRUFF data base ( http://rruff.info/Phil-ipsbornite), however, no interpretation is given. In this spectrum a broad Raman band at around 850 cm1is observed. The width of the peak suggests that is composed of a series of underlying bands. In the infrared spectrum, these bands are observed as overlapping bands. Two bands at 762 and 814 cm1are attributed to the
m
3 (AsO4)3antisymmetric stretching vibrations. The lower intensity infrared peak at 850 cm1may be due to the
m
1(AsO4)3symmetric stretching vibration. In our Raman spectrum no bands in the 1000– 1200 cm1 region was observed; yet a considerable number of bands are observed in the infrared spectrum. Infrared bands are observed at 1005, 1048, 1086, 1113, 1187 and 1272 cm1. These bands are attributed to sulphate or phosphate in the mineral. In the spectrum in the RRUFF data base two Raman peaks are found at 980 and 1020 cm1. These bands may be assigned to phosphate bands.
The Raman spectrum of philipsbornite in the 100–600 cm1 re-gion is reported inFig. 3. Raman bands are observed at 325, 336, 347, 357, 376 and 399 cm1. The first four bands are assigned to the
m
2 (AsO4)3 symmetric bending vibration (E) and the lattertwo bands are assigned to the
m
4bending vibration (F2). Theassign-ment of these bands is in harmony with the analysis of arsenate vibrations according to Myneni et al.[37,38]and Nakamoto[39]. The observation of multiple bands suggests that the degeneracy of the bending modes has been removed. The doubly degenerate Eand triply degenerateFmodes give rise to several newA1,B1,
and/or E vibrations as is observed in the spectrum shown in Fig. 3 [37,38]. A series of bands at 115, 134, 144, 180 and 189 cm1 are simply described as external vibrations often re-ferred to as lattice vibrations.
The infrared spectrum of philipsbornite in the hydroxyl stretch-ing region is reported inFig. 4. The Raman spectrum shows a very low intensity band centred upon 3162 cm1. The infrared spectrum Fig. 2.(a) Raman spectrum of philipsbornite over the 600–1100 cm1range and (b) infrared spectrum of philipsbornite over the 500–1300 cm1range.
shows greater intensity with infrared bands observed at 2863, 3155, 3382 and 3476 cm1. This latter band is assigned to the OH stretching vibrations of the OH units in the philipsbornite structure (PbAl3(AsO4)2(OH)5H2O). The infrared bands at 3155 and 3382 cm1are assigned to water stretching vibrations.
Studies have shown a strong correlation between OH stretching frequencies and both O O bond distances and H O hydrogen bond distances[43–46]. Libowitzky showed that a regression func-tion can be employed relating the hydroxyl stretching frequencies with regression coefficients better than 0.96 using infrared spec-troscopy [47]. The function is described as:
m
1¼ ð3592304Þ 1090d:ð1321O—OÞcm1. Thus OH—O hydrogen bond distances may becal-culated using the Libowitzky empirical function. The Raman spec-trum of philipsbornite is not suitable for the calculations of hydrogen bond distances. Hydrogen bond distances for philipsbor-nite of 2.8648 Å (3476 cm1), 2.7864 Å (3382 cm1), 2.6896 Å (3155 cm1) and 2.6220 (2863 cm1) are calculated.
A range of hydrogen bond distances are observed from reason-ably strong to weak hydrogen bonding. This range of hydrogen bonding contributes to the stability of the mineral. Two types of OH units can be identified in the structures of philipsbornite. The infrared spectrum of philipsbornite may be divided into two groups of OH stretching wavenumbers; namely 3300–3500 cm1 and 2800–3200 cm1. This distinction suggests that the strength of the hydrogen bonds as measured by the hydrogen bond dis-tances can also be divided into two groups according to the H-bond distances. An arbitrary cut-off point may be 2.74 Å based upon the wavenumber 3300 cm1. The first two hydrogen bond distances are thus defined as weak hydrogen bonds and the latter two as stronger hydrogen bonds.
Conclusions
Raman spectroscopy has proved most useful for the study of the mineral philipsbornite, a member of the crandallite mineral group. Such a mineral contains arsenate and the formation of the mineral offers a mechanism for the accumulation of arsenate. Raman spec-troscopy of philipsbornite shows a broad spectral profile centred upon around 840 cm1. This profile may be deconvoluted into component bands. It is apparent that the profile contains bands due to both the symmetric stretching and antisymmetric stretch-ing modes. Raman bands observed at 325, 336, 347, 357, 376 and 399 cm1are assigned to the
m
2(AsO4)3symmetric bending vibra-tion (E) and to the
m
4bending vibration (F2). The observation of multiple bending modes supports the concept of a reduction in symmetry of the arsenate anion. Raman spectroscopy shows that the philipsbornite is very pure with only the arsenate anion being present. This is unusual as minerals of the crandallite form solid solutions very readily. It would be expected to see the presence of phosphate or even sulphate in the mineral.Minerals of the crandallite group lend themselves to analysis by Raman spectroscopy. Individual crystals may be selected for Ra-man spectroscopic analysis. The spatial resolution is around 1
l
m, compared with infrared spectroscopy where the spatial res-olution is at best 30l
m. This means that the correct crystal can be selected for analysis. Infrared spectroscopy often measures mix-tures of minerals because of this lack of spatial resolution. This is exemplified by the analysis of philipsbornite as detailed in this manuscript. Raman spectroscopy proves that the philipsbornite is a pure arsenate mineral. Some removal of the degeneracy of the vibrational modes is observed. In comparison infrared spectros-copy shows the philipsbornite contains anions other than thearsenate anion. Of course, this is not correct. This simply confirms Raman spectroscopy as a very powerful technique for the charac-terisation of the molecular structure of philipsbornite.
Acknowledgments
The financial and infra-structure support of the Queensland University of Technology, Chemistry discipline is gratefully acknowledged. The Australian Research Council (ARC) is thanked for funding the instrumentation. The Australian Museum is thanked for the loan of the mineral philipsbornite.
References
[1] K. Walenta, M. Zwiener, P.J. Dunn, Neues Jahrb. Min. (1982) 1–5.
[2] R.G. Schwab, C. Goetz, H. Herold, N. Pinto de Oliveira, Neues Jahrb. Min. (1991) 97–112.
[3] R.G. Schwab, H. Herold, C. Goetz, N. Pinto de Oliveira, Neues Jahrb. Min. (1990) 113–126.
[4] J. Sejkora, J. Cejka, V. Srein, M. Novotna, J. Ederova, Neues Jahrb. Min. (1998) 145–163.
[5] J. David, J. Jansa, F. Novak, I. Prachar, Vestnik Ustred. Ust. Geol. 65 (1990) 367– 369.
[6] P. Keller, W. Bartelke, Min. Rec. 13 (1982) 137–147.
[7] S. Matsubara, A. Kato, T. Kamiya, Chigaku Ken. 39 (1990) 101–105. [8] K. Schmetzer, G. Tremmel, O. Medenbach, Neues Jahrb. Min. (1982) 248–254. [9] R.S. Bottrill, P.A. Williams, S. Dohnt, S. Sorrell, N.R. Kemp, Aust. J. Min. 12
(2006) 59–90.
[10] K. Norrish, Trans., Int. Congr. Soil Sci., 9th, 2 (1968) 713–723. [11] M.C.F. Magalhaes, M.C.M. Silva, Neues Jahrb. Min. 134 (2003) 735–743. [12] R.L. Frost, E.C. Keeffe, S. Bahfenne, Spectrochim. Acta A75 (2010) 1476–1479. [13] R.L. Frost, B.J. Reddy, E.C. Keeffe, Spectrochim. Acta A77 (2010) 388–396. [14] R.L. Frost, Spectrochim. Acta A71 (2009) 1788–1794.
[15] R.L. Frost, Spectrochim. Acta A72 (2009) 903–906.
[16] R.L. Frost, S. Bahfenne, J. Graham, Spectrochim. Acta A71 (2009) 1610–1616. [17] R.L. Frost, J. Cejka, Spectrochim. Acta A71 (2009) 1959–1963.
[18] R.L. Frost, J. Cejka, M.J. Dickfos, Spectrochim. Acta A71 (2009) 1799–1803. [19] R.L. Frost, B.J. Reddy, S. Bahfenne, J. Graham, Spectrochim. Acta A72 (2009)
597–604.
[20] R.L. Frost, J. Cejka, J. Sejkora, J. Plasil, B.J. Reddy, E.C. Keeffe, Spectrochim. Acta A78 (2011) 494–496.
[21] R.L. Frost, S.J. Palmer, Spectrochim. Acta A78 (2011) 248–252. [22] R.L. Frost, S.J. Palmer, Spectrochim. Acta A78 (2011) 1255–1260. [23] R.L. Frost, S.J. Palmer, Spectrochim. Acta A78 (2011) 1250–1254. [24] R.L. Frost, S.J. Palmer, Spectrochim. Acta A79 (2011) 1794–1797. [25] R.L. Frost, S.J. Palmer, Spectrochim. Acta A79 (2011) 1215–1219.
[26] R.L. Frost, S.J. Palmer, A vibrational spectroscopic study of the mixed anion mineral sanjuanite Al2(PO4)(SO4)(OH)9H2O, Spectrochim. Acta, Part A 79 (2011) 1210–1214.
[27] R.L. Frost, S.J. Palmer, S. Bahfenne, Spectrochim. Acta A78 (2011) 1302–1304. [28] R.L. Frost, S.J. Palmer, R.E. Pogson, Spectrochim. Acta A79 (2011) 1149–1153. [29] R.L. Frost, B.J. Reddy, S.J. Palmer, E.C. Keeffe, Spectrochim. Acta A78 (2011)
996–1003.
[30] M. Filippi, V. Machovic, P. Drahota, V. Bohmova, Appl. Spectrosc. 63 (2009) 621–626.
[31] S.V. Gevorkyan, A.A. Petrunina, A.S. Povarennykh, Konstit. Svoistva Min. 10 (1976) 51–59.
[32] R.L. Frost, M.L. Weier, W. Martens, S. Mills, J. Mol. Struct. 752 (2005) 178–185. [33] R.L. Frost, S. Bahfenne, J. Cejka, J. Sejkora, J. Plasil, S.J. Palmer, E.C. Keeffe, I.
Nemec, J. Raman Spectrosc. 42 (2011) 56–61.
[34] R.L. Frost, Y. Xi, R.E. Pogson, Spectrochim. Acta A91 (2012) 301–306. [35] J. Haupt, Min. Rec. 19 (1988) 381–388.
[36] A.V. Brown, N.J. Page, A.H. Love, Can. Min. 26 (1988) 161–175.
[37] S.C.B. Myneni, S.J. Traina, G.A. Waychunas, T.J. Logan, Geochim. Cosmochim. Acta 62 (1998) 3285–3300.
[38] S.C.B. Myneni, S.J. Traina, G.A. Waychunas, T.J. Logan, Geochim. Cosmochim. Acta 62 (1998) 3499–3514.
[39] K. Nakamoto, Infrared and Raman Spectra of Inorganic and Coordination Compounds, Wiley, New York, 1986.
[40] P. Keller, Neues Jb. Miner. Mh. (1971) 491–510.
[41] F.K. Vansant, B.J.V.D. Veken, J. Mol. Struct. 15 (1973) 439–444.
[42] F.K. Vansant, B.J.V.D. Veken, H.O. Desseyn, J. Mol. Struct. (1973) 425–437. [43] J. Emsley, Very strong hydrogen bonding, Chem. Soc. Rev. 9 (1980) 91–124. [44] H. Lutz, Struct. Bonding 82 (1995) 85–103.