Structural characterization and vibrational spectroscopy of the arsenate
mineral wendwilsonite
Ray L. Frost
a,⇑, Ricardo Scholz
b, Andrés López
a, Fernanda Maria Belotti
c, Yunfei Xi
a aSchool of Chemistry, Physics and Mechanical Engineering, Science and Engineering Faculty, Queensland University of Technology, GPO Box 2434, Brisbane, Queensland 4001, Australia
b
Geology Department, School of Mines, Federal University of Ouro Preto, Campus Morro do Cruzeiro, Ouro Preto, MG 35400-00, Brazil
c
Federal University of Itajubá, Campus Itabira, Itabira, MG, Brazil
h i g h l i g h t s
We have studied the arsenate mineral
wendwilsonite.
A comparison is made with the
roselite mineral group.
The Raman arsenate stretching region
shows strong differences between that of wendwilsonite and roselite.
By using a Libowitzky empirical
equation, hydrogen bond distances of 2.65 and 2.75 Å are estimated.
Vibrational spectra enable the
molecular structure of the wendwilsonite mineral to be determined.
g r a p h i c a l
a b s t r a c t
a r t i c l e
i n f o
Article history:
Received 26 August 2013
Received in revised form 3 September 2013 Accepted 7 September 2013
Available online 27 September 2013
Keywords: Wendwilsonite Arsenate
Raman spectroscopy Infrared spectroscopy Roselite
a b s t r a c t
In this paper, we have investigated on the natural wendwilsonite mineral with the formulae Ca2(Mg,Co)(AsO4)22(H2O). Raman spectroscopy complimented with infrared spectroscopy has been used
to determine the molecular structure of the wendwilsonite arsenate mineral. A comparison is made with the roselite mineral group with formula Ca2B(AsO4)22H2O (where B may be Co, Fe2+, Mg, Mn, Ni, Zn).
The Raman spectra of the arsenate related to tetrahedral arsenate clusters with stretching region shows strong differences between that of wendwilsonite and the roselite arsenate minerals which is attributed to the cation substitution for calcium in the structure.
The Raman arsenate (AsO4)3 stretching region shows strong differences between that of
wendwilso-nite and the roselite arsenate minerals which is attributed to the cation substitution for calcium in the structure. In the infrared spectra complexity exists of multiple to tetrahedral (AsO4)3 clusters with
anti-symmetric stretching vibrations observed indicating a reduction of the tetrahedral symmetry. This loss of degeneracy is also reflected in the bending modes. Strong Raman bands around 450 cm 1are assigned to
m4bending modes. Multiple bands in the 350–300 cm 1region assigned tom
2bending modes provide
evi-dence of symmetry reduction of the arsenate anion. Three broad bands for wendwilsonite found at 3332, 3119 and 3001 cm 1are assigned to OH stretching bands. By using a Libowitzky empirical equation,
hydrogen bond distances of 2.65 and 2.75 Å are estimated. Vibrational spectra enable the molecular structure of the wendwilsonite mineral to be determined and whilst similarities exist in the spectral pat-terns with the roselite mineral group, sufficient differences exist to be able to determine the identifica-tion of the minerals.
Ó2013 Elsevier B.V. All rights reserved.
1386-1425/$ - see front matterÓ2013 Elsevier B.V. All rights reserved.
http://dx.doi.org/10.1016/j.saa.2013.09.048
⇑ Corresponding author. Tel.: +61 7 3138 2407; fax: +61 7 3138 1804. E-mail address:[email protected](R.L. Frost).
Contents lists available atScienceDirect
Spectrochimica Acta Part A: Molecular and
Biomolecular Spectroscopy
Introduction
Wendwilsonite is an arsenate of calcium and magnesium and is ideally of formula Ca2Mg(AsO4)22H2O[1]. The mineral is the mag-nesium analogue of roselite[2]and forms a continuous series with this mineral. The mineral is pale pink to red and may be color zoned. The mineral has a triclinic structure with point group (2/m). The space group is (P21/c) and unit cell data are a =5.806(1) Å, b =12.912(2) Å, c =5.623(1) Å, b= 107°24(1)0,
V= 402.2(1) Å3, and two molecular formula per unit cell (Z= 2). The vibrational modes of oxyanions in aqueous systems are well known. The symmetric stretching vibration of the arsenate anion (
m
1) is observed at 810 cm 1and coincides with the position of the antisymmetric stretching mode (m
3). The symmetric bending mode (m
2) is observed at 342 cm 1and the antisymmetric bending mode (m
4) at 398 cm 1. The positions of the arsenate vibrations oc-cur at lower wavenumbers than any of the other naturally ococ-cur- occur-ring oxyanions. Farmer[3] lists a number of infrared spectra of arsenates including roselite, annabergite, erythrite, symplesite and köttigite. The effect of reduced site symmetry in the crystal (compared with the free arsenate ion) will remove the degeneracy and allow splitting of the bands according to factor group analysis. Farmer based upon the work of Moenke reported the infrared spec-tra of roselite[3]. Farmer listed two bands at 985 and 920 cm 1 and assigned these bands to them
1(AsO4)2 symmetric stretching vibrations [3]. Them
3 (AsO4)2 symmetric stretching vibrations were listed as 870, 850 and 805 cm 1. The assignment of these bands does not appear to be correct. Them
4bending modes were found at 453 and 435 cm 1. Nom
2bands were provided. A band at 535 cm 1 was not assigned but may well be attributed to a water libration mode. No OH stretching vibrations were tabled. For comparison Farmer listed the
m
1andm
3bands of annabergite at 832 cm 1and 795 cm 1. Them
4bending modes were found at 510, 460 and 427 cm 1for annabergite. Two OH stretching vibra-tions were observed at 3430 and 3160 cm 1 for annabergite. A number of bands were listed which were unassigned. To the best of our knowledge, few Raman spectra of the fairfieldite or roselite mineral subgroups have been undertaken[4].
Few comprehensive studies of the fairfieldite and roselite min-eral subgroups and related minmin-erals such as divalent cationic ars-enates have been undertaken [3]. Most of the infrared data predates the advent of Fourier transform infrared spectroscopy [5–10]. Although some Raman studies of some arsenate minerals have been undertaken[11,12]no Raman spectroscopic investiga-tion of roselite arsenate minerals has been forthcoming. Griffith [13]did report the results of the Raman spectrum of a synthetic annabergite. The symmetric stretching mode of the tetrahedral (AsO4)2 clusters was observed at 859 cm 1; the antisymmetric stretching mode at 880 cm 1, the symmetric bending mode at 438 cm 1 and antisymmetric bending mode at 452 cm 1; other bands were located at 797 and 820 cm 1[13]. The structural inves-tigation of some arsenates and the nature of the hydrogen bond in these structures have been undertaken[14]. It was found that the hydroxyl unit was coordinated directly to the metal ion and formed hydrogen bonds to the arsenate anion[14].
As part of a comprehensive study of the molecular structure of minerals containing oxyanions using of the IR and Raman spectros-copy, we report the vibrational spectroscopic properties of the above named wendwilsonite.
Experimental
Samples description and preparation
The wendwilsonite sample studied in this work was collected from the Bou Azzer district, Morocco. The mineral occurs in
association with dolomite and shows prismatic habitus. The sam-ple was incorporated into the collection of the Geology Depart-ment of the Federal University of Ouro Preto, Minas Gerais, Brazil, with sample code SAB-112. The sample was gently crushed and the associated minerals were removed under a stereomicro-scope Leica MZ4. Scanning electron microscopy (SEM) was applied to support the chemical characterization.
The Bou Azzer district is well known as an important source of arsenates. The region is the type locality of a number of minerals, including wendwilsonite.
Scanning electron microscopy (SEM)
Experiments and analyses involving electron microscopy were performed in the Center of Microscopy of the Universidade Federal de Minas Gerais, Belo Horizonte, Minas Gerais, Brazil.
Wendwilsonite crystal aggregate was coated with a 5 nm layer of evaporated Au. Secondary Electron and Backscattering Electron images were obtained using a JEOL JSM-6360LV equip-ment. Qualitative and semi-quantitative chemical analyses in the EDS mode were performed with a ThermoNORAN spectrometer model Quest and was applied to support the mineral characterization.
Raman microprobe spectroscopy
Crystals of wendwilsonite were placed on a polished metal sur-face on the stage of an Olympus BHSM microscope, which is equipped with 10, 20, and 50 objectives. The microscope is part of a Renishaw 1000 Raman microscope system, which also in-cludes a monochromator, a filter system and a CCD detector (1024 pixels). The Raman spectra were excited by a Spectra-Physics mod-el 127 He–Ne laser producing highly polarized light at 633 nm and collected at a nominal resolution of 2 cm 1 and a precision of ±1 cm 1in the range between 200 and 4000 cm 1. Repeated acqui-sitions on the crystals using the highest magnification (50) were accumulated to improve the signal to noise ratio of the spectra. Ra-man Spectra were calibrated using the 520.5 cm 1line of a silicon wafer.
Infrared spectroscopy
Infrared spectra were obtained using a Nicolet Nexus 870 FTIR spectrometer with a smart endurance single bounce diamond ATR cell. Spectra over the 4000–525 cm 1 range were obtained by the co-addition of 128 scans with a resolution of 4 cm 1and a mirror velocity of 0.6329 cm/s. Spectra were co-added to improve the signal to noise ratio.
Results and discussion
Chemical characterization
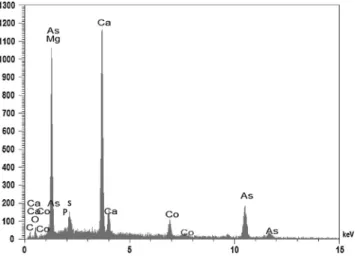
The SEM image of wendwilsonite sample studied in this work is shown inFig. 1. The image shows a wendwilsonite crystal with prismatic habitus. The mineral occurs in association with small amounts of dolomite. Qualitative chemical analysis shows Ca and As as the dominant elements (Fig. 2). Minor amounts of Co, Mg, P and S were found (Fig. 2).
Vibrational spectroscopy background
According to Myneni et al.[15,16]and Nakamoto[17], (AsO4)3 is a tetrahedral unit, which exhibits four fundamental vibrations: the Raman active
m
1 symmetric stretching vibration (A1) at 818 cm 1; the Raman active doubly degeneratem
2 symmetric bending vibration (E) observed at 350 cm 1, the infrared and Ra-man active triply degenerate
m
3antisymmetric stretching vibration (F2) found around 786 cm 1, and the infrared and Raman active tri-ply degeneratem
4 bending vibration (F2) observed at 405 cm 1. Protonation, metal complexation, and/or adsorption on a mineral surface will cause the change in (AsO4)3 symmetry from Td to lower symmetries, such as C3v, C2vor even C1. This loss of degener-acy causes splitting of degenerate vibrations of AsO34 and the shift-ing of the As-OH stretchshift-ing vibrations to different wavenumbers.
Such chemical interactions reduce AsO3
4 tetrahedral symmetry, as mentioned above, to either C3v/C3 (corner-sharing), C2v/C2 (edge-sharing, bidentate binuclear), or C1/Cs (corner-sharing, edge-sharing, bidentate binuclear, multidentate)[15,16]. In associ-ation with AsO3
4 symmetry and coordination changes, theA1band may shift to different wavenumbers and the doubly degenerateE and triply degenerateFmodes may give rise to several newA1, B1, and/orEvibrations[15,16]. In the absence of symmetry devia-tions, AsO3OH2 in C3vsymmetry exhibit the
m
sAs-OH andm
asandm
sAsO3OH2 vibrations together with corresponding thedAs-OH in-plane bending vibration,dAs-OH out-of-plane bending vibra-tion,m
sAsO3OH2 stretching vibration anddas(AsO3OH)2 bending vibration [18–20]. Keller [18] assigned observed the following infrared bands in Na2(AsO3OH)7H2O 450 and 360 cm 1to thedas (m
4) (AsO3OH)2 bend (E), 580 cm 1to thedAs-OH out-of-plane bend, 715 cm 1to them
As-OH stretch (A1), 830 cm 1to the
m
as AsO3OH2 stretch (E), and 1165 cm 1to thedAs-OH in plane bend. In the Raman spectrum of Na2(AsO3OH)7H2O, Vansant and Veken[19]attributed observed Raman bands to the following vibrations 55, 94, 116 and 155 cm 1to lattice modes, 210 cm 1to
m
(OHO) stretch, 315 cm 1 to (AsO
3OH)2 rocking, 338 cm 1 to the ds
(AsO3)2 bend, 381 cm 1 to the das (AsO3OH)2 bend, 737 cm 1 to the
m
s As-OH stretch (A1), 866 cm 1 to them
as (AsO3OH)2 stretch (E).Vibrational spectroscopy
Spectroscopic methods are the most direct and powerful means of obtaining experimental information on the electronic structure of materials. Moreover, Raman spectroscopy is considered a pow-erful tool in order to estimate the degree of structural order–disor-der at short-range in different types of the materials. The Raman spectrum of wendwilsonite over the 100–4000 cm 1spectral range
Fig. 1.Backscattered electron image (BSI) of a wendwilsonite single crystal up to 1.0 mm in length.
Fig. 2.EDS analysis of wendwilsonite.
Fig. 3.(a) Raman spectrum of wendwilsonite over the 4000–100 cm1spectral
range. (b) Infrared spectrum of wendwilsonite over the 4000–500 cm 1spectral
is illustrated inFig. 3a. This spectrum displays the position of the Raman bands and their relative intensities. Importantly, the inten-sity in the 3300–3100 cm 1region is low. There are large parts of the spectrum where no intensity or little intensity is observed, and therefore the spectrum is subdivided into sections depending upon the type of vibration being studied. It is noted that the intensity in the OH stretching region (3000–3600 cm 1) is low. The infrared spectrum of wendwilsonite over the 500–4000 cm 1spectral range is shown inFig. 3b. Significantly, more intensity is now observed in the infrared spectrum of the OH stretching region. This spectrum may be subdivided into subsections depending upon the type of vibration being studied.
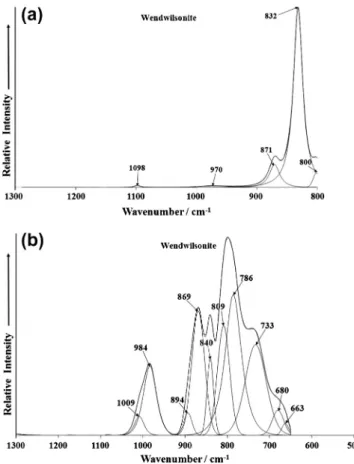
The Raman spectrum of wendwilsonite in the 800–1300 cm 1 spectral range is shown inFig. 4a. The spectrum is dominated by a sharp band at 832 cm 1 assigned to the
m
1 symmetric AsO34 clusters symmetric stretching mode. A low intensity band is ob-served at 800 cm 1which may be assigned to the
m
3antisymmetric tetrahedral AsO3
4 clusters stretching vibration. A very low inten-sity band is found at 970 cm 1. This band is due to a
m
1symmetric PO3
4 stretching vibration[21,22]. The presence of this band indi-cates some phosphorus substitution for As in the wendwilsonite structure. Another very low intensity band is observed at 1098 cm 1and is indicative of the presence of carbonate.
The position of tetrahedral AsO4clusters stretching bands ap-pears to vary depending on the cation in the formula of the roselite subgroup mineral. Bands are observed for talmessite (Ca2Mg) at 828, 814 and 781 cm 1. For the talmessite (Ca
2Co) Raman bands are observed at 868, 841 and 824 cm 1. For the mineral roselite two bands are observed at 864 and 798 cm 1. Raman bands have been observed at 854 and 800 cm 1for annabergites. In the roselite subgroup, Raman spectra, there does not appear to be
any phosphate isomorphic substitution. In the infrared spectra of roselite as reported by Farmer[3], two infrared bands were re-ported at 985 and 920 cm 1. These bands were assigned by Farmer
[3]to the
m
1symmetric stretching mode of the tetrahedral (AsO4) 3-anions. Such an assignment in the light of these Raman results for roselite seems unlikely. A more likely assignment is to them
1 sym-metric stretching mode of the tetrahedral (PO4)3 anion. This iso-morphic substitution of phosphate for arsenate may in itself be unusual as whilst cationic isomorphic substitution is common, it is not known whether the anionic substitution is common. Current literature does not report any anionic isomorphic substitution. Ra-man spectral studies of the vivianite phosphates show that there is a band at 951 cm 1for vivianite and bobierrite[21]. The bands are observed at 852 and 792 cm 1 for erythrite and at 875 and 807 cm 1for hörnesite. No bands are observed in these positions for the roseite minerals. Bands at 841 (talmessite-Co), 828 cm 1 (talmessite) 798 cm 1(roselite are assigned to them
1 symmetric stretching modes of A1 symmetry. Griffith [13] reported Raman bands for a synthetic annabergite at 880, 859, 820 and 797 cm 1. The low intensity band observed around 864 cm 1for roselite is assigned to the E1gmode.
The infrared spectrum of wendwilsonite over the 500–1300 cm 1 spectral range is shown in Fig. 4b. A series of overlapping infrared bands are observed which may be resolved into component bands. The broad infrared band at around 800 cm 1resolved into component bands at 809 and 786 cm 1is assigned to the
m
3 antisymmetric tetrahedral AsO34 clusters stretching modes. The infrared bands at 869and 840 cm 1with a low intensity shoulder at 894 cm 1are attributed to the
m
1 sym-metric tetrahedral AsO34 clusters symmetric stretching mode. The infrared bands at 733, 680 and 663 cm 1 are likely to be a water librational modes.
The spectra are a complex set of overlapping bands which may be curve-resolved into component bands as is shown. The pattern is similar for talmessite, roselite and messelite. However the pat-tern for the talmessite appears better resolved. The most intense infrared band for the roselite arsenates is observed at 785 cm 1 and is assigned to the tetrahedral (AsO4)3 clusters antisymmetric stretching vibration. This band corresponds to the second intense band in the Raman spectra. The most intense band for vivianite arsenates was found to be at around 768–795 cm 1which corre-sponds well to the bands for the roselite mineral subgroup. Griffith [13]reported infrared bands at 795 and 832 cm 1for a synthetic annabergite. A band at around 825 cm 1is observed in all of the infrared spectra. The infrared spectrum of erythrite showed bands at 825 and 768 cm 1. Based upon the infrared spectra Farmer[3] reported bands at 825 and 783 cm 1for erythrite. Farmer found that that the
m
1 andm
3 modes using infrared spectroscopy were at 832 and 795 cm 1for annabergite, 825 and 783 cm 1for ery-thrite. Infrared bands were observed at 890, 868, 845, 828 and 790 cm 1. The complexity of the infrared spectra of this region is in agreement with Raman data. This complexity simply reflects the mixed cationic species in this hydrated roselite arsenates. The number of peaks reflects the bonding of the arsenate to differ-ent cations with consequdiffer-ent reduction in symmetry of the arsenate anion. This is in agreement with our Raman data, it is suggested that the two vibrations at 854 and around 790 cm 1are the tetra-hedral AsO4 clusters symmetric and antisymmetric stretching vibrations respectively. Two additional bands are observed in the infrared spectra at around 560 and 690 cm 1. These two bands are not attributed to arsenate vibrations and since water is the only other molecule present in the structure then, these two bands are assigned to water librational modes. It is interesting that based upon the work of Moenke, Farmer [3] reported bands at 605 cm 1for the arsenate minerals annabergite and at 555 cm 1 for erythrite, which were unassigned.Fig. 4.(a) Raman spectrum of wendwilsonite over the 1400–800 cm1spectral
range. (b) Infrared spectrum of wendwilsonite over the 1300–500 cm1spectral
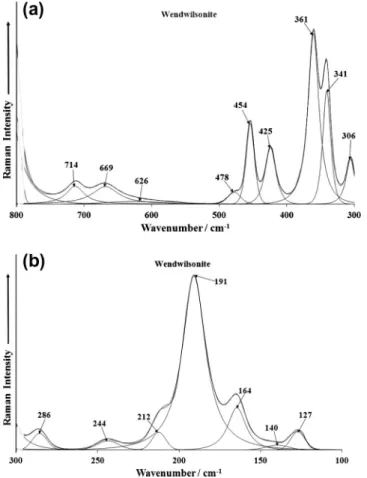
The Raman spectra in the 300–800 cm 1 and 100–300 cm 1 spectral range are illustrated inFig. 5a and b. Raman bands are ob-served at 425 and 454 cm 1and are assigned to the triply degen-erate (AsO4)3 cluster bending vibration (F2,
m
4). Raman bands at 341 and 361 cm 1are due to the tetrahedral (AsO4)3 cluster
m
2 bending vibration. The band at 306 cm 1is ascribed to a metal oxy-gen stretching vibration. The band at 478 cm 1 may be also as-signed to them
2PO43 bending mode. The Raman bands at 714, 669 and 626 cm 1may be due to water librational modes. An in-tense band is found at 191 cm 1with Raman bands of lower inten-sity observed at 127, 164, 212, 244 and 286 cm 1. These bands are simply described as external vibrations or lattice modes, although the last band at 286 cm 1may be due to a metal oxygen stretching band.The low wavenumber region of roselite is complex and it is dif-ficult to separate the Raman bands according to their symmetry. The spectrum of the low wavenumber region may be divided into three separate regions: (a) 450–400 cm 1, (b) 360–330 cm 1and (c) 250–100 cm 1. Three regions are assigned to (a)
m
4modes, (b)
m
2modes and (c) AsO stretching, bending and lattice modes. Them
4bending vibration should be common for all samples and should be intense. The most intense bands occur in two regions (a) around 450 cm 1and around 225 cm 1. The most intense band is observed at 452 cm 1for talmessite-Co, 466 cm 1for talmessite. Two bands are observed for roselite at 463 and 440 cm 1. The second most in-tense region in the Raman spectra is in the 360–300 cm 1region. For both the natural and synthetic annabergites, two bands are ob-served at 466 and 442 cm 1and for the arsenate mineral erythrite bands are observed at 457 and 439 cm 1. For the arsenate mineral köttigite bands are observed at 451 and 432 cm 1. These bands areattributed to the
m
4bending modes. The positions of these bands are observed at slightly lower wavenumbers for the arsenate min-eral hörnesite and are found at 429 and 403 cm 1. Farmer[3] re-ported the infrared spectra of annabergite and erythrite and gave infrared band positions of 510, 460 and 427 cm 1for annabergite and at 490, 452 and 428 cm 1for erythrite. The latter two bands for these two minerals are in excellent agreement with the Raman bands reported in this work. Griffith[21]reported them
4modes in the Raman spectra at 452 and 438 cm 1.The Raman and infrared spectrum of wendwilsonite in the 2600–3800 cm 1spectral range are displayed inFig. 6. Strong Ra-man bands are observed at 3332 and 3119 cm 1are attributed to water stretching vibrations. The infrared spectrum shows bands in similar positions at 3317 and 3113 cm 1 ascribed to water stretching vibrations. Other low intensity infrared bands at 2918, 2848 and 2734 cm 1 are described as CH stretching vibrations due to organic impurities.
Factor group analyses predict that there should be 12 active internal modes for each water site in these roselite hydrated arse-nates including wendwilsonite. For talmessite-Co two Raman bands are observed at 3318 and 3167 cm 1, for talmessite three bands are observed at 3351, 3269 and 3180 cm 1and for roselite three broad bands are found at 3450, 3208 and 3042 cm 1. In gen-eral, four Raman bands should be observed in the hydroxyl-stretching region. Four bands have been found for annabergite, erythrite, köttigite and hörnesite. The lack of observation of four bands is not expected. This may be attributed to accidental degen-eracy. There are two water molecules in the unit cell and conse-quently there are four OH units, which can vibrate both in-phase and out-of-phase, giving four bands. For annabergite four Raman
Fig. 5.(a) Raman spectrum of wendwilsonite over the 800–300 cm1 spectral
range. (b) Raman spectrum of wendwilsonite over the 300–100 cm1 spectral
range.
Fig. 6.(a) Raman spectrum of wendwilsonite over the 3800–2600 cm 1spectral
range. (b) Infrared spectrum of wendwilsonite over the 3800–2600 cm 1spectral
bands are observed at 3419, 3209, 3185 and 3010 cm 1. The Ra-man spectrum of the natural köttigite like that of roselite is broad and two bands are observed at 3458 and 3215 cm 1. The Raman spectrum of hörnesite resembles that of annabergite and bands are observed at 3479, 3166 and 3030 cm 1. A comparison of the water OH stretching vibrations of these minerals enables the min-erals to be classified.
The infrared spectra of the water OH stretching region of the roselite subgroup also show some similarity although some of the spectra are broad and suffer from a lack of signal to noise. Four infrared bands are found for talmessite at 3571, 3348, 3168 and 3027 cm 1. For talmessite infrared bands are resolved at 3339, 3265, 3239 and 3181 cm 1. An additional broad band is required at 3102 cm 1 to fit the spectral profile. For roselite, infrared bands are found at 3320 and 3099 cm 1; however the bands are broad and also suffer from a lack of signal. For com-parison the infrared spectrum of annabergite showed OH stretching vibrations at 3412, 3155 and 2972 cm 1. These values may be compared with the published results of 3430 and 3160 cm 1[14]. The infrared spectra of erythrite appear to vary slightly depending on the origin of the natural sample. Without doubt this depends on the amount of cationic substitution. For the erythrite from Queensland, bands were observed at 3460, 3294 and 3099 cm 1. These values compare favourably with the published data [14]. For köttigite, IR bands were observed at 3440, 3185 and 3045 cm 1. These results may be compared with the published data of symplesite where only a single broad band at 3385 cm 1was observed. The infrared spectra of köttig-ite for a mixed cationic arsenate reported by Farmer [3] (page 399), showed three OH stretching bands at 3440, 3185 and 3045 cm 1. For hörnesite infrared bands were observed at 3478, 3273, 3142, 3038, and 3000 cm 1. The Raman spectrum
of wendwilsonite in the 1300–2000 cm 1 spectral range is displayed in Fig. 7a and the infrared spectrum in the 1300– 1800 cm 1 spectra region is shown inFig. 7b. The Raman spec-trum suffers from a lack of signal which is not unexpected as water is a very poor Raman scatterer. In contrast, the infrared spectrum in this spectral range shows intense bands at 1609, 1643 and 1682 cm 1, assigned to the water bending modes. Water is a very strong infrared absorber and so the bands are in-tense in this spectral region.
Studies have shown a strong correlation between OH stretch-ing frequencies and both the O O bond distances and with the H O hydrogen bond distances[22–25]. The elegant work of Lib-owitzky showed that a regression function could be employed relating the above correlations with regression coefficients better than 0.96[26]. The OH stretching vibrations in the infrared spec-tra of wendwilsonite, enable the calculation of predicted hydro-gen bond distances of 2.623 Å (2872 cm 1), 2.679 Å (3113 cm 1) 2.6232 Å (3317 cm 1). Four hydrogen bond distances for talmes-site are 2.76 Å, 2.72 Å, 2.71 Å and 2.697 Å. For roselite, hydrogen bond distances of 2.75 and 2.67 Å are calculated. Two types of water molecules are identified in the structure and the known hydrogen bond distances used to predict the hydroxyl stretching frequencies. The data fundamentally distinguishes between two types of water according to the hydrogen bond distances, namely strongly hydrogen bonded water and weakly hydrogen bonded water. However the predicted values do not take into ac-count factor group splitting, accidental degeneracy and in-phase and out-of-phase vibrations. The strong hydrogen bonding would suggest that the thermal decomposition of the minerals would take place at significantly high temperatures. Some thermal studies were performed on collinsite, fairfieldite, and talmessite, and show the dehydration temperature increased with the strength of H bonds[27,28].
Conclusions
A combination of Raman spectroscopy at ambient temperatures complimented with infrared spectroscopy has been used to charac-terize the arsenate known as wendwilsonite and also arsenates of the roselite mineral subgroup. Extensive isomorphic substitution of calcium by Mg or Co has been found for the roselite minerals. The fundamental vibrations in the spectra are related to the struc-ture of the minerals. The wendwilsonite arsenate mineral is char-acterized by typical spectra of the tetrahedral arsenate clusters. The symmetric stretching modes are observed in the 800– 880 cm 1 region; the antisymmetric stretching modes are ob-served in the 814–824 cm 1 region. Some bands are observed around 780 cm 1 region and are attributed to water librational modes. The
m
4 bending modes are observed around 454 cm 1 and them
2bending modes in the 340–365 cm 1region. Multiple bands are observed in these regions indicating a loss of symmetry of the arsenate unit.Acknowledgments
The financial and infra-structure support of the Discipline of Nanotechnology and Molecular Science, Science and Engineering Faculty of the Queensland University of Technology, is gratefully acknowledged. The Australian Research Council (ARC) is thanked for funding the instrumentation. The authors would like to acknowledge the Center of Microscopy at the Universidade Federal de Minas Gerais (http://www.microscopia.ufmg.br) for providing the equipment and technical support for experiments involving electron microscopy. R. Scholz thanks to CNPq – Conselho Nacional Fig. 7.(a) Raman spectrum of wendwilsonite over the 2000–1300 cm 1spectral
range. (b) Infrared spectrum of wendwilsonite over the 1800–1300 cm 1spectral
de Desenvolvimento Científico e Tecnológico (Grant No. 306287/ 2012-9).
References
[1]P.J. Dunn, B.D. Sturman, J.A. Nelen, Amer. Min. 72 (1987) 217–221. [2]R.L. Frost, Spectrochim. Acta 71A (2009) 1788–1794.
[3] V.C. Farmer, Mineralogical Society Monograph 4: The Infrared Spectra of Minerals, London, 1974.
[4]R.L. Frost, Spectrochim. Acta 71 (2008) 1788–1794.
[5]K. Omori, T. Seki, Ganseki Kobutsu Kosho Gakkaishi 44 (1960) 7–13. [6]S.V. Gevork’yan, A.S. Povarennykh, Konst. Svoistva Miner. 7 (1973) 92–99. [7]S.V. Gevork’yan, A.S. Povarennykh, Mineral. Zh. 2 (1980) 29–36. [8]G.R. Hunt, J.W. Salisbury, C.J. Lenhoff, Mod. Geol. 3 (1972) 121–132. [9]G.R. Hunt, Geophysics 42 (1977) 501–513.
[10]R. Sitzia, Rendiconti del Seminario della Facolta di Scienze dell’Universita di Cagliari 36 (1966) 105–115.
[11]B. Piriou, J.F. Poullen, J. Raman Spectrosc. 15 (1984) 343–346.
[12]C.A. Melendres, N. Camillone III, T. Tipton, Electrochim. Acta 34 (1989) 281– 286.
[13]W.P. Griffith, J. Chem. Soc. A (1970) 286–291. [14]V.I. Sumin De Portilla, Can. Mineral. 12 (1974) 262–268.
[15]S.C.B. Myneni, S.J. Traina, G.A. Waychunas, T.J. Logan, Geochim. Cosmochim. Acta 62 (1998) 3285–3300.
[16]S.C.B. Myneni, S.J. Traina, G.A. Waychunas, T.J. Logan, Geochim. Cosmochim. Acta 62 (1998) 3499–3514.
[17]K. Nakamoto, Infrared and Raman Spectra of Inorganic and Coordination Compounds, Wiley, New York, 1986.
[18]P. Keller, Neues Jb. Miner. Mh. (1971) 491–510.
[19]F.K. Vansant, B.J.V.D. Veken, J. Mol. Struct. 15 (1973) 439–444.
[20] F.K. Vansant, B.J.V.D. Veken, H.O. Desseyn, J. Mol. Struct. 15 (1973) 425–437. [21]R.L. Frost, M. Weier, Neues Jahrb. Min. (2004) 445–463.
[22]W. Jastrzebski, M. Sitarz, M. Rokita, K. Bulat, Spectrochim. Acta A79 (2011) 722.
[23]W. Mikenda, J. Mol. Struct. 147 (1986) 1–15. [24]A. Novak, Struct. Bond. 18 (1974) 177–216. [25]H. Lutz, Struct. Bond. 82 (1995) 85–103. [26]J. Emsley, Chem. Soc. Rev. 9 (1980) 91–124.
[27]E. Libowitsky, Monat. fur Chem. 130 (1999) 1047–1049.