Raman spectroscopy of the arsenate minerals maxwellite
and in comparison with tilasite
Ray L. Frost
a,⇑, Ricardo Scholz
b, Andrés López
a, Yunfei Xi
aa
School of Chemistry, Physics and Mechanical Engineering, Science and Engineering Faculty, Queensland University of Technology, GPO Box 2434, Brisbane Queensland 4001, Australia
b
Geology Department, School of Mines, Federal University of Ouro Preto, Campus Morro do Cruzeiro, Ouro Preto, MG 35,400-00, Brazil
h i g h l i g h t s
We have studied the arsenate mineral maxwellite NaFe3+(AsO
4)F.
A comparison is made with tilasite CaMg(AsO4)F.
Chemical analysis shows that maxwellite is composed of Fe, Na and Ca with minor amounts of Mn and Al. Raman and infrared bands are
assigned.
The molecular structure of maxwellite is assessed.
g r a p h i c a l
a b s t r a c t
a r t i c l e
i n f o
Article history:
Received 24 September 2013
Received in revised form 2 December 2013 Accepted 11 December 2013
Available online 25 December 2013
Keywords: Raman spectroscopy Maxwellite Tilasite Durangite Arsenate
a b s t r a c t
Maxwellite NaFe3+(AsO
4)F is an arsenate mineral containing fluoride and forms a continuous series with tilasite CaMg(AsO4)F. Both maxwellite and tilasite form a continuous series with durangite NaAl3+(AsO4 )-F. We have used the combination of scanning electron microscopy with EDS and vibrational spectroscopy to chemically analyse the mineral maxwellite and make an assessment of the molecular structure. Chem-ical analysis shows that maxwellite is composed of Fe, Na and Ca with minor amounts of Mn and Al. Raman bands for tilasite at 851 and 831 cm 1are assigned to the Raman activem
1symmetric stretching vibration (A1) and the Raman active triply degeneratem3antisymmetric stretching vibration (F2). The Raman band of maxwellite at 871 cm 1is assigned to them
1symmetric stretching vibration and the Raman band at 812 cm 1is assigned to them
3antisymmetric stretching vibration. The intense Raman band of tilasite at 467 cm 1is assigned to the Raman active triply degenerate m
4bending vibration (F2). Raman band at 331 cm 1for tilasite is assigned to the Raman active doubly degeneratem2symmetric bending vibration (E). Both Raman and infrared spectroscopy do not identify any bands in the hydroxyl stretching region as is expected.
Ó2013 Elsevier B.V. All rights reserved.
Introduction
Maxwellite NaFe3+(AsO4)F[1]is an arsenate mineral containing fluoride and forms a continuous series with tilasite CaMg(AsO4)F
[2,3]. Both minerals may form a continuous series with durangite
[4–6]. These three minerals all form part of the tilasite mineral group which are anhydrous arsenates with an additional anion
[7]. In the case of these three minerals, it is the fluoride anion. Maxwellite is bright red whereas the colour of tilasite varies according to the mineral composition from violet gray, green, gray, to pink brown. Durangite colour is light to dark orange–red, red; green; orange–yellow in artificial light. The colour of the solid solu-tions of these three minerals will be dependent on the composition
1386-1425/$ - see front matterÓ2013 Elsevier B.V. All rights reserved. http://dx.doi.org/10.1016/j.saa.2013.12.081
⇑Corresponding author. Tel.: +61 7 3138 2407; fax: +61 7 3138 1804. E-mail address:[email protected](R.L. Frost).
Contents lists available atScienceDirect
Spectrochimica Acta Part A: Molecular and
Biomolecular Spectroscopy
of the mineral. Maxwellite is named after Charles Henry Maxwell of U.S. Geological Survey. Tilasite is named after Daniel Tilas (1712-1772), a Swedish mining engineer. The type mineral speci-men of durangite originates from the Barranca tin mine, about 30 km northeast of Coneto de Comonfort, Durango, Mexico and thus durangite is named after its place of origin.
All three minerals are monoclinic [1,8,9]. Maxwellite cell parameters [8] are a= 7.161 Å, b= 8.78 Å, c= 6.687 Å, Z= 4; beta = 114.58°V= 382.34 Den(Calc) = 4.11 and the values may be compared with tilasite whose cell parameters are a= 7.553 Å, b= 8.951 Å,c= 6.701 Å,Z= 4; beta = 120.967°V= 388.46[10]. The values for durangite area= 6.579 Å,b= 8.523 Å,c= 7.048 Å,Z= 4; beta = 115.47°V= 356.79[11,12]. The cell parameters of all three minerals are very close. It is likely that these cell parameters are a function of the cation content. Crystals of maxwellite are pris-matic with crystals shaped like slender prisms such as with tour-maline and form aggregates of numerous individual crystals or clusters. The habit of tilasite is quite similar but forms uniformly indistinguishable crystals forming large masses.
Raman spectroscopy has proven very useful for the study of minerals. Indeed Raman spectroscopy has proven most useful for the study of diagenetically related minerals as often occurs with minerals containing sulphate, arsenate and/or phosphate groups. Raman spectroscopy is especially useful when the minerals are X-ray non-diffracting or poorly diffracting and very useful for the study of amorphous and colloidal minerals. This paper is a part of systematic studies of vibrational spectra of minerals of second-ary origin in the oxide supergene zone. In this work, we attribute bands at various wavenumbers to vibrational modes of maxwellite and tilasite using Raman spectroscopy and relate the spectra to the structure of the mineral.
Experimental
Minerals
The minerals were incorporated into the collection of the Geol-ogy Department of the Federal University of Ouro Preto, Minas Ger-ais, Brazil, with sample codes SAC-119 (maxwellite) and SAC-117 (tilasite). The samples were gently crushed and the associated min-erals were removed under a stereomicroscope Leica MZ4. Scanning electron microscopy (SEM) was applied to support the chemical characterisation. Details of the mineral have been published (page 344 (maxwellite) and p589 (tilasite), vol. IV)[13].
Raman spectroscopy
Crystals of maxwellite or tilasite were placed on a polished me-tal surface on the stage of an Olympus BHSM microscope, which is equipped with 10, 20, and 50 objectives. The microscope is part of a Renishaw 1000 Raman microscope system, which also in-cludes a monochromator, a filter system and a CCD detector (1024 pixels). The Raman spectra were excited by a Spectra-Physics mod-el 127 He–Ne laser producing highly polarised light at 633 nm and collected at a nominal resolution of 2 cm 1 and a precision of ±1 cm 1in the range between 100 and 4000 cm 1. Repeated acqui-sition on the crystals using the highest magnification (50) was accumulated to improve the signal to noise ratio in the spectra. Spectra were calibrated using the 520.5 cm 1 line of a silicon wafer.
Infrared spectroscopy
Infrared spectra were obtained using a Nicolet Nexus 870 FTIR spectrometer with a smart endurance single bounce diamond
ATR cell. Spectra over the 4000–525 cm 1 range were obtained by the co-addition of 128 scans with a resolution of 4 cm 1and a mirror velocity of 0.6329 cm/s. Spectra were co-added to improve the signal to noise ratio.
Band component analysis was undertaken using the Jandel ‘Peakfit’ (Erkrath, Germany) software package which enabled the type of fitting function to be selected and allowed specific param-eters to be fixed or varied accordingly. Band fitting was done using a Lorentz–Gauss cross-product function with the minimum num-ber of component bands used for the fitting process. The Lorentz–Gauss ratio was maintained at values greater than 0.7 and fitting was undertaken until reproducible results were obtained with squared correlations (r2) greater than 0.995. Band fitting of the spectra is quite reliable providing there is some band separation or changes in the spectral profile.
Results and discussion
Chemistry
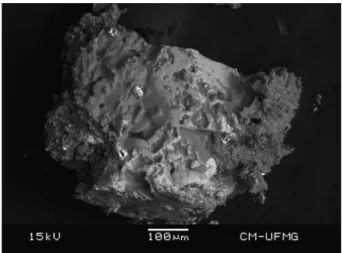
The maxwellite sample was characterised by SEM/EDS. The backscattering image shows a homogeneous phase (Fig. 1). Chem-ical data is presented inFig. 2 and shows a simple composition dominated by Fe, As, Na. Minor amounts of Mn, Ti are also ob-served. The presence of C is due to the carbon coating.
Arsenate vibrations
According to Myneni et al.[14,15]and Nakamoto[16], (AsO4)3 is a tetrahedral unit, which exhibits four fundamental vibrations: namely the Raman active
m
1 symmetric stretching vibration (A1) at around 818 cm 1; the Raman active doubly degeneratem
2 sym-metric bending vibration (E) at 350 cm 1, the infrared and Raman active triply degenerate
m
3antisymmetric stretching vibration (F2) at 786 cm 1, and the infrared and Raman active triply degeneratem
4bending vibration (F2) at 405 cm 1. Protonation, metal complex-ation, and/or adsorption on a mineral surface will cause the change in (AsO4)3 symmetry fromTdto lower symmetries, such as C3v, C2v
or even C1. This loss of degeneracy causes splitting of degenerate vibrations of (AsO4)3 and the shifting of the As-OH stretching vibrations to different wavenumbers.
Such chemical interactions reduce (AsO4)3 tetrahedral symme-try, as mentioned above, to either C3v/C3(corner-sharing), C2v/C2 (edge-sharing, bidentate binuclear), or C1/Cs (corner-sharing,
edge-sharing, bidentate binuclear, multidentate)[14,15]. In associ-ation with (AsO4)3 symmetry and coordination changes, the
A1 band may shift to different wavenumbers and the doubly degener-ateEand triply degenerateFmodes may give rise to several new A1,B1, and/orE vibrations [14,15]. In the absence of symmetry deviations, (AsO3OH)2 in C3vsymmetry exhibit the
m
sAs-OH and
m
asandm
s(AsO3OH)2 vibrations together with corresponding thedAs-OH in-plane bending vibration,dAs-OH out-of-plane bending vibration,
m
s(AsO3OH)2 stretching vibration anddas(AsO3OH)2 bending vibration [17–19]. Keller [17] observed the following infrared bands in Na2(AsO3OH)7H2O 450 and assigned bands at 360 cm 1 todas(
m
4) (AsO3OH)2 bend (E), 580 cm 1to thed As-OH out-of-plane bend, 715 cm 1 to them
As-OH stretch (A1), 830 cm 1to them
as(AsO3OH)2 stretch (E), and 1165 cm 1to the d As-OH in plane bend. In the Raman spectrum of Na2(AsO3-OH)7H2O, Vansant and Veken [18] attributed Raman bands to the following vibrations 55, 94, 116 and 155 cm 1to lattice modes, 210 cm 1to
m
(OH. . .O) stretch, 315 cm
1to (AsO3OH)2 rocking,
338 cm 1to thed
s(AsO3)2 bend, 381 cm 1to thedas(AsO3OH)2 -bend, 737 cm 1to the
m
sAs-OH stretch (A1), 866 cm 1to the
m
as (AsO3OH)2 stretch (E).Raman spectroscopy
The Raman spectra of maxwellite and tilasite over the 100– 4000 cm 1 spectral range are displayed inFig. 3a and b respec-tively. These spectra show the position and relative intensities of the Raman bands. It is obvious that there are large parts of the spectra where no intensity is observed and so the spectra are sub-divided into sections based upon the type of molecular vibration being studied.
The infrared spectra of these two minerals are given in the sup-plementary information. The infrared spectra of maxwellite and tilasite over the 500–4000 cm 1 spectral range are reported in Fig. S1a and b respectively. These spectra show the positions of the infrared peaks and the relative intensities of these peaks. The infrared spectra of maxwellite over the 650–1200 cm 1 spectral range and of tilasite over the 650–950 cm 1spectral range are re-ported in Fig. S2a and b respectively. These spectra are plotted over different spectral ranges because in the first spectrum (maxwel-lite), there are a series of peaks which are not observed in the spec-trum of tilasite. These additional peaks are attributable to phosphate vibrations, showing that there is some isomorphous substitution of arsenate by phosphate in the structure of maxwellite.
Fig. 2.EDS spectrum of maxwellite.
Fig. 3.(a) Raman spectrum of maxwellite in the 4000–100 cm 1region (b) (a)
Raman spectrum of tilasite in the 4000–100 cm1region.
Fig. 4.(a) Raman spectrum of maxwellite in the 650–1050 cm 1region (b) Raman
The Raman spectrum of maxwellite over the 650–1050 cm 1 spectral range is provided inFig. 4a. Whereas the Raman spectrum of tilasite over the 750–950 cm 1 spectral range is illustrated in
Fig. 4b. The Raman spectrum of maxwellite in this part of the trum appears more complex than that for tilasite. The Raman spec-trum of tilasite is characterised by sharp bands. The two highest intensity bands are observed at 851 and 831 cm 1and are assigned to the Raman active
m
1symmetric stretching vibration (A1) and the Raman active triply degeneratem
3antisymmetric stretching vibra-tion (F2). A shoulder band at 820 cm 1is probably also due to this vibrational mode. In mineral chemistry the size of F ion is almost identical t that of the OH ion. Hence, the F anion may simply replace the OH anion. In the absence of symmetry deviations, (AsO3OH)2 in C3vsymmetry exhibit them
sAs-OH and
m
asandm
s (AsO3OH)2 vibrations together with corresponding thed As-OH in-plane bending vibration,dAs-OH out-of-plane bending vibra-tion,m
s(AsO3OH)2 stretching vibration anddas(AsO3OH)2 bend-ing vibration [17–19]. Thus, it is proposed that the band at 876 cm 1 and the 859 cm 1 band is ascribed to the
m
s and
m
as (AsO3F)2 vibrations. The assignment of the Raman bands for maxwellite in this spectral region is complicated by the presence of phosphate in the structure as is evidenced by the infrared spec-trum (Fig. S2a). The Raman band of maxwellite at 871 cm 1is as-signed to them
1 symmetric stretching vibration and the Raman band at 812 cm 1 is assigned to them
3antisymmetric stretching vibration. It is thought that the Raman bands at 894 and 849 cm 1 are due to the to the
m
sand
m
as (AsO3F)2 vibrations. The Raman bands at 914 and 954 cm 1 are due to phosphate vibrations.In the Raman spectrum of maxwellite downloaded from the RRUFF data base, two intense sharp peaks are observed at 866 and 794 cm 1and are assigned to the symmetric and antisymmet-ric stretching vibrations of the AsO3
4 units. Two broad bands are found at 630 and 650 cm 1. It is not known to what these bands may be assigned. In the Raman spectrum of tilasite downloaded from the RRUFF data base, a very intense sharp band at 850 cm 1 is observed with two shoulder bands of much lower intensity at 828 and 874 cm 1. The position of the Raman bands for tilasite from the RRUFF data base is in good agreement with the Raman spectrum of tilasite reported in this work. Some variation in inten-sity is found between the two Raman spectra of tilasite but this may be simply due to orientation effects.
In the infrared spectrum of maxwellite and tilasite, the infrared bands overlap but nevertheless band component analysis does en-able the component bands to be resolved. The infrared spectrum of maxwellite over the 650–1200 cm 1 spectral range is shown in Fig. S2a. The infrared spectrum of tilasite over the 650– 1200 cm 1spectral range is shown in Fig. S2b. The broad infrared spectral profile of maxwellite between 650 and 950 cm 1 are attributed to AsO3
4 stretching vibrations. The broad infrared pro-file between 950 and 1150 cm 1are due to phosphate bands. Band separation is slightly better for tilasite. The infrared bands between 650 and 950 cm 1are attributed to arsenate stretching vibrations. The complexity of the Raman spectra of maxwellite is reflected in the 400–600 cm 1spectral region (Fig. 5a). Here we observed four peaks at 455, 487, 523 and 542 cm 1. These bands are broad and reflect the complexity of the phosphate units in the maxwellite structure. In some ways the RRUFF spectrum resembles this spec-trum (Fig. 5a). The RRUFF spectrum shows a band at 526 cm 1with another band at around 489 cm 1. This latter band is assigned to the Raman active triply degenerate
m
4bending vibration (F2).The Raman spectrum of tilasite in the 300–550 cm 1 spectral region is shown inFig. 5b. The intense Raman band of tilasite at 467 cm 1 is assigned to the Raman active triply degenerate
m
4 bending vibration (F2). The other low intensity Raman bands at 438, 450, 494 and 501 cm 1 of tilasite are probably due to this
vibration and simply served to show there is a reduction of sym-metry of the arsenate anion in the tilasite structure. The intense Raman band at 331 cm 1for tilasite is assigned to the Raman ac-tive doubly degenerate
m
2symmetric bending vibration (E). The two other Raman bands at 365 and 393 cm 1are also attributed to this vibration. The Raman spectrum of tilasite downloaded from the RRUFF data base shows Raman bands at 327, 360, 380, 463 and 501 cm 1. The position of these bands is in reasonable agreement with the position of the bands reported here. As would be expected the position of the Raman bands in this spectral region will be a function of the chemical composition which in turn is a function of the origin of the sample.The Raman spectrum of maxwellite in the 100–400 cm 1 spec-tral region is illustrated inFig. 6a and the Raman spectrum of tila-site in the 100–300 cm 1spectral region is illustrated inFig. 6b. Intense Raman bands for maxwellite are observed at 309 and 327 cm 1with shoulder bands at 291, 346, 360 and 373 cm 1. It is thought that these bands are due to metal oxygen stretching vibrations. Other bands for maxwellite at 111, 140, 154 and 164 cm 1 are noted and are described as lattice vibrations. The intensity of these lattice bands for tilasite show much greater intensity. Raman bands are noted at 111, 139, 149 and 160 cm 1. The spectrum of maxwellite and tilasite are very similar in this part of the spectrum.
It should be noted that formula of the minerals, maxwellite, til-asite and durangite show the absence of water and OH units. This is also observed by the lack of signal in the Raman spectrum of maxwellite and tilasite (seeFig. 3a and b). It is obvious that no intensity exists in the OH stretching region. In the infrared spec-trum of maxwellite no intensity in the OH stretching region was found. However very weak infrared bands for tilasite were observed at 3196 and 3437 cm 1and were assigned to adsorbed water.
Fig. 5.(a) Raman spectrum of maxwellite in the 400–600 cm 1region (b) Raman
Conclusions
We have used a combination of scanning electron microscopy with EDX and both Raman and infrared spectroscopy to study
the chemistry and molecular structure of the mineral maxwellite NaFe3+(AsO4)F. A comparison is made with the spectroscopy of til-asite CaMg(AsO4)F. SEM identifies a single phase. Chemical analy-sis shows that maxwellite is composed of Fe, Na and Ca with minor amounts of Mn and Al. The molecular structure of maxwellite and tilasite were analysed by Raman and infrared spectroscopy. Raman bands are assigned to the AsO3
4 stretching and bending vibrations. No bands attributable to water or hydroxyl stretching vibrations were observed.
Appendix A. Supplementary material
Supplementary data associated with this article can be found, in the online version, athttp://dx.doi.org/10.1016/j.saa.2013.12.081.
References
[1]E.E. Foord, P.F. Hlava, J.J. Fitzpatrick, R.C. Erd, R.W. Hinton, Neues Jb. Miner. Mh. (1991) 363–384.
[2]F.J. Parker, T.A. Peters, Miner. Rec. 9 (1978) 385–386.
[3]S.A.H. Sjogren, Geol. Foren. i Stockholm Forh. 17 (1895) 291–294.
[4]E.E. Foord, M.R. Oakman, C.H. Maxwell, Can. Miner. 23 (1985) 241–246.
[5]S.I. Lahti, A. Pajunen, Am. Miner. 70 (1985) 849–855.
[6]F. Machatschki, Zeit. fuer Krist. 103 (1941) 221–227.
[7]G.J. Brush, Am. J. (1901) Sc. xi 464–465.
[8]M.A. Cooper, F.C. Hawthorne, Neues Jb. Miner. Mh. (1995) 97–104.
[9]M. Reynaud, P. Barpanda, G. Rousse, J.-N. Chotard, B.C. Melot, N. Recham, J.-M.
Tarascon, Solid State Sc. 14 (2012) 15–20.
[10]K.W. Bladh, R.K. Corbett, W.J. McLean, R.B. Laughon, Am. Miner. 57 (1972)
1880–1884.
[11]P. Kokkoros, Naturwissenschaften 25 (1937) 717.
[12]P. Kokkoros, Zeit. fuer Krist. 99 (1938) 39–49.
[13]J.W. Anthony, R.A. bideaux, K.W. Bladh, M.C. Nichols, Silica, Silicates, Mineral
data Publishing, Tucson, Arizona, 1995.
[14]S.C.B. Myneni, S.J. Traina, G.A. Waychunas, T.J. Logan, Geochim. Cosmochim.
Acta 62 (1998) 3285–3300.
[15]S.C.B. Myneni, S.J. Traina, G.A. Waychunas, T.J. Logan, Geochim. Cosmochim.
Acta 62 (1998) 3499–3514.
[16]K. Nakamoto, Infrared and Raman Spectra of Inorganic and Coordination
Compounds., Wiley, New York, 1986.
[17]P. Keller, Neues Jb. Miner. Mh. (1971) 491–510.
[18]F.K. Vansant, B.J.V.D. Veken, J. Mol. Struct. 15 (1973) 439–444.
[19]F.K. Vansant, B.J.V.D. Veken, H.O. Desseyn, J. Mol. Struct. (1973) 425–437.
Fig. 6.(a) Raman spectrum of maxwellite in the 100–400 cm 1region (b) Raman