INTRODUCTION
Stoichiometric mullite (3Al2O3.2SiO2, known as mullite 3:2) is an important refractory material that has been synthesized by solid-state reaction (reactive sintering) of synthetic or natural raw materials such as aluminum isopropoxide, kaolin, alumina, silica, rice husk ash, and
fly ash [1, 2]. Such a mullitization reaction is a thermally
activated process taking place through cationic (Al3+ and Si2+) diffusion at temperatures higher than 1300 °C [3-8]. As an alternative raw material, kaolin waste derived from kaolin mining processes can also be used to obtain mullite-based ceramics by reactive sintering [9-13]. Apart from conventional uses in the refractory industry, mullite and
mullite-based ceramic composites have gained interest in the electronics industry as materials for high-frequency circuit packaging and electronic substrate application due to their low values of dielectric constant and dielectric loss [14, 15]. We have already reported the preparation of almost
pure mullite as a crystalline material by firing a mixture of
kaolinite clay and 25 wt% mica-rich kaolin waste at 1300-1500 °C [16, 17]. Following our own experience with these
materials, we selected a kaolin waste processed ceramic fired
at 1400 °C to evaluate its dielectric and electrical properties aiming to attain a potential low-cost material for electronics-related applications. A detailed impedance spectroscopy analysis allowed to determine the electrical conductivity, activation energy for the electrical conduction, capacitance, dielectric constant, and dielectric loss of the mullite/glass composite as a function of the frequency (20 Hz, 1 MHz) and measured temperature (25-600 °C) in air.
Dielectric and electrical properties of a mullite/glass composite from a
kaolinite clay/mica-rich kaolin waste mixture
(Propriedades dielétricas e elétricas de compósito mulita/fase vítrea obtido
a partir de uma mistura argila caulinítica/resíduo de caulim)
J. P. F. Grilo1, H. P. A. Alves2, A. J. M. Araújo2, R. M. Andrade3, R. P. S. Dutra3, D. A. Macedo3*
1University of Aveiro, Department of Materials and Ceramic Engineering, Aveiro, Portugal 2Federal University of Rio Grande do Norte, Materials Science and Engineering Graduate Program,
Natal, Brazil
3Federal University of Paraíba, Materials Science and Engineering Graduate Program, João Pessoa, Brazil
https://orcid.org/0000-0003-0466-1458
Abstract
A mullite/glass composite has been prepared by reactive sintering of a kaolinite clay/mica-rich kaolin waste mixture with 25 wt%
waste. Phase composition, microstructure, dielectric and electrical properties of the composite fired at 1400 °C were evaluated by X-ray diffraction, scanning electron microscopy and impedance spectroscopy (between 25 and 600 °C in air). The microstructural
characterization showed the attainment of dense samples composed of acicular (orthorhombic) mullite (47.6 wt%), glassy phase (50.1 wt%), and residual quartz (2.3 wt%). Electrical conductivity (1.9x10⁻⁸ S/cm at 300 °C), dielectric constant (6.7 at 1 MHz,
25 °C) and dielectric loss (0.024 at 1 MHz, 25 °C) results gave evidence that the mullite/glass composite is a promising low-cost material for commercial use in electronics-related applications.
Keywords: solid-state reaction, sintering, mullite, kaolin waste, dielectric and electrical properties.
Resumo
Um compósito mulita/fase vítrea foi preparado por sinterização reativa de uma mistura argila caulinítica/resíduo de caulim rico em mica com 25% em massa de resíduo. A composição de fase, microestrutura, propriedades dielétricas e elétricas do compó
-sito sinterizado a 1400 °C foram avaliadas por difração de raios X, microscopia eletrônica de varredura e espectroscopia de impedância (entre 25 e 600 °C em ar). A caracterização microestrutural mostrou a obtenção de amostras densas compostas de mulita acicular (ortorrômbica, 47,6% em massa), fase vítrea (50,1% em massa) e quartzo residual (2,3% em massa). Os resul
-tados de condutividade elétrica (1,9.10-8 S/cm a 300 °C), constante dielétrica (6,7 a 1 MHz, 25 °C) e perda dielétrica (0,024 a 1 MHz, 25 °C) evidenciaram que o compósito mulita/fase vítrea é um material de baixo custo promissor para uso comercial em aplicações relacionadas à eletrônica.
MATERIALS AND METHODS
A ceramic formulation containing a kaolinite clay and kaolin waste (25 wt% waste) was used to obtain a mullite/glass composite by solid-state reactive sintering. Mineralogical characterization of the raw materials (both from State of Paraíba, Brazil) is given elsewhere
[16]. X-ray fluorescence spectroscopy (Shimadzu,
EDX-700) was used to determine the chemical composition. Despite their similar contents of Al2O3 (33 and 36 wt%, respectively) and SiO2 (46 and 52 wt%, respectively), kaolin waste presented higher K2O content (4.8 versus 0.5 wt%). The total Fe2O3 content was 0.64 wt%. The powder mixture was prepared by wet milling in a planetary ball mill for 5 h, using a weight ratio of powder to alumina balls of 1:3. The suspension was dried at 60 °C for 24 h and the resulting powder sieved (100 mesh). Cylindrical pellets (10x1.5 mm) were shaped by uniaxial pressing at
40 MPa and subsequently fired at 1400 °C for 3 h in air
using a heating rate of 3 °C/min.
X-ray diffraction (Shimadzu, XRD 7000, using CuKα
radiation, 30 mA and 40 kV) was used to analyze the phase composition and content in the composite. The diffraction
pattern, obtained within the angular range of 10-80º (2θ)
in step-scanning mode (0.02 º/step, 2 s/step), was analyzed
by Rietveld refinement method using Materials Analysis
Using Diffraction (MAUD) program. The protocol used to estimate amorphous phase content can be found in a previous work [17]. Microstructural characterization
of the fired sample was assessed using a field-emission
gun scanning electron microscopy (FESEM, Carl Zeiss, Supra 35-VP). Apparent density was determined by the Archimedes method. Dielectric and electrical properties were studied by impedance spectroscopy in air. Impedance spectra were acquired at 25 °C and from 300 to 600 °C under open circuit conditions using a Hewlett
Packard 4284A LCR meter in a two-probe configuration
(frequencies ranging from 20 Hz to 1 MHz with a test signal amplitude of 0.5 V). Au electrodes were painted on the parallel faces of the sample and thermally treated at
700 °C for 15 min. Electrical conductivity (σ), capacitance (C), dielectric constant (εr), and dielectric loss (tanδ) were determined using the following equations:
r = d
AR (A)
ZC = -i
(2pfc) (B)
er = Cd Ae0
(C)
tand = , e =ee r
d (2pf)Ae0
Z
(Z2 + Z"2) (D)
where, d and A are the thickness and cross-section area of the ceramic pellet, respectively, R is the total ohmic
resistance of the pellet obtained from the impedance spectra by assuming the intercept of the real axis (Z) at low frequency, f is the frequency in Hz, C is the
capacitance of the material measured in pF, εr and ε0 (8.85x10⁻¹² F/m) are the dielectric constant and dielectric permittivity in vacuum, respectively [18, 19], Z and Z” are the real and imaginary parts of impedance, respectively. The frequency-dependent capacitance was estimated using the equation for the impedance of a capacitor (Eq. B), considering Zc=Z” [20]. The activation energy for the electrical conduction (Ea) was directly estimated from
the conductivity values (σ) according to the following
Arrhenius law:
sT = s0exp Ea
kT (E)
where s0 is a pre-exponential factor, T is the absolute temperature and k is the Boltzmann constant.
RESULTS AND DISCUSSION
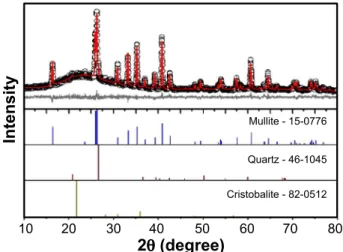
The kaolinite clay/mica-rich kaolin waste mixture (25 wt% waste) fired at 1400 °C was analyzed by X-ray powder diffraction with Rietveld refinement analysis of the XRD data. Refined (experimental, calculated and difference) patterns for the powder are shown in Fig. 1. The obtained low χ2 value of 1.07 (R
wp=7.56%, Rexp=7.07%) indicated
the good quality of the fit. The powder consisted of a mixture of two crystalline phases: mullite (JCPDS 15-0776) and quartz (hexagonal silica, JCPDS 46-1045). The two reflections of mullite in 2θ ~26° are classically attributed to the presence of orthorhombic mullite (also known as secondary mullite, the mullite formed from the amorphous aluminosilicate phase) [21]. Cristobalite beta (tetragonal silica, JCPDS 89-3435), commonly expected at 2θ ~22° in kaolin processed ceramics, was not identified within the detection limit of the XRD technique. The formation of an additional glassy phase (amorphous phase, herein assigned as cristobalite phase, JCPDS 82-0512) was observed by the occurrence of a large band in the region between 15-30° 2θ, expected for metakaolin-derived mullite [22]. Quantitative Rietveld phase analysis indicated the crystalline fraction of the mullite/glass composite was composed of 47.6 wt% mullite and residual quartz (2.3 wt%). The large amount of glassy phase (50.1 wt%) was a result of a peritectic liquid formed above 1140 °C (according to the SiO2-Al2O3-K2O equilibrium
phase diagram [23]). This liquid phase was expected in the present work since the K2O amount was increased
by using 25 wt% of kaolin waste containing 40.5 wt% mica, which resulted in a ceramic formulation with a total mica content of 13.3 wt% [17]. It has been reported that K2O facilities the dissolution of silica and spinel
dense (2.99 g/cm3 apparent density versus 3.17 g/cm3 from
pure orthorhombic mullite) microstructure consisting of acicular (orthorhombic) mullite grains surrounded by the glassy phase, as shown in Fig. 2.
Impedance spectroscopy was used to study the dielectric and electrical properties of the fired material. Fig. 3 shows impedance spectra obtained in air from 350 to 600 °C, corrected using the shape factor of the pellet (cross-section area divided by thickness). The Nyquist plots show one single-arc (slightly depressed) response usually observed for materials consisting of crystalline (mullite or cordierite) and glassy phases, an electrical behavior ascribed to the dominant contribution of intragranular phenomena [26, 27]. As expected, resistivity tends to decrease with increasing measuring temperature. The absence of a second impedance arc reflecting the contribution of grain boundaries and other blocking mechanisms such as pores is consistent with the microstructure (mullite grains embedded into a glassy phase) and density of the herein
studied mullite/glass composite. It is worth to remind that in this kind of composite the mullite phase is expectably more resistive than the glass [26]. In this regard, easy pathways for charge transport are expected with a microstructure in which mullite grains are completed surrounded by the glassy material without direct contacts between them. The Arrhenius plot for the total electrical conductivity, obtained from the low-frequency intercept of the impedance spectra with the real axis, is shown in Fig. 4. A typical conductivity value of 1.9x10⁻⁸ S/cm was
found at 300 °C. The calculated activation energy (Ea=1.2 eV) is typical of mullite-based materials [26, 28].
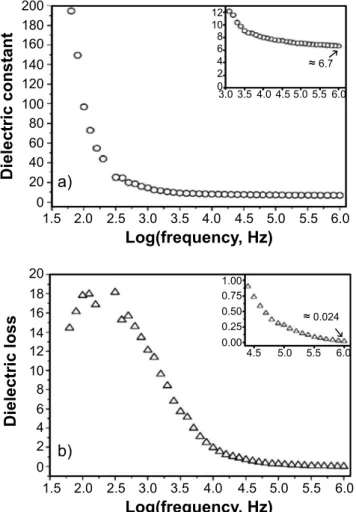
Typical capacitance values of 47 pF at 60 Hz and 1.6 pF at 1 MHz, estimated from the impedance of a capacitor (Eq. B), were used to calculate the room temperature (25 ºC) dielectric constant and dielectric loss as a function of the frequency, shown in Fig. 5. The dielectric properties were measured only at 25 °C to avoid the stray capacitance from long Au wires used to measure impedance as a function of the temperature. Dielectric constant decreased with an increase in frequency and attained 6.7 at 1 MHz (Fig. 5a).
Figure 2: SEM micrograph of the kaolinite clay/kaolin waste mixture fired at 1400 °C (m: mullite, g: glassy phase).
[Figura 2: Micrografia da mistura argila caulinítica/resíduo de caulim sinterizada a 1400 °C (m: mulita, g: fase vítrea).]
Figure 3: Impedance spectra measured from 350 to 600 °C in air.
[Figura 3: Espectros de impedância medidos de 350 a 600 °C em ar.] 0
0
6 6
12 3
3
9 9
1 1
7 7
13 4
4
10 10
2 2
8 8
14 5
5
11 11
Z'(MW.cm)
Figure 4: Arrhenius plot for the electrical conductivity.
[Figura 4: Gráfico de Arrhenius para a condutividade elétrica.] -9
-11 -6
1.1 1.2 1.3 1.4 1.5 1.6 1.7 1.8
-12 -8 -5
-7
-10 -4
1000/T (K-1)
Ln(σT
, S.K.cm
-1) Figure 1: Rietveld refinement analysis of the kaolinite clay/kaolin waste mixture fired at 1400 °C.
[Figura 1: Análise de refinamento de Rietveld da mistura argila caulinítica/resíduo de caulim sinterizada a 1400 °C.]
10
2q (degree)
Intensity
30 60
20 40 50 70 80
Mullite - 15-0776
Quartz - 46-1045
Cristobalite - 82-0512
350 ºC 400 ºC 450 ºC 500 ºC 550 ºC 600 ºC
0.4 0.3 0.2 0.1 0.0
0.0 0.2 0.4 0.6
It was expected since at lower frequencies the dielectric pattern may be attributed to different types of polarization (ionic, electronic, atomic, interfacial, etc.), while at higher frequencies it only arises due to the contribution from electronic polarization [29, 30]. The measured dielectric constant at 1 MHz agreed with previous results for mullite-based ceramics [14, 15]. The energy dissipation in the dielectric system, which is well-known as dielectric
loss (tanδ), also decreased with increasing frequency (Fig.
5b). The value of 0.024 found at 1 MHz was considered to
be good for electronics-related applications (tanδ<0.04)
[15]. A further investigation on the electrical and dielectric properties of mullite-based ceramics as a function of the kaolin waste content (from 0 to 100 wt%) is the topic of forthcoming work.
CONCLUSIONS
This work reported the dielectric and electrical properties of a low-cost mullite/glass composite obtained by reactive sintering of a formulation containing kaolinite
clay and 25 wt% mica-rich kaolin waste. Impedance spectroscopy and SEM analyses showed an electrical behavior consistent with a dense microstructure consisting of mullite grains embedded into a glassy phase. Dielectric and electrical properties (conductivity of 1.9x10⁻⁸ S/cm at 300 °C, a dielectric constant of 6.7 at 1 MHz and dielectric loss of 0.024 at 1 MHz, both at 25 °C) for the herein studied mullite/glass composite make it a promising material for electronics-related applications.
ACKNOWLEDGEMENTS
The authors acknowledge CNPq and CAPES (Brazil)
for the financial support. Hugo P.A. Alves, Allan J.M.
Araújo and Rivaildo M. Andrade thank CAPES for the M.Sc. Grants.
REFERENCES
[1] C. Sadik, I.E. El Amrani, A. Albizane, J. Asian Ceram. Soc. 2 (2014) 310.
[2] M.F. Serra, M.S. Conconi, M.R. Gauna, G. Suárez, E.F. Aglietti, N.M. Rendtorff, J. Asian Ceram. Soc. 4 (2016) 61.
[3] H. Schneider, J. Schreuer, B. Hildmann, J. Eur. Ceram. Soc. 28 (2008) 329.
[4] K.C. Liu, G. Thomas, A. Caballero, J.S. Moya, S. De Aza, Acta Metall. Mater. 42 (1994) 489.
[5] C.Y. Chen, G.S. Lan, W.H. Tuan, J. Eur. Ceram. Soc. 20 (2000) 2519.
[6] A.E. Souza, S.R. Teixeira, G.T.A. Santos, E. Longo, Cerâmica 59 (2013) 147.
[7] İ.A. Aksaf, J.A. Pask, J. Am. Ceram. Soc. 58 (1975) 507.
[8] Y. Li, J. Feng, Y. Wang, X. Cheng, Int. J. Appl. Ceram.
Technol. 12 (2015) E132.
[9] R.R. Menezes, M.F. Oliveira, L.N.L. Santana, G.A. Neves, H.C. Ferreira, Cerâmica 53 (2007) 388.
[10] R.R. Menezes, F. Farias, M.F. Oliveira, L.N.L. Santana, G.A. Neves, H.L. Lira, H.C. Ferreira, Waste Manag. Res. 27 (2009) 78.
[11] R.R. Menezes, M.I. Brasileiro, W.P. Gonçalves, L.N.D.L. Santana, G.A. Neves, H.S. Ferreira, H.C. Ferreira, Mater. Res. 12 (2009) 201.
[12] M.I. Brasileiro, D.H.S. Oliveira, H.L. Lira, L.N.L. Santana, G.A. Neves, A.P. Novaes, J.M. Sasaki, Mater. Sci. Forum 530-531 (2006) 625.
[13] M.I. Brasileiro, R.R. Menezes, M.O. Farias, H.L. Lira, G.A. Neves, L.N.L. Santana, Mater. Sci. Forum 591-593 (2008) 799.
[14] D. Roy, B. Bagchi, S. Das, P. Nandy, Mater. Chem. Phys. 138 (2013) 375.
[15] L. Zhang, S. Olhero, J.M.F. Ferreira, Ceram. Int. 42 (2016) 16897.
[16] H.P.A. Alves, J.B. Silva, L.F.A. Campos, S.M. Torres, R.P.S. Dutra, D.A. Macedo, Ceram. Int. 42 (2016) 19086. [17] H.P.A. Alves, R.A. Junior, L.F.A. Campos, R.P.S. Figure 5: Dielectric constant (a) and dielectric loss (b) as
a function of the frequency.
[Figura 5: Constante dielétrica (a) e perda dielétrica (b) em função da frequência.]
1.5
Log(frequency, Hz)
Dielectric constant
3.5
2.5 4.5 5.5
2.0 3.0 4.0 5.0 6.0
200 180 160 140 120 100 80 60 40 20 0
1.5
Log(frequency, Hz)
Dielectric loss
3.5
2.5 4.5 5.5
2.0 3.0 4.0 5.0 6.0
20 18 16 14 12 10 8 6 4 2 0
b) a)
12
8
4
0 10
6
2
3.0 5.0
5.0
4.0 6.0
6.0
3.5 5.5
5.5 4.5
4.5 1.00 0.75 0.50 0.25 0.00
≈6.7
≈0.024
g
Dutra, J.P.F. Grilo, F.J.A. Loureiro, D.A. Macedo, Ceram. Int. 43 (2017) 3919.
[18] D.R. Patil, S.A. Lokare, R.S. Devan, S.S. Chougule, C.M. Kanamadi, Y.D. Kolekar, B.K. Chougule, Mater. Chem. Phys. 104 (2007) 254.
[19] A. See, J. Hassan, M. Hashim, W.M.D. Wan Yusoff, Solid State Sci. Technol. 16 (2008) 197.
[20] E. Barsoukov, J.R. Macdonald, Impedance
spectroscopy: theory, experiment, and applications, 2nd ed., John Wiley & Sons (2005).
[21] L.S. Cividanes, T.M.B. Campos, L.A. Rodrigues, D.D. Brunelli, G.P. Thim, J. Sol-Gel Sci. Technol. 55 (2010) 111.
[22] I. Khorchani, O. Hafef, J.J. Reinosa, A. Matoussi, J.F. Fernandez, Mater. Chem. Phys. 212 (2018) 187.
[23] E.F. Osborn, Phase equilibrium diagrams of oxide systems, Am. Ceram. Soc., USA (1960).
[24] J.R. Martínez, E. Espericueta, A.L. Guerrero-Serrano, G. Ortega-Zarzosa, J. Sol-Gel Sci. Technol. 64 (2012) 661. [25] Z.M. Shi, J. Am. Ceram. Soc. 88 (2005) 1297. [26] M.J. Ribeiro, J.C.C. Abrantes, J.M. Ferreira, J.A. Labrincha, J. Eur. Ceram. Soc. 24 (2004) 3841.
[27] J.A. Labrincha, C.M. Albuquerque, J.M. Ferreira, M.J. Ribeiro, J. Eur. Ceram. Soc. 26 (2006) 825.
[28] S.P. Chaudhuri, S.K. Patra, A.K. Chakraborty, J. Eur. Ceram. Soc. 19 (1999) 2941.
[29] R.R. Heikes, W.D. Johnston, J. Chem. Phys. 26 (1957) 582.
[30] S.F. Mansour, Egypt. J. Solids 28 (2005) 263.