Engineering
ISSN: 1809-4430 (on-line)
_________________________
1Universidade Federal Rural do Rio de Janeiro/ Seropédica - RJ, Brasil.
EVOLUTION OF CERRADO VEGETAL COVER ON A RIVER ISLAND BASED ON ORBITAL IMAGING DATA
Doi:http://dx.doi.org/10.1590/1809-4430-Eng.Agric.v36n6p1186-1197/2016
DANIEL C. DE CARVALHO1, MAYARA M. DE L. PESSOA1, MARCOS G. PEREIRA2*,
RAFAEL C. DELGADO1
2*Corresponding author. Universidade Federal Rural do Rio de Janeiro/ Rio de Janeiro - RJ, Brasil. E-mail: [email protected]
ABSTRACT: This study aimed to assess vegetal cover evolution on a river island within the Ecological Station of (EEP), by remote sensing. For this purpose, Normalized Difference Vegetation Indexes were generated for Landsat 1 (1973) and Landsat 5 (1984, 1990, 2000 and 2011) images. Five landscape units were identified in the field: bare soil, Rough savanna, Typical savanna, Forested savanna and Evergreen dry woods. Only Forested savanna and Evergreen dry woods showed poor spectral splitting, being thus considered as a forestry complex. Changes throughout time have occurred in all units, with decreasing in bare soil areas (-2.56 ha year-1), Rough savanna (-0.66 ha year-1) and Typical savanna (-0.94 ha year-1) and with an increase in the Forested savanna (5.97 ha year-1). Thus, the method used in this study was effective for sorting and assessing plant cover of the landscape units studied over time.
KEY WORDS: remote sensing, environmental monitoring, vegetation index.
INTRODUCTION
Human actions generally promote changes to the environment and lately, have led to different impacts on ecosystems, mainly forests, influencing climate changes, as well as energy and mass exchanges between soil and atmosphere (ACHARD et al., 2014; PETTORELLI et al., 2014; VIEIRA et al., 2013; SILVA et al., 2013; TOWNSHEND et al., 2012; EVA et al., 2012). Awareness of these changes is growing and, therefore, a series of studies have been designed to detect and quantify their extent (ten CATEN et al., 2015; GRECCHI et al., 2014; ROCHA et al., 2011). Currently, geo-technological systems and products are indispensable tools for spatial and temporal detection, evaluation and monitoring of problems related to the environment (GÓMEZ et al., 2016; ANDREW et al., 2014; BODART et al., 2013; BODART et al., 2011). This is due to distinct data integration and overlapping at varied scales by geographic information systems (GISs), facilitating decision-making and shifts, if necessary, on land use and occupation policies
(BEUCHLE et al., 2015; ten CATEN et al., 2015; MÜLLER et al., 2015; COELHO et al., 2014;
GIRI et al., 2013; POTAPOV et al., 2011; DURIGAN & RATTER, 2006).
Among the geo-technologies used for identification and evaluation of changes in structure, physiognomy and dynamics of vegetal coverage across different dates, it is noteworthy mention spectral change detection by vegetation indices (JUNGES et al., 2013; SEXTON et al., 2013; DALPOSSO et al., 2013; HILL et al., 2012). Normalized Difference Vegetation Index (NDVI) is one of the vegetation indices most used in studies of plant coverage, since it allows evaluating vegetation conditions and respective spatiotemporal changes (SOUTHWORT et al., 2013; GIRI et al., 2013; TOWNSHEND et al., 2012). From NDVI values, regional classification of vegetation and landscape is facilitated, including Brazilian savannas (Cerrado) (CARVALHO JÚNIOR et al., 2008; LIESENBERG et al., 2007; FERREIRA & HUETE, 2004; FERREIRA et al., 2004).
forest-sized plants that, over the years, has colonized locations where it had not been observed before.
Thus, our research was based on the assumption that, after the filling of Três Marias dam, there were several significant changes in the local landscape of the reserve. Therefore, this study aimed to divide the land cover into classes and evaluate the spatial-temporal dynamics (from 1973 to 2011) with the aid of NDVI.
MATERIAL AND METHODS
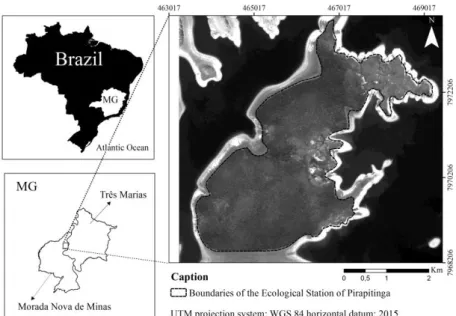
The study was developed in the Ecological Station of Pirapitinga (EEP), between the cities of Morada Nova de Minas and Três Marias (MG) (Figure 1). The EEP belongs to the fluvial archipelago of the Marias islands, inserted in the UHT dam. After the reservoir filling in 1962, the area became an island, what occurs when water reaches a maximum level (Figure 1).
FIGURE 1. Location of the Ecological Station of Pirapitinga, Minas Gerais state (Brazil).
The ecological reservation has an area of nearly 1,180 hectares, and perimeter of 20 km. It is at an average altitude of 570 and 630 meters above sea level. The local climate is classified as Aw by the climatic classification of Köppen-Geiger (KOTTEK et al., 2006). This climate is featured by hot and humid summers, with cold and dry winters. The relief is mostly slightly hilly; within a breadth of 50 m., prevalent soils locally are Red Latosols and Haplic Cambisols.
Five landscape units were detected on site and selected, being: bare soil (BS), Rough savanna, Forested savanna, Typical savanna and Evergreen dry wood. Such vegetation types were classified according to RIBEIRO & WALTER (2008) (Table 1).
TABLE 1. Characterization of vegetation types in the Ecological Station of Pirapitinga, Minas Gerais state - Brazil.
Structural parameters
Phytophysiognomy Rough savanna Typical savanna Forested
savanna
Evergreen dry wood
Total base area (m2 ha-1) 6.73 21.11 22.11 39.32
Mean individual base area (m2 h-1) 0.007 0.009 0.016 0.020
Absolute density (ind. ha-1) 926 2257 1371 1930
Mean diameter (cm) 9.57 (DSH) 10.90 (DSH) 14.89 (DBH) 16.10 (DBH)
Mean height (m) 2.55 3.95 7.44 9.34
Because of variations in the UHT water level, the island under study acquires
different features over the years. For this reason, for spatial-temporal reviews, the area was limited based on the maximum water level achieved by UHT reservoir (Figure 1).
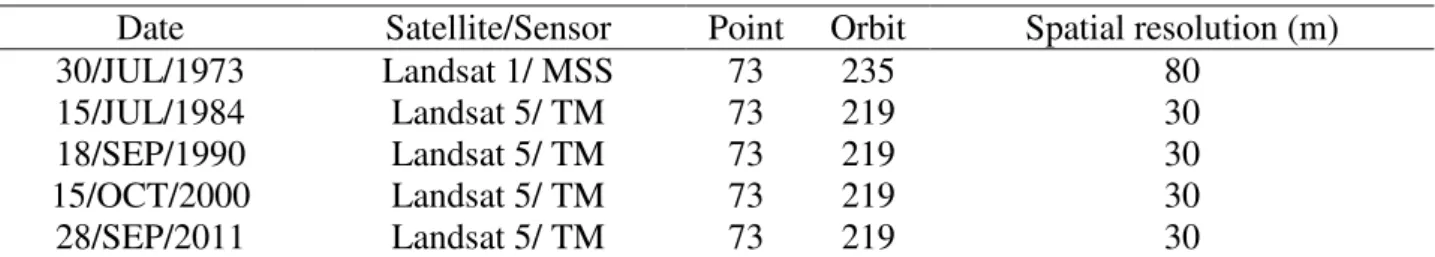
Images of the satellites Landsat 1 Multispectral Scanner (MSS) and Landsat 5 Thematic Mapper (TM) were freely acquired from electronic image catalog of the National Institute for Space Research (http://www.dgi.inpe.br/CDSR/) (Table 2). After the acquisition of images by TM sensor, radiometric gauging and reflectivity steps were made following the method proposed by CHANDER & MARKHAM (2007), using SEBAL algorithms (Surface Energy Balance Algorithm for Land), proposed by BASTIAANSSEN (1995). Nonetheless, these steps were not performed for images of 1973, given MSS sensor limitations. All image-processing steps were developed in ERDAS Imagine software, version 2014, and ArcGIS v. 10.2.
TABLE 2. Images used for unsupervised classification of landscape units contained in the Ecological Station of Pirapitinga, Minas Gerais state (Brazil).
Date Satellite/Sensor Point Orbit Spatial resolution (m)
30/JUL/1973 Landsat 1/ MSS 73 235 80
15/JUL/1984 Landsat 5/ TM 73 219 30
18/SEP/1990 Landsat 5/ TM 73 219 30
15/OCT/2000 Landsat 5/ TM 73 219 30
28/SEP/2011 Landsat 5/ TM 73 219 30
After radiometric corrections, the images were again processed for NDVI calculations as proposed by ROUSE et al. (1973) and used by BITENCOURT et al. (1997). This index is derived from spectral information from TM3 (red) and TM4 (near infrared) bands contained in the TM-Landsat 5 (Equation 1).
TM3 TM4 TM3 TM4 NDVI
(1)
NDVI hybrid images were used for supervised and unsupervised calculations. The latest images (2011) were rated by supervised classification, by means of Maximum Likelihood (ML), since this year was taken as a control, in addition to 20 samples of reference points for each vegetation type in the field. Once the older images had no reference points in the field, they were classified by unsupervised method - ISODATA. The geographical coordinates of the points were recorded by a Global Positioning System (GPS) navigation receiver (Garmin, model 76CS).
The supervised method by ML follows a few procedures for effectiveness achievement, being one of them the separability. For evaluation of this factor, a transformed divergence method is used for the production of a separability matrix between landmarks (QUARTAROLI & BATISTELLA, 2006). Besides, Kappa index (K) was also estimated, as proposed by LANDIS & KOCH (1977) and described below: ) X (X N ) X (X X N k i i r 1 i 2 i i r 1 i ii r 1 i
(2)in which,
K = Kappa accuracy index; r = number of matrix lines;
Xii = number of observations in ith row and ith column;
Ground truthing was validated for the 47 control points in the five classes, whose
locations were checked in the field by GPS set at World Geodetic System 84 (WGS 84) datum and Universal Transverse Mercator (UTM) grid. This procedure was performed for checking and automatic classification and ground truth.
In order to set the areas covered by each landscape unit (LU) in each year (1973, 1984, 1990 and 2000), ISODATA classification method was used. For this study five categories were defined and likeness of pixels with 10 interactions.
Both NDVI and LU data showed no repetitions. For this reason, chi-square nonparametric test
(χ2) was applied at 5% probability to assess differences between the mean NDVI for each LU over the years, as well as for calculating the absolute area of each LU and year. To investigate the relationship between NDVI and the dynamics of absolute areas of LUs, we used the Spearman correlation at 1% and at 5% probability
RESULTS AND DISCUSSION
LU separability could be calculated from spectral signature identification of each of them, in 2011 (Table 3). From the point of view of spectral differentiation, the more well-defined, the better the supervised classification (KUPLICH et al., 2013; SEXTON et al., 2013; OTTINGER et al., 2013; RASI et al., 2011).
TABELA 3. Matrix of transformed divergence separability for landscape units of the Ecological Station of Pirapitinga, Minas Gerais State.
Landscape unit 1 2 3 4
1- Bare soil 0
2- Rough savanna 1516.54 0
3- Typical savanna 1854.13 1854.13 0
4- Forested savanna 1987.37 1988.11 1987.34 0
5-Evergreem dry wood 1997.11 1992.98 1997.55 1523.87
Among the LUs, bare soil showed the highest separability. Notwithstanding, Rough savanna and bare soil had the lowest values of separability (Table 3), not indicating a good rating. It is very likely that these values were found because of the low canopy density of rough savanna physiognomy, which increased soil exposition.
Low separability values, in general, indicate the relevance of grouping same class samples (MISHRA et al. 2015; LIESENBERG et al., 2007; BITENCOURT et al., 1997). Conversely, the low separability between rough savanna and bare soil, found here, had no effect on separation visualization in land cover map (Figure 3), being afterwards confirmed in the field. MISHRA et al. (2015) studied savanna landscape units in Africa and found low separability between shrubby vegetation and bare soil; however, a good distinction was displayed on the maps, and later confirmed in situ. These authors also stated that a structural similarity between both units resulted in lower spectral separability. Therefore, in our study, we decided not to group the Rough savanna and bare soil classes.
In addition, Forested savanna and Evergreen dry wood have failed to provide a good spectral separation by the transformed divergence method (Table 3). This result might have been due to flora and structural similarities between these two vegetal formations (Table 1) (GIÁCOMO et al., 2015), thereby increasing the similarity of their spectral signatures. For this reason, both were grouped into the same class named Forest complex, which was used in unsupervised classifications in the years of 1973, 1984, 1990 and 2000.
basis, could not be separated by NDVI values (NDVI = 0.45 to 0.56). Nonetheless, for
the other LUs in EEP, NDVI values are within the range determined by LIESENBERG et al. (2007) and BITENCOURT et al. (1997) (Table 4).
TABLE 4. NDVI amplitude and Kappa index for the landscape units of the Ecological Station of
Pirapitinga, Minas Gerais State (Brazil).
Landscape unit NDVI amplitude Kappa index
Minimum Maximum
Bare soil -0.056 0.025 0.784
Rough savanna 0.025 0.206 0.699
Typical savanna 0.206 0.424 0.898
Forested savanna 0.424 0.652
0.809*
Evergreen dry wood 0.424 0.652
*Kappa index for Typical savanna and Evergreen dry wood joint as Forest complex.
Overall, the accuracy of classes followed the same pattern as the separability of them, in other words, classes with bad separability had lower Kappa index. The separability between bare soil and rough savanna was considered very good, while between Typical savanna and Forest complex as excellent (Table 4). This standard indicated that control points generated by the software ERDAS Imagine (2014) validated the classification prepared by the method MAXVER.
Chi square χ2 testing showed significant differences in NDVI values in all assessed years (χ2 = 17.68; the degree of freedom = 5 and p < 0.005). This standard displays differences in vegetation photosynthetic activity in each evaluated years. These results are confirmed by a positive relationship between mean NDVI values with the evaluated years (Figure 2), i.e. in the course of time, these values increased. It suggests a dynamics among the phytophysiognomies in EEP, which, over time, showed an increase of biomass in LUs, turning from an open canopy condition into a more closed one. This procedure distributes spectral classes uniformly throughout space and, subsequently, clustering class by class, as an interactive process.
FIGURA 2. NDVI average evolution over time in the Ecological Station of Pirapitinga, Minas Gerais State (Brazil).
TABLE 5. Spearman correlation between absolute areas of vegetation and average NDVI of the Ecological Station of Pirapitinga, Minas Gerais State (Brazil).
Landscape unit 1 2 3 3
1- Bare soil 1
2- Rough savanna 0.923* 1
3- Typical savanna 0.652 0.564 1
4- Forest complex -0.823* -0.782* -0.857 1
NDVI -0.747** -0.680** -0.596 0.827*
*, ** Spearman correlation significant at 1% and at 5% respectively.
Likewise, correlations between absolute areas in the respective years were also significant. Forest complex had a negative correlation with both bare soil and rough savanna, namely while the first increases the latter two decrease over time. Bare soil and rough savanna had a positive correlation with each other, and highly significant. Based on this, we may infer that these LUs have their areas reduced in the course of time, at the expense of increases in the Forest complex (Table 5).
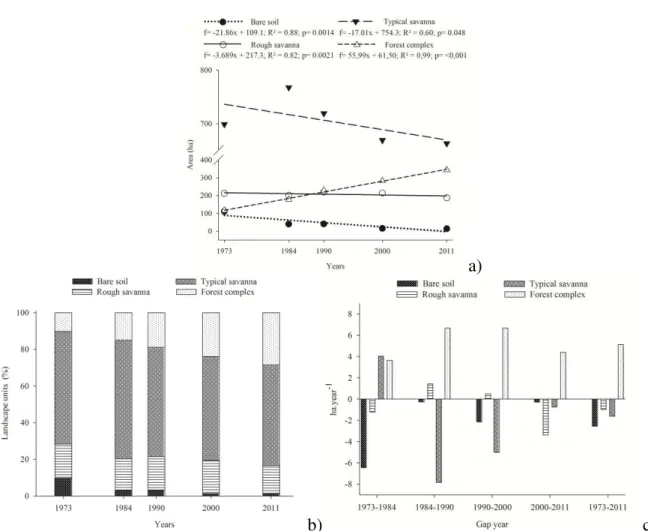
The mapping showed significant changes in vegetation cover of the EEP over the 38 years evaluated (χ2 = 16.14, the degree of freedom = 4; and p <0.0011). In short, the modifications occurred for all classes, observing depletion for bare soil, rough savanna and Typical savanna and growth for Forest complex (Figure 3). These results are endorsed by high coefficients of determination reached for all LUs (Table 5), with a downward trend for bare soil, rough savanna and Typical savanna and upward for the areas of Forest complex (Figure 4a).
FIGURA 3. Maps of vegetation cover evolution throughout the years on landscape units of the Ecological Station of Pirapitinga, Minas Gerais State (Brazil).
sites in which bare soil and rough savanna are located exhibit limiting factors to other vegetation types.
a)
b) c)
FIGURA 4. Evolution, relative areas and conversion rate of landscape units over the years in the Ecological Station of Pirapitinga, Minas Gerais State (Brazil).
In terms of area proportion, Typical savanna had the largest value for all studied years (Figure 4b). In 1973, Forest complex had the least representation; however, only seventeen years were required (up to 1990) so that it became the second area in size. At the beginning (1973), the bare soil was the third in the relative area; however, eleven years later, it rose to the fourth position (Figure 4b).
During the entire study period (1973-2011), the bare soil was the only class showing area decrease, being most significant between 1973 and 1984 (Figure 4c). This period was also the only one within which Typical savanna showed growth (6.1 ha yr-1), decreasing after that. For rough savanna, an area increase was observed between 1984 and 2000; however, in the subsequent interval there was a reduction rate (2.7 ha yr-1). Since 2000, bare soil, Rough savanna and Typical savanna showed a downward trend if compared to Forest complex (Figure 4c).
fighting fires (DURIGAN & RATTER, 2006). In this study, transitional vegetation types
were Forested savanna and Evergreen dry woods, which are expanding onto areas originally occupied by Typical savanna, on fertile moist soils found near the banks of the EEP (Figure 3). Therefore, the higher conversion rate of the Forest complex in relation to the other LUs is due to well adaptation of Evergreen dry wood and Forested savanna to the most humid environments of the EEP, associated with greater protection against fires and animal grazing.
The increase in NDVI over the study period (Figure 2) may be linked to protective measures taken such as banning the entry of herds and flocks, and mainly firefighting established since the Conservation Unit creation in 1975. In a similar study combining satellite images with aerial photographs of Cerrado areas in São Paulo state, DURIGAN & RATTER (2006) showed a rapid successional change over the 38 years. Cerrado areas with more open vegetation were replaced by more closed covers, for the purpose of protection against anthropogenic interferences as fire and livestock. In 1962, these authors claimed that the area consisted of 75% in Cerrado broad sense, 16% in Open savanna and only 9% in the Forested savanna. In 1984, Cerrado broad sense area declined to 69%, open savanna was only 0.6% and Forested savanna occupied 30.4%. In 2000, Forested savanna has already occupied 68% of the area and, in 2003; there was no more left open savanna area. These transitions are no longer permanent, so under further changes such process might be reversed. If exposed to fire or cut, the more closed vegetation types can be reversed to open vegetation, and shade-tolerant species become less important and may even disappear.
In accordance with the outcomes shown in this study, we may assume that some of the LUs in EEP have evolved into other types with a larger volume of plant biomass over the time. Therefore, in the course of time, there will be most likely a successional evolution following this sequence: bare soil < Rough savanna < Typical savanna < Forest complex.
Confirming the statements of this study, much attention has been paid to fast changes in succession and fragmentation of rare natural Cerrado environments in the recent decades (SILVA et al., 2013; ROCHA et al., 2011; CARVALHO JÚNIOR et al., 2008; LIESENBERG et al. 2007; FERREIRA & HUETE, 2004; FERREIRA et al., 2004; DURIGAN & RATTER, 2006). As a positive factor, the assessment of these changes is increasing the number of protected areas in these environments whether they are protected or not against human actions. Nevertheless, for the conservation of natural environments of a Cerrado broad sensu has to take into account the ecological processes to which the area is subjected throughout thousands of years, such as fires (HIROTA et al., 2011; DURIGAN & RATTER, 2006). Therefore, only to surround and protect the natural areas of Cerrado broad sensu is not enough against the influence of fire. This protection likely will result in environmental imbalance; and the ecosystem will possibly evolve into a different condition of the original one (ANADÓN et al., 2014; DURIGAN & RATTER, 2006).
CONCLUSIONS
The method used in this study provided a satisfying monitoring of the vegetal covers on landscape units throughout different times. The results pointed out changes in space and speed over the time, allowing us to build the current scenarios and rebuild the past conditions.
The spectral values were able to distinguish almost all landscape units. Only Forested savanna and Evergreen dry wood did not differ spectrally from each other, being thus grouped into the same class named as Forest complex.
Landscape unit NDVI and absolute areas showed significant differences during the assessed period, demonstrating increased photosynthetic capacity of the vegetation over the time. This result suggests a successional development of the landscape units to phytophysiognomies with higher plant biomass.
REFERÊNCIAS
ACHARD, F., BEUCHLE, R., MAYAUX, P., STIBIG, H.-J., BODART, C., BRINK, A.
Determination of tropical deforestation rates and related carbon losses from 1990 to 2010. Global Change Biology, New Jersey, v.20, n.8, p.2540-2554, ago. 2014.
ANADÓN, J.D.; SALA, O.E.; MAESTRE, F.T. Climate change will increase savannas at the expense of forests and treeless vegetation in tropical and subtropical Americas. Journal of Ecology, London, v. 102, n.6, p.1363–1373, nov. 2014.
ANDREW, M.E.; WULDER, M.A.; NELSON, T.A. Potential contributions of remote sensing to ecosystem service assessments. Progress in Physical Geography, London, v. 38, n.3, p. 328–353, 2014.
BASTIAANSSEN, W.G.M. Regionalization of surface flux densities and moisture indicators
in composite terrain. 1995. 273f. Tese (Doutorado em Sensoriamento remoto) -Wageningem Agricultural University, Wageningen, 1995.
BEUCHLE, R.; GRECCHI, R.C.; SHIMABUKURO, Y.E.; SELIGER, R.; EVA, H.D.; SANO, E.; ACHARD, F. Land cover changes in the Brazilian Cerrado and Caatinga biomes from 1990 to 2010 based on a systematic remote sensing sampling approach. Applied Geography, Amsterdam, v. 58, p.116-127, mar. 2015.
BITENCOURT, M.D.; MESQUITA JÚNIOR, H.N.; MANTOVANI, W.; BATALHA, M.A.; PIVELO, V.R. Identificação de fisionomias de Cerrado com imagem índice de vegetação. In:
LEITE, L.L.; SAITO, C.H. Contribuição ao conhecimento ecológico do Cerrado. Brasília:
Editora da Universidade de Brasília, 1997. p.316-320.
BODART, C.; EVA, H.; BEUCHLE, R.; RASI, R.; SIMONETTI, D.; STIBIG, H.J. Pre-processing of a sample of multi-scene and multi-date Landsat imagery used to monitor forest cover changes
over the tropics. ISPRS Journal of Photogrammetry and Remote Sensing, Amsterdam, v. 66,
p.555-563, set. 2011.
BODART, C.; BRINK, A.B.; DONNAY, F.; LUPI, A.; MAYAUX, P.; ACHARD, F. Continental estimates of forest cover and forest cover changes in the dry ecosystems of Africa between 1990 and 2000. Journal of Biogeography, New Jersey, v. 40, n. 6, p. 1036-1047, jun. 2013.
CARVALHO JÚNIOR, O.A.; SAMPAIO, C.S.; SILVA, N.C.; COUTO JÚNIOR A.F.; GOMES R.A.T.; CARVALHO, A.P.F.; SHIMABUKURO, Y.E. Classificação de padrões de savana usando assinaturas temporais NDVI do sensor MODIS no Parque Nacional Chapada dos Veadeiros.
Revista Brasileira de Geofísica, São Paulo, v. 26, n. 4, p. 505-517, out.-nov. 2008.
CHANDER, G., MARKHAM, B.; BARSI, J.A. Revised Landsat-5 Thematic Mapper radiometric calibration. IEEE Geoscience and Remote Sensing Letters, New York, v. 4, n. 3, p.490-494, jul. 2007.
COELHO, V.H.R.; MONTENEGRO, S.M.G.L.; ALMEIDA, C.D.N.; LIMA, E.R.V.D.; RIBEIRO NETO, A.; MOURA, G.S.S.D. Dinâmica do uso e ocupação do solo em uma bacia hidrográfica do semiárido brasileiro. Revista Brasileira de Engenharia Agrícola e Ambiental, Campina Grande, v. 18, n.1, p.64-72, jan. 2014.
DALPOSSO, G.H.; URIBE-OPAZO, M.A.; MERCANTE, E.; LAMPARELLI, R.A.C. Spatial autocorrelation of NDVI and GVI indices derived from Landsat/TM images for soybean crops in the western of the state of Paraná in 2004/2005 crop season. Engenharia Agrícola, Jaboticabal, v.33, n.3 p.525-537, mai.-jun. 2013.
EVA, H.D.; ACHARD, F.; BEUCHLE, R.; MIRANDA, E.; CARBONI, S.; SELIGER, R.; VOLLMAR, M; HOLLER, W.A.; OSHIRO, O.T.; ARROYO, V.B.; GALLEGO, J. Forest cover changes in tropical South and Central America from 1990 to 2005 and related carbon emissions and removals. Remote Sensing, Basel, v.4, n.5, p. 1369-1391, mai. 2012.
FERREIRA, L.G.; HUETE, A.R. Assessing the seasonal dynamics of the Brazilian Cerrado vegetation through the use of spectral vegetation indices. International Journal of Remote Sensing, Amsterdam, v.25, n.10, p.1837-1860, ago. 2004.
FERREIRA, L.G.; YOSHIOKA, H.; HUETE, A.; SANO, E.E. Optical characterization of the Brazilian Savanna physiognomies for improved land cover monitoring of the Cerrado biome: preliminary assessments form an airborne campaign over an LBA core site. Journal of Arid Environments, Amsterdam, v.56, n.3, p.425-447, fev. 2004.
GIÁCOMO, R.G.; CARVALHO, D.C.; PEREIRA, M.G.; SOUZA, A.B.; GAUI, T.D. Florística e fitossociologia em áreas de Campo Sujo e Cerrado Sensu Stricto na Estação Ecológica de
Pirapitinga – MG. Ciência Florestal, Santa Maria, v.23, n.1, p.29-43, jan.-mar. 2013. GIÁCOMO, R.G.; PEREIRA, M.G.; CARVALHO, D.C.; MEDEIROS, V.S.; GAUI, T.D. Florística e Fitossociologia em Áreas de Cerradão e Mata Mesofítica na Estação Ecológica de Pirapitinga, MG. Floresta e Ambiente, Seropédica, v.22, n.3, p.287-298, fev. 2015.
GIRI, C.; PENGRA, B.; LONG, J.; LOVELAND, T.R. Next generation of global land cover
characterization, mapping, and monitoring. International Journal of Applied Earth Observation and Geoinformation, Amsterdam, v.25, p.30–37, dez. 2013.
GÓMEZ, C.; WHITE, J.C.; WULDER, M.A. Optical remotely sensed time series data for land
cover classification: A review. ISPRS Journal of Photogrammetry and Remote Sensing,
Pensilvânia, v.116, p.55–72, jun. 2016.
GRECCHI, R.C.; GWYN, Q.H.J.; BÉNIÉ, G.B.; FORMAGGIO, A.R.; FAHL, F.C. Land use and land cover changes in the Brazilian Cerrado: a multidisciplinar approach to assess the impacts of agricultural expansion. Applied Geography, Oxford, v.55, p.300-312, dez. 2014.
HENRIQUES, R.P.B. Influência da história, solo e fogo na distribuição e dinâmica das
fitofisionomias no bioma dos cerrados. In: SCARIOT, A.; SOUSA-SILVA, J. C.; FELFILI, J.M.
Cerrado: ecologia, biodiversidade e conservação. Brasília: Ministério do Meio Ambiente, p.73-92, 2005.
HILL, M.J.; ROMÁN, M.O.; SCHAAF, C.B. Dynamics of vegetation indices in tropical and subtropical savannas defined by ecoregions and moderate resolution imaging spectroradiometer (MODIS) land cover. GeocartoInternational, Greenbelt, v.27, 153–191, mar. 2012.
HIROTA, M., HOLMGREN, M., VAN NES, E.H.; SCHEFFER, M. Global resilience of tropical forest and savanna to critical transitions. Science, Washington, v.334, n.6053, p.232–235, oct. 2011. JUNGES, A.H.; FONTANA, D.C.; PINTO, D.G. Identification of croplands of winter cereals in Rio Grande do Sul State, Brazil, through unsupervised classification of normalized difference vegetation index images. Engenharia Agrícola, Jaboticabal, v.33, n.4, p.883-895, jul-ago. 2013. KOTTEK M.; GRIESER J.; BECK C.; RUDOLF B.; RUBEL F. World map of the Köppen-Geiger climate classification updated. Meteorologische Zeitschrift, Berlin, v.15, n.3, p.259-263, jun. 2006.
KUPLICH, T.M.; MOREIRA, A.; FONTANA, D.C. Série temporal de índices de vegetação sobre diferentes tipologias vegetais no Rio Grande do Sul. Revista Brasileira de Engenharia Agrícola e Ambiental, Campina Grande, v.17, n.10, p.1116-1123, oct. 2013.
LANDIS, J.R.; KOCH, G.G. The measurement of observer agreement for categorical data.
LIESENBERG, V.; PONZONI, F.J.; GALVÃO, L.S. Análise da dinâmica sazonal e
separabilidade espectral de algumas fitofisionomias do Cerrado com índices de vegetação dos sensores Modis/Terra e Aqua. Revista Árvore, Viçosa, MG, v.31, n.2, p.295-305. 2007.
MISHRA, N.B.; CREWS K.A.; MILLER J.A.; MEYER T. Mapping vegetation morphology types in Southern Africa Savanna using MODIS time-series metrics: A case study of Central Kalahari, Botswana. Land, Basel, v.4, n.1, p.197-215. 2015
MÜLLER, H.; RUFIN, P. H.; GRIFFITHS, P.; BARROS SIQUEIRA, A.J.; HOSTERT, P. Mining dense Landsat time series for separating cropland and pasture in a heterogeneous Brazilian savanna landscape. Remote Sensing of Environment, Amsterdam, v.156, p.490–499, jan. 2015.
OTTINGER, M.; KUENZER, C.; LIU, G.; WANG, S.; DECH, S. Monitoring land cover dynamics
in the Yellow River Delta from 1995 to 2010 based on Landsat 5 TM. Applied Geography,
Oxford, v.44, p.53–68, out. 2013.
PETTORELLI, N.; LAURANCE, W. F.; O’BRIEN, T. G.; WEGMANN, M.; NAGENDRA, H.;
TURNER, W. Satellite remote sensing for applied ecologists: Opportunities and challenges.
Journal of Applied Ecology, London, v.51, n.4, p.839–848, ago. 2014.
POTAPOV, P.; HANSEN, M.C.; GERRAND, A.M.; LINDQUIST, E.J.; PITTMAN, K.; TURUBANOVA, S.; WILKIE, M.L. The global Landsat imagery database for the FAO FRA remote sensing survey. International Journal of Digital Earth, Nova Iorque, v.4, n.1, p.2-21, fev. 2011.
QUARTAROLI, C.F.; BATISTELLA, M. Classificação Digital de Imagens de Sensoriamento
Remoto: tutorial básico. Campinas: Embrapa Monitoramento por Satélite, 2006, 50p.
RASI, R.; BODART, C.; STIBIG, H.J.; EVA, H.; BEUCHLE, R.; CARBONI, S.; SIMONETTIC, D.; ACHARD, F. An automated approach for segmenting and classifying a large sample of multi-date Landsat imagery for pan-tropical forest monitoring. Remote Sensing of Environment, Amsterdam, v.115, n.12, p.3659-3669, dez. 2011.
RIBEIRO, J.F; WALTER, B.M.T. As principais fitofisionomias do Bioma Cerrado. In: SANO, S.M.; ALMEIDA, S.P.; RIBEIRO, J.F. Cerrado: Ecologia e flora. Planaltina: Embrapa Cerrados, 2008. p.152-212.
ROCHA, G. F.; FERREIRA, L.G.; FERREIRA, N.C.; FERREIRA, M.E. Detecção de
desmatamentos no bioma Cerrado entre 2002 e 2009: Padrões, tendências e impactos. Revista Brasileira de Cartografia, Brasília, v.63, n.3, p.341-349, nov. 2011.
ROUSE, J.W.; HAAS, R.H.; SCHELL, J.A.; DEERING, D.W. Monitoring vegetation systems in the Great Plains with ERTS. In: PROCEEDINGS OF THE THIRD ERTS SYMPOSIUM, 1973,
Anais do National Aeronautics and Space Administration, Washington, p. 309–317. 2006. SEXTON, J.O.; URBAN, D.L.; DONOHUE, M. J.; SONG, C. Long-term land cover dynamics by multi-temporal classification across the Landsat-5 record. Remote Sensing of Environment, Amsterdam, v.128, p.246–258, nov. 2013.
SILVA, C.R.; SOUZA, K.B.; FURTADO, W.F. Evaluation of the progress of intensive agriculture in the Cerrado Piauiense – Brazil. IERI Procedia, Amsterdam, v.5, p.51-58, jan. 2013.
TOWNSHEND, J.R.; MASEK, J.G.; HUANG, C.; VERMOTE, E.F.; GAO, F.;
CHANNAN, S.; SEXTON, J.O.; FENG, M.; NARASIMHAN, R.; KIM, D.H.; SONG, K.; SONG, D.; SONG, X.; NOOJIPADY, P.; TAN, B.; HANSEN, M.; LI, M.; WOLFE, R. Global
characterization and monitoring of forest cover using Landsat data: Opportunities and challenges.
International Journal of Digital Earth, London, v.5, n.5, p.373-397, set. 2012.
VIEIRA, R.M.D.S.P.; CUNHA, A.P.M.D.A.; ALVALÁ, R.C.D.S.; CARVALHO, V.C.; FERRAZ NETO, S.; SESTINI, M.F. Land use and land cover map of a semiarid region of Brazil for