ISSN 0001-3765 www.scielo.br/aabc
Two-dimensional map of direction selectivity in
cortical visual area MT of
Cebus
monkey*
ANTONIA CINIRA M. DIOGO1, JULIANA G. M. SOARES1, THOMAS D. ALBRIGHT2 and RICARDO GATTASS1
1Instituto de Biofísica Carlos Chagas Filho, UFRJ, 21941-900 Rio de Janeiro, RJ, Brazil 2Salk Institute, #10010 N. Torrey Pines Rd., La Jolla, California, 92037-1099, USA
Manuscript received on June 24, 2002; accepted for publication on July 1, 2002; contributed byRicardo Gattass**
ABSTRACT
We studied the spatial organization of direction of motion in visual area MT of theCebus apellamonkey. We used arrays of 6 (700µm apart) parallel electrodes in penetrations tangential to the cortical layers to record multi-unit responses to moving bars, at 200µm steps. We determined the direction selectivity at each recording site. The data from single penetrations showed cyclic and gradual changes in the direction selectivity of clusters of cells, intermixed with abrupt 180◦ discontinuities along the electrode track. In
order to obtain maps of direction of motion selectivity, we examined the spatial distribution of direction of motion in MT and we applied a method to determine the location of the centers of radial arrangements of direction selectivity. This tangential organization is characterized by slow continuous changes in direction of motion, interrupted by discontinuities. The changes in direction selectivity are organized radially in a pinwheel fashion and in slabs of linear variation. The pinwheel arrangements have 800-1400µm in diameter. The size of the radial arrangement is comparable to the point image size in area MT at each eccentricity.
Key words:extrastriate cortex, visual system, primates, direction of motion.
INTRODUCTION
The modular organization of the neocortex has been widely studied for decades. A characteristic feature of neocortical organization is the arrangement of neurons representing similar attributes into columns that extend from the cortical surface to the white matter (Mountcastle 1957, Hubel and Wiesel 1962, 1968, 1974). Mountcastle (1957), using single-unit recordings in the somatic sensory cortex of cats,
*This paper is dedicated to Professor Carlos Chagas Filho, men-tor and founder of the Instituto de Biofísica Carlos Chagas Filho, UFRJ, to celebrate the 92nd anniversary of his birth.
September 12, 2002.
**Member of Academia Brasileira de Ciências Correspondence to: Dr. Ricardo Gattass E-mail: [email protected]
found the first evidence for neo-cortical columnar or-ganization. This functional segregation of neurons was later demonstrated in different cortical areas for other stimulus modalities. In the primary visual cor-tex of cats and monkeys, Hubel and Wiesel (1962, 1974) found that cells in the same vertical column in the cortex had the same orientation preference, while cells in adjacent columns had preferences that differed slightly. The preferred orientation changed linearly as a function of distance through the cor-tex. A single 180°-cycle of orientation change
en-compass 500-700µm of cortex. Linear orientation
sequences were often interrupted by reversals in di-rection of motion or by discontinuous jumps up to
se-lectivity was not clear. Based on one-dimensional evaluation of orientation, Hubel and Wiesel (1974) suggested that the orientation preference might be represented in parallel slabs in primate visual cortex. Conventional microelectrode measurements offer a one-dimensional picture of columnar organization within a three-dimensional cortex; however, it has been difficult to deduce from such measurements the precise form of the larger two-dimensional (2D) columnar representation (Braitenberg and Braiten-berg 1979).
Optical imaging of intrinsic signals offers an alternative and more direct means to assess the 2D topography of cortical columns. It has provided an elegant resolution to long-standing debates about the orientation column system of V1 (Blasdel and Salama 1986). Although revealing large-scale 2D columnar structure, there are some critical limita-tions to the optical imaging approach. One obvious problem is that optical signals cannot be recorded readily from cortical regions that are buried within sulci. Long before the description of the organiza-tion of these columns by the optical imaging method, Braitenberg and Braitenberg (1979), based on the analysis of published data on the orientation se-lectivity in V1 of cat (Albus 1975) and monkey (Hubel and Wiesel 1974), proposed that the orienta-tion columns most probable were organized in radial arrangements. These authors, based on the analysis of published data from penetration oblique to the cortical surface, proposed a model for the geometry of the orientation columns in visual cortex. They showed that it was possible to reconstruct the ar-rangement of the orientation columns from long and sometimes multiple parallel penetrations if the tan-gential organization of the orientation was arranged radially around centers.
The goal of this study was to explore the tan-gential organization of direction of motion selective
cells in MT inCebus apella, using the Braitenberg’s
method. Area MT inCebusis homologous to area
MT of Old World macaque monkey (Fiorani et al.
1989, Gattass and Gross 1981). InCebus, MT is
an oval area mainly located in the posterior bank of
the dorsal portion of the superior temporal sulcus. Our approach involves the use of multiple micro-electrodes that are arranged in linear arrays. The ar-ray enables a two-dimensional sampling of neuronal direction selectivity along each electrode and simul-taneously across all electrodes of the array. We de-scribe the modular 2D organization of direction-of-motion selectivity using the Braitenberg’s method (Braitenberg and Braitenberg 1979) to reveal the centers of radial arrangements and to estimate their dimensions. A preliminary account of these results was presented previously in abstract form (Diogo et al. 1999).
MATERIALS AND METHODS
Three adultCebusmonkeys (Cebus apella)
weigh-ing between 2 and 3 Kg were recorded, 3-5 times each. All experimental protocols followed NIH guidelines for animal care and use and were ap-proved by the Institutional Animal Care and Use Committee of the IBCCF/UFRJ.
Animal Preparation and Maintenance
One week prior to the first recording session, a stain-less steel cylinder and a head bolt, oriented in the stereotaxic planes, were affixed to the animal’s skull with screws and dental acrylic. Surgical procedures were performed under aseptic conditions using ke-tamine anesthesia (20 mg/kg). For the recording sessions, animals were anesthetized initially using ketamine (20 mg/kg) followed by halothane 2.0% in a mixture of nitrous oxide and oxygen (7:3). They were paralyzed by a continuous infusion of pancuro-nium bromide (0.1 mg/kg/h), and artificially venti-lated. Halothane was discontinued once paralysis became stable and anesthesia was maintained by a
mixture of N2O/O2(7:3) and by continuous infusion
of phentanil citrate (0.003 mg/kg/h). Body
temper-ature was maintained at 37-38◦C with a heating pad,
an intervening period of at least one week between successive recording sessions. Before visual stim-ulation began, the cornea was fitted with a contact lens and accommodation paralyzed by topical appli-cation of atropine (1%). The contra-lateral eye was focused on a tangent screen at a distance of 57 cm and the ipsilateral eye was occluded.
Recording sessions generally continued for 12-16 h. One hour before the end of recording session, the paralytic agent was discontinued. The recording cylinder was washed out and filled with saline and the animal allowed to recover. Usually within 3 h the animal was alert and active in his home cage.
Electrophysiological Recording
We used an array contained six parallel varnish-coated tungsten microelectrodes to record from
clus-ters of cells in MT, in 200µm steps. At each position
of the microelectrode array, neuronal responses were assessed on each electrode. Visual stimuli were pre-sented manually using a hand-held projector and a rear-projection screen. Patterns of stimulus selectiv-ity recorded on each electrode were characterized by the experimenter, based on audio evaluation of firing rate under different conditions. After the neuronal receptive field (RF) boundaries were mapped, the preferred direction was determined by judging the best multi-unit response to a bar that was moved in systematically varied directions. If the site exhib-ited no strong responses compared to spontaneous activity, in all tested directions, it was classified as non-responsive. If the site was responsive to moving stimuli but had no clear direction preference, it was classified as pan-directional. Some recording sites had two preferred directions that were clearly better than the others. In such cases, we determined the preferred direction to be the one eliciting stronger responses. Recordings in these three animals were confined to the cortex representing an area of the
vi-sual field within approximately 10◦of the fovea.
Mi-croelectrode array penetrations were approximately
tangential (10-13◦) to the surface of area MT. For all
experiments, the relative position of the electrodes within the array was known precisely at the
begin-ning of each penetration. Electrolytic lesions (4µA,
10 s) were used to mark the end of the penetrations.
Histology
At the end of a 3-5 weeks recording period, each an-imal was anesthetized with an overdose of sodium pentobarbital and perfused through the heart with saline followed by formalin solution. The brain was
removed from the skull and sectioned at an angle 28◦
backward of the frontal plane. Sections were cut at
40µm thickness. Alternate sections were stained for
myelin by the Gallyas’ (1979) method and for cell bodies, by a Nissl stain. The boundaries of area MT were determined based on characteristic myeloar-chitecture (Ungerleider and Mishkin 1979, Gattass and Gross 1981, Van Essen et al. 1981). Microelec-trode tracks and the location of the recording sites were reconstructed from the positions of electrolytic lesions. Data analysis was restricted to recording sites located in the heavily myelinated region along the floor and lower bank of the superior temporal sulcus.
The angle of the penetration in the plane of sec-tion was measured relative to the radial fascicles of fibers within the cortex. The angle of the penetra-tion in the plane orthogonal to the plane of secpenetra-tion was calculated by reconstructing the cortical surface from serial sections and estimating its slope.
Functional Maps of Motion Selectivity
The 2D functional organization of motion selectiv-ity in MT was revealed by maps derived from a set of recordings with RF properties. Maps were constructed for both preferred direction of motion and preferred axis of motion. For unidirectional recording sites, preferred axis of motion was cal-culated directly from the preferred direction. For bi-directional recording sites, preferred axis of
mo-tion was defined as the smaller angle (i.e. <180◦)
of the two preferred directions.
MT. Oriented arrows represented preferred direc-tion of modirec-tion at each recording site; preferred axis of motion was represented in the map by oriented bars. Asterisks were used to represent
pan-direc-tional recording sites. Non-responsive recording
sites were excluded from the maps.
The Braitenberg’s Method
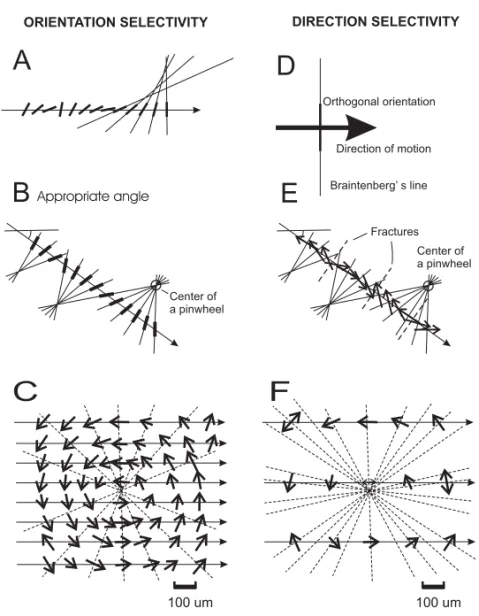
We estimate the location of the centers of radial ar-rangements of direction of motion using the Braiten-berg’s method. Braitenberg and Braitenberg (1979) have proposed a simple method to uniquely define the position of these centers on the vicinity of the electrode tracks. Their method was based on the ex-tension of successive oriented lines corresponding to the orientation selectivity at each recording site along an electrode track. We applied their method to the map of directional selectivity by plotting a line (2 mm long) orthogonal to the axis-of-motion selectivity. Using this method, we reconstructed the plane of penetration of the parallel electrode arrays using the gliosis, the linear cuts caused by the pen-etration of the electrode and the electrolytic lesions as landmarks in the histological sections. Then, we precisely locate the recording sites onto area MT to draw, at that location, a vector corresponding to the direction of motion, at the appropriate angle. Fi-nally, we plot a 2 mm line orthogonal to the direction vector passing through the recording site. As shown in Figure 1, this method is a generalization of the Braitenberg’s method for orientation.
Figures 1A and 1B show the graphical repre-sentation used by Braitenberg and Braitenberg (1979) to determine the location of the centers of the pinwheel. There is a strict spatial relationship between the angle of electrode track in the 2D sur-face and the representation of orientation, at each point. In Figure 1A, the Braitenberg line does not converge at the center of circular arrangement inas-much as the angle of the electrode track is plotted at an inappropriate angle. The orientation map has a representation of the absolute angle of the stimu-lus in the visual field plotted in trigonometric space
(0◦to the right, 90◦to the top, 180◦to the left and
270◦to the bottom). The appropriate angle of the
penetration is the exact projection of the penetra-tion track onto the cortical surface corresponding to the orientation map. In Figure 1B, the orienta-tion selectivities of the receptive fields are the same ones as in Figure 1A, but the angle of the penetra-tions in relation to orientation map in the cortex is the appropriate one. The location of the bars in the penetration track is the same as in Figure 1A, but their orientation matches the orientation selectivity of the visual receptive field. Under this condition, it is possible to reconstruct the tangential map of ori-entation selectivity of the cortex and to reveal the location of the pinwheels. Figure 1D is a schematic diagram of the definition of the Braitenberg line for direction selectivity. In this portion of the figure, a 2 (two) mm line orthogonal to the direction of motion, passing through the recording site location allows the reconstruction of the direction of motion map and the location of the center of the pinwheels (Fig. 1E). As shown by Blasdel and Salama (1986) there are two types of pinwheels, with four possible configuration: centripetal, centrifugal, radial clock-wise and radial counterclockclock-wise. Thus for each pinwheel, the angle of the Braitenberg’s line could be either orthogonal or co-linear with the axis of mo-tion selectivity. This method is appropriate to reveal axis of motion maps and it is immune to fractures of direction of motion. The invariance to opposite direction of motion may suggest that direction of motion selectivity is organized later in the develop-ment of neural circuits in area MT.
Figure 1C shows a reconstruction of a pinwheel in the direction of motion map in an ideal sampling condition, using a very dense electrode array. The application of the Braitenberg’s method to this sim-ulated data allows the reconstruction of a circular arrangement of direction of motion, with no discon-tinuity. The dense sampling in this case allows a direct visualization of the direction of motion circu-lar module. Figure 1F is a simulation of the use of an array similar to the one used in this study with
recording sites spaced by 200µm. In this case the
re-A
B
D
E
C
F
Direction of motion
Braintenberg’ s line Orthogonal orientation
Appropriate angle
ORIENTATION SELECTIVITY DIRECTION SELECTIVITY
Center of a pinwheel
Center of a pinwheel Fractures
100 um 100 um
Fig. 1 – The method of Braitenberg (for details see text).
veal the center of a pinwheel which is not easy to detect by direct visualization.
We suspected of 2D-circular arrangements of direction of motion in our data because the changes of direction of motion were variable from one pen-etration to the other, and they followed certain pat-terns: there are portions with no change in direction selectivity; there are changes with different rates of axis of motion selectivity; and finally, a plot of axis of motion vs. distance consist of sigmoid segments,
spanning for about 800−1400µm. As shown by
Braitenberg and Braitenberg (1979), electrode pen-etrations passing through the center of a pinwheel show no change in direction selectivity. Otherwise, the closer the electrode track is to the center of the pinwheel, larger the rate of change of axis of motion
per unit of distance traveled. Both in own data, as well as in Albright et al. (1984) data, the plot of axis of motion in degrees vs. distance consist of sigmoid segments, either ascending (clockwise rotation) or descending (counterclockwise ones) on the ordinate representing axis of motion. When two consecutive ascending (or descending) sigmoid segments appear in a penetration they are separated by a fracture or a jump in the plot.
RESULTS
moving bars and experimenter judgments of the neu-ronal response as reproduced on an audio monitor. Among neuronal recording sites, 79% responded to moving stimuli. Ninety-three percent of the respon-sive sites, in turn, exhibited directional selectivity; the remaining responsive sites were pan-directional.
Recording Site Localization
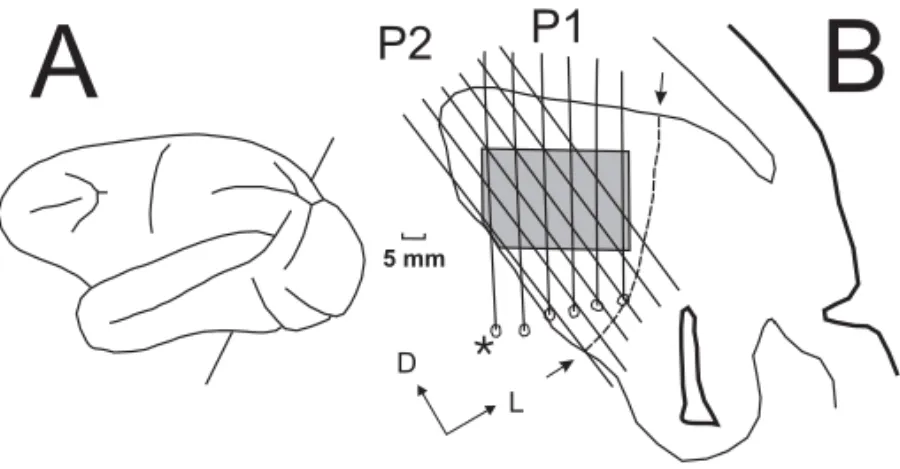
We reconstructed electrode tracks in oblique frontal sections (sliced at an angle intended to match the plane of electrode penetrations), in conjunction with the positions of electrolytic lesions and myeloarchi-tectonic borders within the cortex, to provide ev-idence for the portion of each electrode trajectory that passed through area MT. Along these trajecto-ries we localized the recording sites in the maps of directional preference. When the plane of section did not corresponded precisely to the plane of the electrode tracks, and thus each electrode array pen-etration traversed only a portion of a given section, we reconstructed a virtual plane of section using the location of the horizontal pins as alignment points and the portions of the sections containing the tracks of the penetrations as data. Gliosis from the pene-trations, which progressed dorso-ventrally through the brain, can be used to draw the electrode tracks in MT. Electrolytic lesions made at the end of the pene-trations are also used as depth marks. Figure 2B is a schematic representation of the reconstructed tracks (P1 and P2) of the penetration of two electrode ar-rays in Case 2.
Discrete Functional Maps Derived from RF
Measurements
Two-dimensional maps of direction-of-motion and axis-of-motion preference are illustrated in Figures 3 and 4, respectively. These maps were derived from 108 “hand-mapped” measures of directional preference at each recording site along three multi-electrode penetrations made in Case 2. Visualization of ordered columnar arrangements in area MT was often facilitated by examining preferred axis of mo-tion, rather than preferred direction of momo-tion, be-cause abrupt directional reversals disappears in this
type of representation (see Albright et al. 1984).
Maps of Direction-of-motion Preference
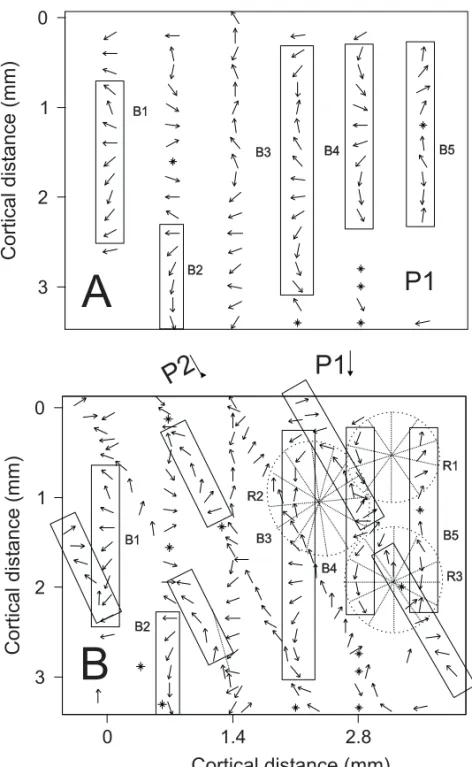
Figure 3 contains two direction-of-motion maps ob-tained from area MT in Case 2. One of these maps (Figure 3A) was derived from multi-unit RF mea-surements made along one of the six-electrode array penetrations (P1) made in this animal. The second map (Figure 3B) covers the same patch of cortex represented in Figure 3A, but it is a "composite" de-rived from the fortuitous overlap of two array pene-trations (P1 and P2). The locations of the two array penetrations relative to sulcal topography are indi-cated in Figure 2. Penetrations passing through MT
were approximately tangential(5◦) to the surface
of this area. Preferred direction of motion values at each recording site have thus been projected directly onto a flat rectilinear representation of the cortical surface in each map, and are indicated by arrows. Significant map features revealed by comparison of selectivity along the electrodes are highlighted in each map by elongated rectangles and circles.
The map illustrated in Figure 3A, which was derived from the first array penetration (P1), con-tains notable sequences (bands) of regular linear
progression (B1-B5), two of which cycle 180◦ or
diametri-D L 5 mm
P1
P2
A
B
*
Fig. 2 – Oblique frontal sections (B), at the level indicated in the lateral reconstruction of the hemisphere (A). Arrows indicate the borders of MT. Electrode tracks are indicated by vertical and oblique lines. The boundaries of area MT were determined based on myeloarchitecture. The asterisc indicate the array of penetration with electrolitic lesions at the end of the electrode track.
cally opposed recording sites exhibited roughly par-allel axis-of-motion selectivity. This arrangement suggests a radial pattern for axis-of-motion, which resembles a pinwheel with a diameter of approx-imately 1.4 mm. Comparisons between adjacent electrodes suggest radial arrangements that
encom-pass a full cycle of 180◦(R2 and R3). More
gen-erally, the linear sequences and radial patterns (R3) identifiable from the P1 data set, receive confirma-tion from P2. Some addiconfirma-tional features, such as the broad radial pattern R4, which is not confidently rec-ognizable in either data set considered alone, emerge from the joint P1+P2 map in the axis of motion map (Figure 4). One significant consequence of these frequent direction discontinuities, detectable upon close examination of the maps, is the complete
ab-sence of continuous sequences spanning 360◦ or
more. Not surprisingly, there were also no radial arrangements present with 360° of continuous vari-ation; reversals were also present in all identified pinwheels.
Maps of Axis-of-motion Preference
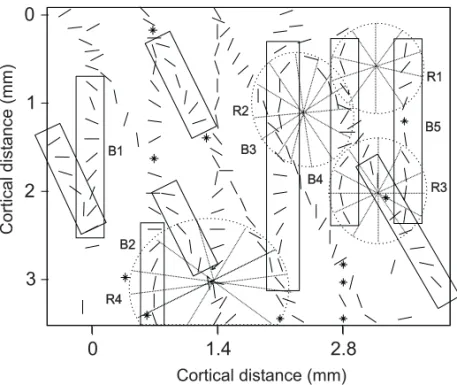
Figure 4 contains one axis-of-motion map derived from the penetration of two arrays of parallel elec-trodes. The preferred axis-of-motion observed at
each site is represented by an oriented line segment. To facilitate comparisons between axis- and direc-tion-of-motion maps, the locations of salient fea-tures (linear sequences and "pinwheels") that were identified in the direction-of-motion maps (Figure 3B) are indicated in Figure 4. As previously pointed out by Albright et al. (1984), the preferred direc-tion maps reveal that gradual sequences of preferred
axis of motion are commonly interspersed with 180◦
reversals in preferred direction of motion. Adjacent
recording sites that exhibit such 180◦directional
dis-continuities disappear in Figure 4.
Center of Pinwheels
P1
0
1
2
3
B1
B2
B3 B4 B5
A
R1
R3
P2
P1
0 1.4 2.8
B1 B3
B4
B5 R2
B
Cortical distance (mm)
Cortical
dist
ance
(mm)
Cortical
dist
ance
(mm)
B2
0
1
2
3
R4
R1
R3 B1
B2
B3
B4
B5 R2
0
1.4
2.8
Cortical distance (mm)
Cortical
dist
ance
(mm)
0
1
2
3
Fig. 4 – Patterns of axis-of-motion columns revealed by a manual plot of recep-tive field properties in two oblique crossing planes. Small bar shows the axis-of-movement selectivity for each recording site. The ellipses show radial arrangements or pinwheels and the rectangles show bands of linear arrangements. (See also legend for Figure 3).
not perceived previously, in Figure 3 or 4. Using a criterion of more than five intersections in a radius of
300µm, we delineated additional pinwheels, adding
to 13 pinwheels in 11,2 mm2of cortex. A
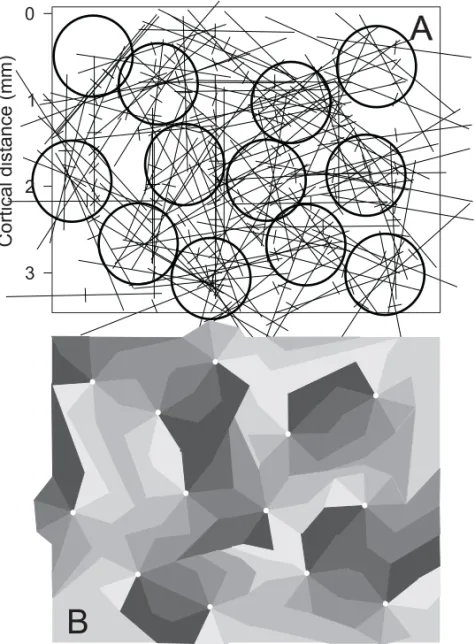
system-atic visual search for radial arrangements after the application of the Braitenberg’ s method reveals that most of the pinwheels around the identified center could be seen in the raw data, if an educated observer could search for possible pinwheels arrangements long enough, or if he could adjust the direction selec-tivity within a range of half bandwith. Figure 5B is an artistic representation of the axis-of-motion map using the location and dimension of the radial ar-rangements suggested by the Braitenberg’s method. In this figure, there are fewer discontinuities than in the direction map.
DISCUSSION
The reconstruction of the direction selectivity of neurons in planes of penetration of six parallel elec-trode arrays allowed us to reveal the
two-dimensio-nal organization of direction selectivity in MT of
Cebusmonkeys. The organization of direction se-lectivity showed an arrangement different from the regular ice-cube model proposed by Albright et al. (1984) for the organization of axis-of-motion in area MT of the macaque. The tangential organization of direction selectivity shows circular arrangements (pinwheels) separated by slow continuous changes in direction selectivity (slabs). These arrangements are similar to the ones previously described in cats V1 by Swindale et al. (1987) or in owl monkey area MT by Malonek et al. (1994).
Comparison with Previous Studies
Es-A
B
0
1
2
3
Cortical
dist
ance
(mm)
Fig. 5 – Pinwheels revealed by Braintemberg’s method on the plane of pene-tration illustrated in Figures 3 and 4. The method is based on the extension of successive lines (2 mm long) orthogonal to the axis-of-motion selectivity at each recording site. In A we considered centers of radial arrangements (circles) the location that had more than five intersections in a radius of 200µm. B is an artis-tic representation of the direction of motion map, where each half-tone density represents a range of 25 degrees.
sen et al. 1981). In macaques, where it has been studied most extensively, area MT lies in the lower bank and floor of the superior temporal sulcus along its posterior extent. This area contains a high pro-portion of directionally selective neurons and is be-lieved to play a central role in visual motion pro-cessing (Zeki 1974, Albright et al. 1984, Maun-sell and Van Essen 1983; see Albright 1993, for
review). Using the conventional electrophysiolog-ical approach (single microelectrode penetrations), Albright et al. (1984) demonstrated that neurons
in area MT ofMacaca fascicularisare organized
into cortical columns of similar preferred direction and preferred axis-of-motion. The size of the
hiper-columns for axis-of-motion(180◦/860µm)is
and Wiesel 1974). Although the one-dimensional (1D) electrophysiological data obtained by Albright et al. were insufficient to precisely identify the 2D columnar pattern in area MT, these investigators hy-pothesized a rectilinear arrangement of repeating di-rection and axis-of-motion columns, similar to the original "ice-cube" model for orientation and ocular dominance columns in area V1 (Hubel and Wiesel 1974).
Unfortunately, hypotheses regarding the 2D columnar pattern in area MT of macaques cannot be evaluated readily by optical imaging, inasmuch as MT is buried in a deep sulcus. However, electro-physiological evidence hinted that the owl monkey, which has a relatively flat cortex that is optically ac-cessible, also possesses a direction column system (Baker et al. 1981). Malonek et al. (1994) used optical imaging of intrinsic neuronal signals to ex-plore the functional architecture of owl monkey MT and they identified a columnar system for direction of motion. The 2D form of that system showed a clear tendency for radial organization, similar to the orientation column pinwheels of area V1.
Our use of multielectrode arrays has allowed us to advance beyond these findings in two impor-tant ways. Firstly, it has afforded an unprecedented opportunity to reveal the 2D pattern of direction
columns in a primate species (Cebus apella) in
which area MT is optically inaccessible. The pattern we have observed exhibits features that are charac-teristic of the pinwheel columnar systems seen in macaque V1 and owl monkey MT. Secondly our
dis-covery of direction columns in the New WorldCebus
monkey has enabled us to document their remark-able resemblance to those of the Old World macaque, which suggests a common evolutionary adaptation.
Axis-of-motion Organization in Area MT
The study of the directional selectivity of multi-unit clusters in MT in Case 2, shown in Figure 3, indi-cated the existence of an organization for direction selectivity containing pinwheel-like circular mod-ules and modmod-ules in bands or slabs. These arrange-ments consistently contain discontinuities. The
di-rection preference changes smoothly, except at dis-continuities. Two neighbors slabs varying in differ-ent way, one counterclockwise and the other one clockwise, can to generate a radial arrangement. Each half of one pinwheel can be a part of a slab. These two types of arrangement are intermixed and they overlap significantly. One possible interpre-tation is that they coexist and the 2D-organization of direction selectivity is a mosaic of slabs and pin-wheels. However, another possibility is that each ar-rangement is an organizational consequence of the other. If we consider the axis-of-motion for each recording site and we substitute the directional se-lectivity by the axis-of-motion sese-lectivity these ar-rangements become more clear with much less dis-continuities. However, an axis-of-motion organiza-tion has probably limited biological meaning. An area where most of the neurons are responsive to moving stimuli and are unidirectional selective may play a role in the computation of trajectories of mov-ing stimuli (Newsome et al. 1986) and the biological meaning of an object moving towards the animal is very different than that moving away from the an-imal. Inasmuch as the V1 projections to MT are topographically organized (Ungerleider and Desi-mone 1986, Sousa et al. 1991, Rosa et al. 1993) it is likely that regions selective to opposing direc-tion to be close to each other in the map, although they may constitute portions of different functional modules.
Additional Inferences and Interpolations
observa-tion of abrupt shifts or discontinuities in the 2D-map made circular interpolation of direction selectivity inappropriate for such course matrices. Arrays with smaller inter-electrode distances and larger numbers of electrodes are currently being used in conjunction with an automatic data acquisition system to allow proper interpolation of cellular activity and of RF
properties inCebusvisual area MT.
The Braitenberg’s Method
The analysis of the data of one penetration of the 6-electrode array like the one in Figure 3A allows to identify bands of linear variation (B1-B5) and per-haps proposes the location of three possible circular arrangement or pinwheels (later labeled R1-R3 in Figure 3B). By adding another penetration of the array at the same plane of P1 tilted 30 degrees me-dial at the oblique posterior plane, the spatial sam-pling increases and it is possible to identify the loca-tion of at least four pinwheels (R1-R4). With more data points at the penetration plane, we are able to see more evidence for additional circular arrange-ments. However, with the systematic application of the Braitenberg’s method, with the criteria of five
lines converging in a circle of 300µm, we were
able to locate the center of 13 pinwheels in a patch
of cortex of 3.2×3.5µm. The size of these circular
patches was estimated to be 900-1000µm in
diam-eter, which is comparable to the size of the point image size in MT.
Modular Organization and Visual
Topogra-phy
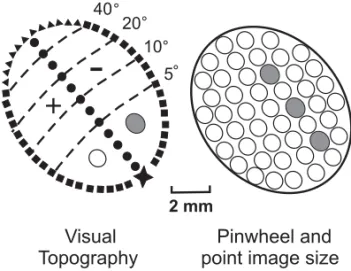
The search for models for visual processing with repetitive modulus has brought basic topographical definitions of properties and of patches underlying the process of decoding of physical parameters of the visual stimuli. The definitions of receptive field size, cortical magnification factor and point image size (Gattass et al. 1990 for review) are useful to de-fine the maps of visual topography of an area. MT inCebushas point images of about 1 mm in diam-eter, virtually invariant with eccentricity (Fiorani et al. 1989). Figure 6 shows a representation of the
visual topography of MT inCebusand its relation
to circular arrangements (pinwheels) of direction se-lectivity and to point image sizes. Surprisingly, the size of a point image, that is the area of the cortex influenced by a moving point in the visual fields, is very similar to the size of the pinwheels that we
are proposing for area MT ofCebus. Currently, we
have no data on the spatial relationship of these two modules. If they are independent, partially, or com-pletely overlapped are still issues requiring further systematic investigations.
40
Pinwheel and
point image size
Visual
Topography
5 10 20
-+
2 mm
Fig. 6 – Visual map of MT and dimensions of point image size (gray circle) and radial arrangements (open circle) of direction selectivity. Star, foveal representation; black squares, vertical meridian; filled circles, horizontal meridian; dashed lines, iso-eccentricity lines; triangles, periphery.
ACKNOWLEDGMENTS
Support for this work was provided by FAPERJ, CEPG, CNPq, FINEP and PRONEX. Thomas D. Albright is an investigator of the Howard Hughes Medical Institute.
RESUMO
Estudamos a organização espacial da seletividade ao
sentido do movimento na área visual MT do macaco
Cebus apella. Utilizamos um arranjo de 6 eletródios
pa-ralelos (separados por 700µm) em penetrações
tangen-ciais às camadas corticais para registrar, a cada 200µm,
mento. Determinamos a seletividade ao sentido de
movi-mento em cada sítio de registro. Os dados captados por
um único eletródio mostraram uma mudança cíclica e
gra-dual na seletividade ao sentido de movimento dos grupos
de neurônios registrados ao longo da trajetória do
eletró-dio, interrompida por mudanças abruptas de 180◦
oca-sionando descontinuidades na seletividade ao sentido do
movimento. Para obter mapas de seletividade ao
sen-tido do movimento, examinamos a distribuição espacial
da seletividade ao sentido do movimento e aplicamos um
método para determinar a localização dos centros dos
ar-ranjos radiais formados pela seletividade ao sentido de
movimento. Esta organização tangencial é caracterizada
por mudanças lentas e contínuas na seletividade ao
sen-tido de movimento interrompida por descontinuidades.
As mudanças na seletividade a sentido são organizadas
radialmente formando cata-ventos (pinwheels) e bandas
de variação linear. Os cata-ventos têm 800−1400µm de
diâmetro. A cada excentricidade, o tamanho desses
ar-ranjos radiais é comparável ao tamanho da imagem de um
ponto na área MT.
Palavras-chave: Córtex extra-estriado, sistema visual,
primatas, sentido de movimento.
REFERENCES
Albright TD.1993. Cortical processing of visual
mo-tion. Rev Oculomot Res 5: 177-201.
Albright TD, Desimone R and Gross CG. 1984.
Columnar organization of directionally selective cells in visual area MT of the macaque. J Neurophysiol 51: 16-31.
Albus K.1975. A quantitative study of the projection
area of the central and the paracentral visual field in area 17 of the cat II. The spatial organization of the orientation domain. Exp Brain Res 24: 181-202.
Baker JF, Petersen SE, Newsome WT and Allman
JM.1981. Visual response properties of neurons in
four extrastriate visual areas of the owl monkey ( Ao-tus trivigaAo-tus): a quantitative comparison of medial, dorsomedial, dorsolateral, and middle temporal ar-eas. J Neurophysiol 45: 397-416.
Blasdel GG and Salama G.1986. Voltage-sensitive
dyes reveal a modular organization in monkey striate cortex. Nature 321: 579-585.
Braitenberg V and Braitenberg C.1979.
Geome-try of orientation columns in the visual cortex. Biol Cybern 33:179-186.
Diogo ACM, Soares JGM, Albright TD and Gattass
R.1999. Columnar organization of area MT inCebus
apella. Soc Neurosci Abs 25: 672.
Fiorani M, Gattass R, Rosa MGP and Sousa APB.
1989. Visual area MT in theCebusmonkey: loca-tion, visuotopic organizaloca-tion, and variability. J Comp Neurol 287: 98-118.
Gallyas F.1979. Silver staining of myelin by means of
physical development. Neurol Res 1: 203-209.
Gattass R and Gross CG.1981. Visual topography of
the striate projection zone (MT) in posterior superior temporal sulcus of the macaque. J Neurophysiol 46: 621-638.
Gattass R, Rosa MG, Sousa APB, Pinon MC, Fiorani
M and Neuenschwander S.1990. Cortical streams
of visual information processing in primates. Braz J Med Biol Res 23: 375-93.
Hubel DH and Wiesel TN.1962. Receptive fields,
binocular interaction and functional architecture in the cat’s visual cortex. J Physiol Lond 160:106-154.
Hubel DH and Wiesel TN.1968. Receptive fields and
functional architecture of monkey striate cortex. J Physiol 195: 215-243.
Hubel DH and Wiesel TN.1974. Sequence regularity
and geometry of orientation columns in the monkey striate cortex. J comp Neurol 158: 267-293.
Malonek D, Tooltell RBH and Grinvaldi A.1994.
Optical imaging reveals the functional architecture of neurons processing shape and motion in owl monkey area MT. Proc R Soc Lond B 258: 109-119.
Maunsell JH and Van Essen DC.1983. Functional
properties of neurons in middle temporal visual area of the macaque monkey I. Selectivity for stimulus direction, speed and orientation. J Neurophysiol 49: 1127-1147.
Mountcastle VB.1957. Modality and topographic
properties of single neurons of cat’s somatic sensory cortex. J Neurophysiol 20: 408-34.
Newsome WT, Maunsell JHR and Van Essen DC.
Rosa MGP, Soares JGM, Fiorani M and Gattass R.
1993. Cortical afferents of visual area MT in the
Cebusmonkey: Possible homologies between New and Old World monkeys. Visual Neurosci 10: 827-855.
Sousa APB, Pinon MC, Gattass R and Rosa MGP.
1991. Topographic organization of cortical input to striate cortex in theCebus monkey: A fluorescent tracer study. J Comp Neurol 308: 665-682.
Swindale NV, Matsubara JA and Cynader MS.1987.
Surface organization of orientation and direction se-lectivity in cat area 18. J Neurosci 7: 1414-1427.
Ungerleider LG and Desimone R.1986. Projections to
the superior temporal sulcus from the central and pe-ripheral field representations of V1 and V2. J. Comp Neurol 248: 147-163.
Ungerleider LG and Mishkin M.1979. The striate
projection zone in the superior temporal sulcus of
Macaca mullata: Location and topographic organi-zation. J Comp Neurol 188: 347-366.
Van Essen DC, Maunsell JHR and Bixby JL.1981.
The Middle Temporal visual area in the macaque: myeloarchitecture, connections, functional proper-ties and topographic organization. J Comp Neurol 199: 293-326.
Zeki SM.1974. Functional organization of a visual area