Engineering
ISSN: 1809-4430 (on-line)
_________________________
2 University of Twente/ Enschede, The Netherlands. 3 Federal University of Lavras/ Lavras - MG, Brazil.
SURFACE ENERGY BALANCE SYSTEM (SEBS) AND SATELLITE DATA FOR MONITORING WATER CONSUMPTION OF IRRIGATED SUGARCANE Doi:http://dx.doi.org/10.1590/1809-4430-Eng.Agric.v36n6p1176-1185/2016
ELIZABETH FERREIRA1*, CHRISTIAAN M. MANNAERTS2, ANTONIO A. DANTAS3,
BERNARDUS H. MAATHUIS2
1*Corresponding author. Federal University of Lavras/ Lavras - MG, Brazil. E-mail: [email protected]
ABSTRACT: The objective of this research was to evaluate the water consumption of irrigated sugarcane areas using the Surface Energy Balance System (SEBS) driven by products derived from Meteosat Second Generation (MSG), SPOT/VEGETATION, Terra/MODIS satellite data and meteorological observations data from Minas Gerais State, Brazil. The actual evapotranspiration from SEBS model (ET-SEBS) was compared against crop evapotranspiration under standard conditions (ETc), which was obtained from weather data based on reference evapotranspiration (ET0) and the crop coefficient (Kc) values from FAO. Results showed that there was a good
agreement between ET-SEBS and ETc when sugarcane was at maximum development stage under
center pivot irrigation and the Kc value corresponded to 1.25. The ET-SEBS values seem to
overestimate water use during sugarcane late stage in areas which the Kc value was 0.7. Increasing
Kc to a value equals to 1.25 for sugarcane late stage, the differences between ETc and ET-SEBS
decreased; Kc is not so high at that stage, reinforcing ET-SEBS overestimation. In conclusion, the
estimation of evapotranspiration using satellite data and SEBS model approach was appropriated to monitor water usage of large sugarcane areas irrigated by center pivots in Minas Gerais State, Brazil.
KEYWORS: crop coefficient, evapotranspiration, irrigation, remote sensing, vegetation indices.
INTRODUCTION
Brazil is the largest sugarcane producer in the world and the production is concentrated in the south-central (87.4%) and northeastern regions (12.6%). The use of irrigation can increase sugarcane productivity, yield and the number of cuts per crop (cropping cycle), with other fringe benefits such as reducing production cost, increasing the number of jobs and economic sustainability in the region (BERNARDO, 2006).
The crop water requirement in irrigated agriculture has traditionally been estimated by the United Nations Food and Agriculture Organization (FAO-56 method) according to ALLEN et al.
(1998). In this method, crop evapotranspiration under standard conditions (ETc) is the product of
reference evapotranspiration (ET0) and the crop coefficient (Kc).
The Kc values for various crops, including sugarcane plant and sugarcane ratoon have been
proposed and evaluated by many researchers as DOORENBOS & PRUITT (1977), BERNARDO (2006), INMAN-BAMBER & MCGLINCHEY (2003), SILVA et al. (2012a) and SILVA et al.
(2012b). Although there are slight differences in Kc value recommendations by those authors, all of
them agree that it is related mainly to the crop stage development. KAMBLE et al. (2013) performed studies evaluating the performance of Kc values from Normalized Difference Vegetation
Index (NDVI). In those studies, a high correlation between NDVI and Kc values was found. Other
vegetation indices, such as the Enhanced Vegetation Index (EVI), can also be used to estimate Kc
and replace NDVI.
Surface energy balance system (SEBS) and satellite data for monitoring water consumption of irrigated sugarcane 1177
Resolution Imaging Spectroradiometer (MODIS) 16-day composite data. The tool proved to be useful for monitoring Land Use Land Cover (LULC) changes for forestry and agricultural applications in South America (FREITAS et al., 2011).
The use of surface energy balance algorithms based on remote sensing data has been shown to be quite promising for the estimation of actual evapotranspiration on both regional and local scales (LI et al., 2009). The Surface Energy Balance System (SEBS) model was proposed by SU (2002) to estimate atmospheric turbulent fluxes and evaporative fraction using satellite data and ancillary surface and meteorological information. SEBS consists of a set of tools for determining land surface physical parameters, such as albedo, emissivity, temperature, vegetation coverage from spectral reflectance and radiance. In addition, it can be an extended model for the determination of the roughness length for heat transfer and a formulation for the determination of the evaporative fraction because of energy balance at limiting cases (SU, 2002).
Since SEBS model was proposed, it has been used and tested by several authors such as ELHAG et al. (2011), GIBSON et al. (2011) and ALKHAIER et al. (2012), and applications have been made for databases with different spatial and temporal resolutions for various regions and crops. However, papers dealing with the operationalization of SEBS model and full methodologies that could be effectively applied for monitoring irrigated agriculture are limited. For Brazilian conditions, only one application using SEBS model was developed by FERREIRA et al. (2011a) to find the actual evapotranspiration (ET) in Minas Gerais State.
This research aimed to investigate the operational use of SEBS model in monitoring ET and water consumption of irrigated sugarcane in Minas Gerais, Brazil. For that purpose, estimations of
crop ETc were compared to actual evapotranspiration estimated by SEBS model (ET-SEBS) in
sugarcane areas irrigated by center pivots.
MATERIAL AND METHODS
The study area is located in Minas Gerais State, between 14º00' and 24º00' south latitude and
51º15' and 39º25' west longitude, with an area of 588,384.3 km2. Minas Gerais State has an annual
average temperature of 21.1 °C and an annual average rainfall of 1,259 mm. According to the
Köppen’s classification, the following climate types are locally found: Am (Tropical monsoon
climate), Aw (Tropical savanna climate), Cwa (Temperate, dry winter and hot summer), Cwb (Temperate, dry winter and warm summer) and Cfa (Temperate without dry season and hot summer).
An analysis of the remote sensing data, their products and the quality necessary to run SEBS model was the first step of this study. The selected period was July 2010, because of the high frequency of available days and usable data products.
Estimation of reference evapotranspiration (ET0) and crop evapotranspiration under
standard conditions (ETc) for sugarcane crop under center pivot irrigation
ET0 was estimated following the steps recommended by the FAO-56 method. This model is
parameterized for a hypothetical culture and is used to estimate daily ET0 (mm d-1) as defined by
ALLEN et al. (1998).
The meteorological data for ET0 calculation are air temperature, atmospheric pressure,
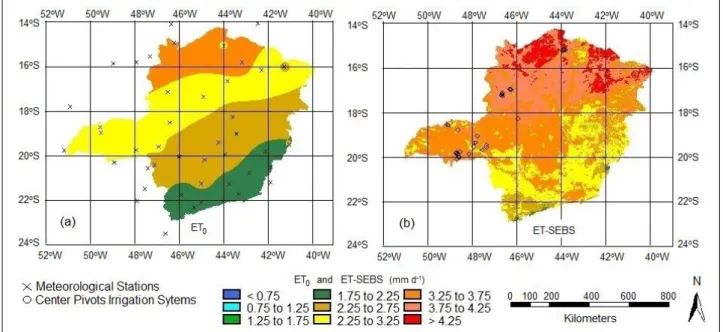
FIGURE 1. Daily average reference evapotranspiration (ET0) map (a) and daily average actual evapotranspiration (ET-SEBS) map (b) for July of 2010, in Minas Gerais State.
The ET0 for all weather stations was calculated during the period between 06/30/2010 and 07/30/2010. The spatial regionalization was obtained using an inverse distance weighting interpolation method, on an ET0 1 x 1 km grid. This operation was completed to generate ET0 information for the entire Minas Gerais State and to fit the information with the actual evapotranspiration output (ET) from SEBS model.
The map of irrigated areas by center pivots in Minas Gerais State was prepared by FERREIRA et al. (2011b) using CBERS-2B satellite images from the Charge Coupled Device camera (CCD/CBERS-2B), which provided images with 20 m spatial resolution. The authors used images from 2008 to 2010 and found 254,875 hectares being irrigated by 3,781 center pivots in Minas Gerais State. The sugarcane crop areas irrigated by center pivots were identified by overlaying that map of irrigated areas with center pivots with a land use map of sugarcane areas from the Canasat Project (RUDORFF et al., 2010). A set of 33 points were selected and identified by the coordinates from the center of each center pivot.
Crop evapotranspiration under standard conditions (ETc) is defined as the evapotranspiration
from a disease-free, well-fertilized crop, grown in large fields, under optimum soil water conditions and achieving full production under the given climatic conditions. According to ALLEN et al. (1998), the effect that distinguishes a cropped surface from the reference surface is integrated into the crop coefficient (Kc), which is multiplied by ET0 to determine ETc.
EVI2 is an enhanced vegetation index (EVI) obtained from a 2-band EVI without a blue band and expresses the crop stage, particularly when atmospheric effects are minimal and data quality is good. EVI2 profiles were obtained for the geographical coordinates of each center pivot from the Laboratory of Agriculture and Forest (LAF) available in https://www.dsr.inpe.br/laf/series/. Visual interpretations were performed to verify if the EVI2 profiles found at the center pivot coordinates corresponded to the sugarcane EVI2 profiles. Samples of temporal series of EVI2 sugarcane and other land use types are found in FREITAS et al. (2011).
Kc values from FAO-24 method were selected based on the growth stage of sugarcane crop,
derived from those interpretations of EVI2 profiles. This was done considering a good correlation
between the Kc value and the vegetation index.
Surface energy balance system (SEBS) and satellite data for monitoring water consumption of irrigated sugarcane 1179
period and harvesting dates) were retrieved. These retrieved data also allowed the selection of Kc
values for each studied point.
Estimation of actual evapotranspiration using SEBS model (ET-SEBS)
Actual evapotranspiration (ET) corresponds to the evapotranspiration of any crop at any development stage. A given crop may (or may not) be suffering from water limitation or any other factor preventing its potential growth rate (ALLEN et al., 1998). SEBS model estimates the daily actual evapotranspiration rate (ET-SEBS).
The complete formulation of SEBS model indicates that it requires three input data sets of information. The first set consists of land surface data, i.e. albedo, emissivity, surface temperature, fractional vegetation cover, leaf area index and vegetation height (or roughness height). When detailed vegetation information is not available, NDVI can be used as a proxy. These inputs can be derived from remote sensing data in conjunction with other information about the concerned surface. The second data set consists of meteorological data including air pressure, air temperature, humidity and wind speed at a reference height. The reference height is the measurement height of the meteorological parameters for the point of application and the height of the planetary boundary layer (PBL) for regional applications. The third input data consists of radiation data as downward solar radiation and downward long wave radiation, which can either be measured directly or obtained from weather forecast model running or using a different type of parameterization (SU, 2002).
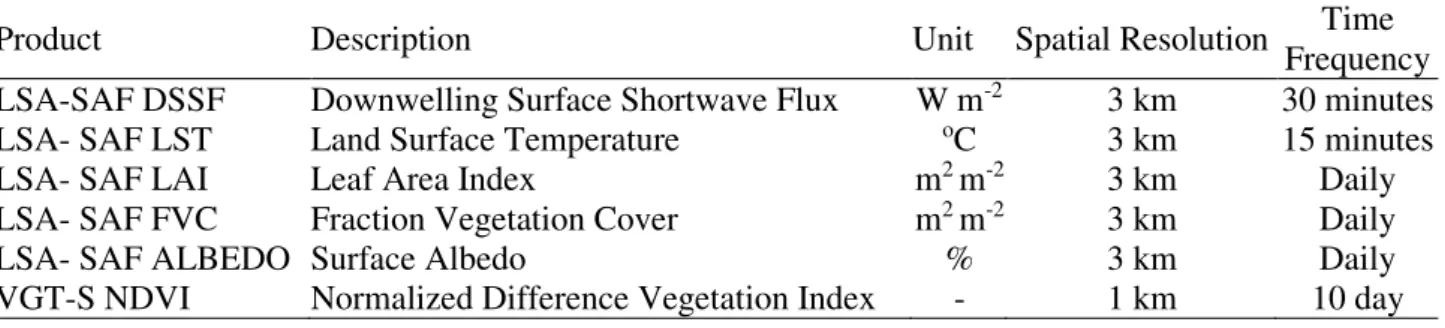
The first and third data set inputs were obtained from the Satellite Application Facility for Land Surface Analysis (LSA-SAF) data series products (DSSF, LST, LAI, FVC, ALBEDO) derived from Meteosat Second Generation satellite and VGT-S (NDVI) data from the SPOT-VEGETATION satellite. Table 1 shows a brief description of the data products, units, their time frequency and the spatial resolution at nadir.
The LSA-SAF products are land surface variables generated on a pixel-by-pixel basis, which are provided to users in the satellite nominal resolution. An overview of the LSA-SAF products, brief description of the algorithms and validation results are provided by TRIGO et al. (2011). VGT-S (Synthesis) products provide daily and 10-day Maximum Value Composite synthesis of NDVI that are corrected for atmospheric effects. Details of VTG-S product can be found in MAISONGRANDE et al. (2004). The emissivity is calculated using data from LSA-SAF FVC, according to VALOR & CASELLES (1996).
TABLE 1. Description of the LSA-SAF and VTG-S products used as input for the ET-SEBS computations including product name, description, unit, spatial resolution at nadir and viewing time frequency.
Product Description Unit Spatial Resolution Frequency Time
LSA-SAF DSSF Downwelling Surface Shortwave Flux W m-2 3 km 30 minutes
LSA- SAF LST Land Surface Temperature oC 3 km 15 minutes
LSA- SAF LAI Leaf Area Index m2 m-2 3 km Daily
LSA- SAF FVC Fraction Vegetation Cover m2 m-2 3 km Daily
LSA- SAF ALBEDO Surface Albedo % 3 km Daily
VGT-S NDVI Normalized Difference Vegetation Index - 1 km 10 day
The second required dataset was collected from the INMET’s meteorological weather stations
database. For each weather station, a table was generated with the following data: air temperature (oC), relative humidity (%), atmospheric pressure (kPa), specific humidity (kg kg-1), daily insolation
(h) and wind speed (m s-1). To estimate ET-SEBS, weather variables were first interpolated before
entering the modeling process as detailed by FERREIRA et al. (2011a).
kilometer) and was derived from a variety of raster and vector sources of topographic information (USGS, 2011). The "GEONETCast Toolbox" platform integrates the open software Integrated Land and Water Information System (ILWIS), being used to import and pre-process all the LSA-SAF and VTG-S NDVI products. This platform is also used to generate the daily zenith solar angle map (MAATHUIS et al., 2011).
The 1-km spatial resolution of the VTG-S NDVI product was used as geographic reference and all other maps and raster data were resampled to 1 km resolution. All maps were transformed into a geographic coordinate system and WGS84 datum with the spatial resolution of the VTG-S NDVI product (112 pixels per degree or 1 km). The ILWIS Open software contains a SEBS module, which permits data pre-processing and the evaluation of ET-SEBS and integrates all the data sets described above.
Method comparison and performance
Comparing evapotranspiration estimates from surface energy balance models with those estimated by the standard FAO-56 method is a common practice in the validation and assessment of evapotranspiration at regional and local scales (GERVAIS et al., 2012 and SILVA et al., 2012a). By adopting this procedure in this research, the sugarcane water consumption was evaluated by making
comparisons between daily ETc and ET-SEBS rates.
The performance of the models was further evaluated using the mean biased difference (MBD) statistic test. The MBD was calculated to determine whether ET was being over- or underestimated by SEBS model. Negative MBD values indicate underestimation, while positive values indicate overestimation.
RESULTS AND DISCUSSION
Reference ET0 and actual ET-SEBS in Minas Gerais State
The daily evapotranspiration estimates (reference ET0 and ET-SEBS) from sugarcane areas in
Minas Gerais State were computed after converting the input data into daily values. This temporal rescaling was done because some input data was only available in another time step (e.g. sub-daily). Since no FVC, LAI and albedo products were available, from the LSA-SAF, for July 2 and 23, evapotranspiration was evaluated for the 29 remaining days of July 2010.
Figure 1 shows the daily average evapotranspiration maps, i.e. reference evapotranspiration (ET0) and actual evapotranspiration (ET-SEBS) for July 2010 in Minas Gerais State. The daily
average ET0 values ranged from 1.75 mm d-1 to 3.97 mm d-1, with an increase from the southern to
the northern regions of Minas Gerais State (Figure 1a). Because ET0 depends only on weather and
climate variables, the observed spatial variation in ET0 follows regional climate pattern of Minas
Gerais. The daily ET-SEBS average values (Figure 1b) obtained from SEBS model showed values
between 1.80 and 5.06 mm d-1. The spatial pattern of ET-SEBS (with increasing values from south
to north) was similar to the ET0 pattern. The ET-SEBS daily average value map showed much more
spatial detail because datasets used as input in SEBS model show a much larger spatial variation and better reflect land cover and topographic conditions (Figure 1). Techniques using remote sensing information to estimate atmospheric turbulent fluxes are in fact essential when dealing with processes that cannot be properly represented by point measurements only (SU, 2002).
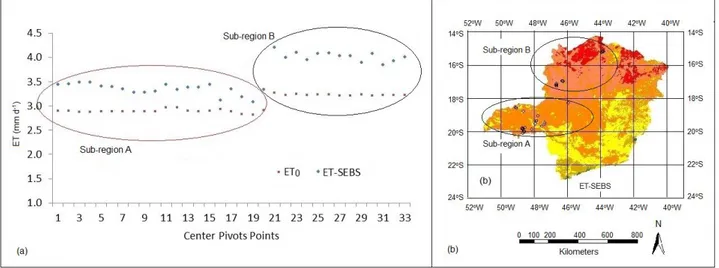
Figure 2a shows the ET-SEBS and ET0 variation for the 33 study points, for July 2010. The
mean values of ET-SEBS were always higher than reference ET0. The ET-SEBS and ET0 values
Surface energy balance system (SEBS) and satellite data for monitoring water consumption of irrigated sugarcane 1181
FIGURE 2. Daily mean ET-SEBS and ET0 values (mm d-1) for July, 2010 for the 33 center pivot
points with sugarcane crop (a) and the location of the points for the two studied sub-regions (sub-region A and sub-region B) in Minas Gerais (b).
In Figure 2b, it can be seen that these points belong to two distinct regions of Minas Gerais
State, here called Sub-regions A and B. According to the Köppen’s climate classification, the
Sub-regions A and B belong respectively to Cwa and Aw climates. The values of ET-SEBS and ET0 for
July 2010 were, respectively, on average, 3.35 mm d-1 and 2.89 mm d-1 for Sub-region A and 4.0
mm d-1 and 3.22 mm d-1 for Sub-region B.
Satellite monitoring of water consumption of sugarcane irrigated by center pivots
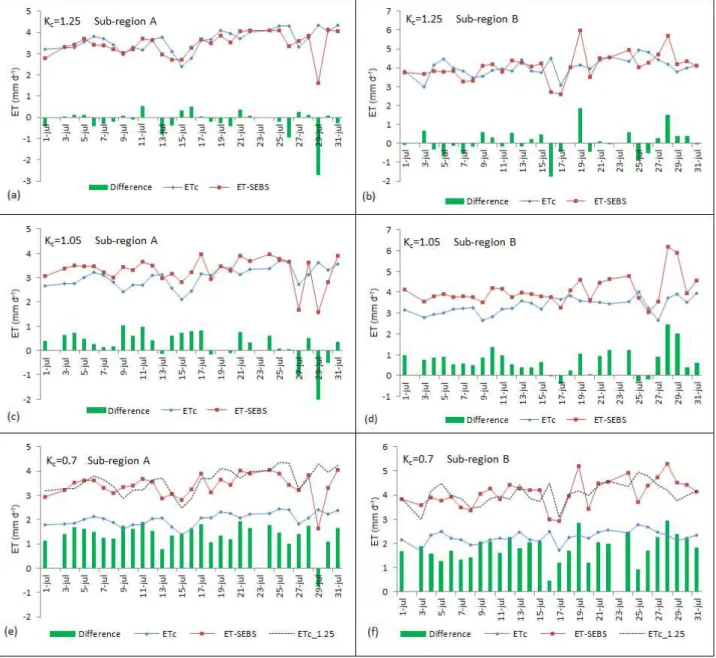
In Figure 3, six out of the 33 generated daily ET-SEBS and ETc time series are shown (3 center pivots for Sub-region A and 3 center pivots for Sub-region B) for different sugarcane stages. When the sugarcane crop is at its maximum development stage, corresponding to a crop coefficient
Kc equals to 1.25 (Figure 3a and 3b), only small differences between ETc and ET-SEBS values are
observed. Small differences can be observed between ETc and ET-SEBS values for July 3, 4, 5, 9,
10, 17, 22, 27 and 30 (Figure 3a). These agreements suggest the selected empirical Kc value of 1.25
(FAO-24 method) represents well the crop water requirement. Although the irrigation water supply scheme for sugarcane center pivots and soil water storage are not exactly known, the analysis shows that ET-SEBS can quantify the water consumption by the sugarcane at that crop stage.
Figure 3 also allows identifying outlying tendencies of ET-SEBS during the studied period. It occurred on 07/29 (Figure 3a), 07/19 and 07/28 (Figure 3b), 07/27 and 07/29 (Figure 3c), 07/28 and 07/29 (Figure 3d), 07/29 (Figure 3e) and 07/19 (Figure 3f). These variations are related to the sensitivity of SEBS model to the meteorological inputs, mainly temperature. The difference between inputs, LST and air temperature, forces sensible heat flux and causes some results to be out of range. In these analyses, those outliers were not reject instead.
When the sugarcane water consumption was monitored at different crop stages, and the lower Kc values 1.05 and 0.70 were used to compute ETc, the ET-SEBS values did not agree with the
corresponding ETc. It can be seen that when the Kc value was equal to 1.05 (Figure 3c and 3d), the
ET-SEBS values became slightly higher than the ETc values. When the Kc was 0.70, the difference
between ET-SEBS and ETc increased even more (see Figure 3e and 3f). However, the question
remains: did Kc values - a priori - selected from FAO-24 recommendations (DOORENBOS &
PRUITT (1977) and BERNARDO (2006) represent sugarcane irrigation practices and cultivation reality in Minas Gerais State? Considering that all other Kc values well fitted the ET-SEBS
estimations, these values may be accepted as reliable and the low Kc value (equals to 0.7) used for
FIGURE 3. Comparison of daily ET-SEBS with ETc evapotranspiration rates of sugarcane for July 2010 on six center pivot systems for different sugarcane development stage: (a) sub-region A; Kc = 1.25; (b) sub-region B, Kc = 1.25; (c) sub-region A, Kc = 1.05; (d) sub-region B, Kc = 1.05; (e) sub-region A, Kc = 0.7 and (f) sub-region B, Kc = 0.7.
The results found here are consistent with those found in a set of experiments conducted by INMAN-BAMBER & MCGLINCHEY (2003) in Australia and Swaziland to check the sugarcane
crop coefficients provided by FAO-56 method. Those experiments confirmed the sugarcane Kc
values equal to 0.4 (initial stage) and 1.25 (maximum development), but suggested a Kc value equal
to 1.25 for the crop final stage, replacing the 0.70 value, recommended by FAO-56 method.
The dotted black lines showed in Figure 3e and 3f, represent the ETc when the suggested Kc
value was set to 1.25 instead of 0.70.
The evapotranspiration (ET-SEBS vs. ETc) MBD calculated for July 2010 showed absolute
values of 0.39, 0.55 and 1.58 mm d-1, respectively, for K
c 1.25, 1.05 and 0.7 values. In a similar
study, SILVA et al. (2012c) found MBD values of 0.43 mm by comparing evapotranspiration estimation FAO-56 method vs. SEBAL model for irrigated coconut. Another study conducted by RIVAS & CASELLES (2004) to determine the reference evapotranspiration from NOAA-AVHRR
images land surface temperature, from 1992 to 1996, found an estimated error of 0.6 mm d-1 in the
Surface energy balance system (SEBS) and satellite data for monitoring water consumption of irrigated sugarcane 1183
For the semi-arid conditions in Brazil, researchers working on sugarcane water requirements
also found Kc values higher than those recommended by FAO-24 and FAO-56 methods and also
higher than those found in Australia and Swaziland. The crop coefficient values derived from field studies on soil water balance were 0.56, 1.43 and 1.32, during the initial, midseason and late stages for sugarcane growth in that dry tropical region (SILVA et al., 2012a). However, for semi-arid
conditions in the Bahia State, Brazil, a Kc average of 1.10 was found for the sugarcane maximum
stage from field experiments conducted by SILVA et al. (2012b). The authors considered that due
to the stalk lodging occurring within the crop cycle, the Kc values were below those suggested in
the FAO-24 method recommendations.
CONCLUSIONS
The evapotranspiration estimations from ET-SEBS and ETc methodologies presented small
differences, especially when sugarcane was at maximum development stage and under center pivot irrigation. The ET-SEBS procedure seems to overestimate water use for sugarcane at late stage in
areas which the Kc was 0.7. The ET-SEBS apparent overestimated values could be corrected, since
the differences were systematic (almost constant). Selecting a Kc value of 1.25 for sugarcane late
stage, the differences between ETc and ET-SEBS decrease. The estimation of evapotranspiration using satellite data and a surface energy balance model was appropriated to monitor water usage of large sugarcane areas irrigated by center pivots in Minas Gerais State, Brazil.
ACKNOWLEDGMENTS
We would like to acknowledge the financial support of the Minas Gerais’ State Research Support Foundation (FAPEMIG), process CAG-APQ 01560-12. Lichun Wang from ITC is gratefully acknowledged for her help and advice with SEBS model. Anna Stehle and Carla Hinson (English Teaching Assistantship Program, FULBRIGHT U.S.) are gratefully acknowledged for their help with the English editing.
REFERENCES
ALKHAIER, F; SU, Z.; FLERCHINGER, G. N. Reconnoitering the effect of shallow groundwater
on land surface temperature and surface energy balance using MODIS and SEBS. Hydrology and
Earth System Sciences, Katlenburg – Lindau, v. 16, p.1833–1844, 2012. Disponível em:
<www.hydrol-earth-syst-sci.net/16/1833/2012/>. Acesso em: 01 mar. 2014. doi:10.5194/hess-16-1833-2012
ALLEN, R.G.; PEREIRA, L.S.; RAES, D.; SMITH, M. Crop evapotranspiration - guidelines for
computing crop water requirements: FAO: Rome, 1998. 300p. (Drainage Paper 56).
BERNARDO, S. Manejo da irrigação na cana-de-açúcar. Item: Irrigação e Tecnologia Moderna,
Brasília, v. 71/72, p.56-62, 2006.
DOORENBOS J., PRUITT W.O. Guidelines for predicting crop water requirements. FAO:
Rome, 1977. 144p. (Irrigation and Drainage Paper 24)
ELHAG, M.; PSILOVIKOS, A.; MANAKOS, I.; PERAKIS, K. Application of the SEBS water balance model in estimating daily evapotranspiration and evaporative fraction from remote sensing
data over the Nile Delta. Water Resources Management, Dordrecht, v. 25, p.2731–2742, 2011.
doi:10.1007/s11269-011-9835-9
FERREIRA, E.; DANTAS, A.A.A; GARCIA, A.G. Estimation of evapotranspiration in Minas
Gerais State, Brazil. In: MAATHUIS, B.H.P.; MANNAERTS, C.M. GEONETCast-DevCoCast
application manual. Enschede. 2011a. Chapt 4. Disponível em:
FERREIRA, E. ; TOLEDO, J.H.; DANTAS, A.A.A.; PEREIRA, R.M. Cadastral maps of irrigated areas by center pivots in State of Minas Gerais, using CBERS-2B/CCD satellite imaging.
Engenharia Agrícola, Jaboticabal, v.31, n.4, p.771-780, jul/ago. 2011b. Disponível em: <http://www.scielo.br/pdf/eagri/v31n4/15.pdf>. Acesso em: 31 ago. 2011.
FREITAS, R.M.; ARAI, E.; ADAMI, M.; FERREIRA, A.S.; SATO, F.Y.; SHIMABUKURO, Y.E.; ROSA, R.R.; ANDERSON, L.O.; RUDORFF, B.F.T. Virtual laboratory of remote sensing time
series: visualization of MODIS EVI2 dataset over South America. Journal of Computational
Interdisciplinary Sciences, Heidelberg, v.2, n.1, p.57-68, 2011.
GERVAIS, M.; MKHABELA, M.; BULLOCK, P.; RADDATZ, R.; FINLAY, G. Comparison of standard and actual crop evapotranspiration estimates derived from different evapotranspiration
methods on the Canadian Prairies. Hydrological Processes, Chichester, v.26, p.1467-1477, 2012.
Disponível em: <wileyonlinelibrary.com>. Acesso em: 10 out. 2013. doi: 10.1002/hyp.8279 GIBSON, L.A.; MÜNCH, Z.; ENGELBRECHT, J. Particular uncertainties encountered in using a pre-packaged SEBS model to derive evapotranspiration in a heterogeneous study area in South
Africa. Hydrology and Earth System Sciences, Kattenburg – Lindau, v.15, p.295-310, 2011.
Disponível em: <www.hydrol-earth-syst-sci.net/15/295/2011/>. Acesso em: 02 jul. 2014. doi:10.5194/hess-15-295-2011
INMAN-BAMBER, N.G.; MCGLINCHEY, M.G. Crop coefficients and water-use estimates for
sugarcane based on long-term Bowen ratio energy balance measurements. Field Crops Research,
Amsterdam, v.83, p.125-138, 2003.
KAMBLE, B.; IRMAK, A.; HUBBARD, K. Estimating Crop Coefficients Using Remote
Sensing-Based Vegetation Index. Remote Sensing, New York, v.5, p.1588-1602, 2013. Disponível em:
<http://www.mdpi.com/2072-4292/5/4/1588/htm>.Acesso em: 23 abril 2015.
doi:10.3390/rs5041588
LI, Z-L.; TANG, R.; WAN, Z.; BI, Y.; ZHOU, C.; TANG, B.; YAN, G.; ZHANG, X. A review of
current methodologies for regional evapotranspiration estimation from remotely sensed data.
Sensors, Basel, v.9, p.3801-3853, 2009. Disponível em:
<http://www.mdpi.com/1424-8220/9/5/3801>. Acesso em: 26 nov. 2011.doi:10.3390/s90503801
MAATHUIS, B., MANNAERTS, C.; RETSIOS, B., SCHOUWENBURG, M. AND LEMMENS, R. GEONETCast Toolbox: installation, configuration and user guide of the GEONETCast Toolbox plug-in for ILWSI 3.7. Enschede. 2011. Disponível em:
<https://www.itc.nl/PDF/Organisation/Scientific%20departments/WRS/GNC_toolbox_manualXM L12.pdf> Acesso em: 1 jun. 2011.
MAISONGRANDE, P.; DUCHEMIN, B.; DEDIEU, G. VEGETATION/SPOT: an operational
mission for the Earth monitoring; presentation of new standard products. International Journal of
Remote Sensing, London, v. 25, p.9-14, 2004.
RIVAS, R.; CASELLES, V. A simplified equation to estimate spatial reference evaporation from
remote sensing–based surface temperature and local meteorological data. Remote Sensing of
Environment, New York, v.93, p. 68-76, 2004. Disponível em: <
http://www.utsa.edu/lrsg/Teaching/ES6973/ET-RSE1.pdf>. Acesso em: 3 abr. 2013. RUDORFF, B.F.T.; AGUIAR, D.A.; SILVA, W.F.; SUGAWARA, L.M.; ADAMI, M.;
MOREIRA, M.A. Studies on the rapid expansion of sugarcane for ethanol production in São Paulo
state (Brazil) using Landsat data. Remote Sensing, Basel, v.2, p.1057-1076, 2010. Disponível em:
<http://www.mdpi.com/2072-4292/2/4/1057>. Acesso em: 28 fev. 2013. doi: 10.3390/rs2041057
SILVA, V.P.R.; BORGES, C.J.R.; FARIAS, C.H.A.; SINGH, V.P.; ALBUQUERQUE, W.G.; SILVA, B. B. Water requirements and single and dual crop coefficients of sugarcane grown in a
tropical region, Brazil. Agricultural Sciences, Irvine, v.3, n.2, p.274-286, 2012a. Disponível em:
Surface energy balance system (SEBS) and satellite data for monitoring water consumption of irrigated sugarcane 1185
SILVA, T.G.F.; MOURA, M.S.B.; ZOLNIER, S.; SOARES, J.M.; VIEIRA, V.J.S.; F. JÚNIOR, W.G.F. Requerimento hídrico e coeficiente de cultura da cana-de-açúcar irrigada no semiárido
brasileiro. Revista Brasileira de Engenharia Agrícola e Ambiental, Campina Grande, v.16, n.1,
p.64-71, 2012b. Disponível em: <http://www.scielo.br/pdf/rbeaa/v16n1/v16n01a09.pdf >. Acesso
em: 19 mar. 2015.
SILVA, B.B.; BRAGA, A.C.; BRAGA, C.C.; OLIVEIRA, L.M.M.; GALVÍNCIO, J.D.; MONTENEGRO, S.M.G.L. Evapotranspiração e estimativa da água consumida em perímetro
irrigado do Semiárido brasileiro por sensoriamento remoto. Pesquisa Agropecuária Brasileira,
Brasília, DF, v.47, p.1218-1226, 2012c. Disponível em:
<http://www.scielo.br/pdf/pab/v47n9/06.pdf>. Acesso em: 25 nov. 2013.
SU, Z. The surface energy balance system (SEBS) for estimation of turbulent heat fluxes. Hydrology and Earth System Sciences, Katlenburg – Lindau, v.6, n.1, p.85-99, 2002.
TRIGO, I.F.; DACAMARA, C.C.; VITERBO, P.; ROUJEAN, J.L.; OLESEN, F.; BARROSO, C.; CAMACHO-DE-COCA, F.; CARRER. D.; FREITAS, S. C., GARCI´A-HARO, J. et al. The
Satellite Application Facility for Land Surface Analysis. International Journal of Remote
Sensing, London, v.32, n.10, p.2725-2744, 2011.
USGS - UNITED STATES GEOLOGICAL SERVICE. Global 30 Arc-Second elevation
(GTOPO30). Disponível em: < https://lta.cr.usgs.gov/GTOPO30>. Acesso em: 1 jun. 2011. VALOR, E., CASELLES, V. Mapping land surface emissivity from NDVI: application to
European, Africa and South American areas. Remote Sensing of Environment, New York, v. 57,