Performance of probe polymerization-conjunction-agarose gel electrophoresis
in the rapid detection of KRAS gene mutation
Na Xiao
1, Yi-Tong Tang
1, Zhi-Shan Li
2, Rui Cao
3, Rong Wang
2, Jiu-Ming Zou
2and Jiao Pei
21
Medical College of Hubei University of Arts and Science, Xiangyang, China.
2
Department of Clinical Laboratory, Affiliated Hospital of Hubei University of Arts and Science, Xiangyang,
China.
3
Department of Internal Medicine, Maternal and Child Health Care Hospital of Dongguan, Dongguan,
China.
Abstract
This study aimed to develop a simple and rapid method to detect KRAS gene mutations for conventional clinical ap-plications under laboratory conditions. The genotype of mutation sites was determined based on the occurrence of target bands in the corresponding lanes of the reaction tubes through polymerization-conjunction of the probes, probe purification and amplification, and agarose gel electrophoresis. Circulating DNA samples were obtained from the plasma of 72 patients with lung cancer, which were identified based on six mutation sites (G12S, G12R, G12C,
G12D, G12A, and G12V) of codon 12 of theKRAS gene. The detection results were compared with direct
sequenc-ing data. The proposed detection method is characterized by simple operation, high specificity, and high sensitivity (2%). This method can detect the mutations of three samples at G12S, G12R, and G12A. In the direct sequencing spectra of these samples, the genotype could not be determined due to the lack of evident sequencing peaks that correspond to the basic group of mutations. In conclusion, a simple and rapid method was established based on probe polymerization-conjunction-agarose gel electrophoresis for detecting KRAS gene mutations. This method can be applied to the conventional mutation detection of inhomogeneous samples.
Keywords: Mutation, circulating DNA, polymerization-conjunction reaction, agarose gel electrophoresis, K-ras.
Received: July 11, 2017; Accepted: December 30, 2017.
Introduction
The KRAS gene is a common oncogene in humans, and encodes the 21-kDa RAS protein. The RAS protein ex-hibits intrinsic guanosine triphosphate (GTP) enzymatic activity, and is involved in cell proliferation, differentia-tion, and apoptosis by switching the mutual transformation regulatory signal system between guanosine diphosphate (GDP) and GTP. The KRAS gene has a high mutation rate in patients with colorectal cancer and lung cancer, and con-fers the resistance to epidermal growth factor receptor (EGFR), tyrosine kinase inhibitors (TKIs), and EGFR monoclonal antibody agents (Chenet al., 2013; Liet al., 2014; Leiseret al., 2015; Hsuet al., 2016). Reports indicate that KRAS gene mutations in patients with non-small cell lung cancer are related to short survival time and poor prog-nosis (Liet al., 2016; Taoet al., 2016). The mutation rate of the KRAS gene significantly differs among various types of tumors and populations. For example, the mutation rate
of the KRAS gene can reach as high as 15–30% in Cauca-sian patients with colorectal cancer, and only 4–10% in Asian patients with lung cancer (Mascauxet al., 2005; Lu
et al., 2013; Kinugasaet al., 2015; Omidifaret al., 2015; Ohbaet al., 2016). Approximately 80% of KRAS gene mu-tations occur at codon 12, and the remaining mumu-tations take place mainly in codons 13 and 61 (Mascauxet al., 2005). Hence, the detection of KRAS gene mutations is important for the development of individualized treatments for pa-tients with tumors, as well as to improve the effects of tar-geted clinical treatments and reduce treatment expenses.
KRAS gene mutations can be detected using various detection methods, including restriction fragment length polymorphism (RFLP) (Dobreet al., 2013), DNA sequenc-ing (Kinugasa et al., 2015), capillary electrophoresis (Zhanget al., 2013), high-resolution melting (HRM) curve analysis (Heideman et al., 2009; Trujillo-Arribas et al., 2016), mass spectroscopy (Choiet al., 2014; Kriegsmannet al., 2015), pyrosequencing (Altimariet al., 2013; Vincenzi
et al., 2015; Macket al., 2016; Leeet al., 2016), and ARMS real-time PCR (Hamfjordet al., 2011; Zhanget al., 2015). DNA sequencing is a traditional detection method that has
Send correspondence to Yi-Tong Tang. Medical College of Hubei University of Arts and Science, No. 296 of Long Zhong Street, XiangCheng District, 441053 Xiangyang, China. E-mail: [email protected].
low sensitivity. Pyrosequencing, HRM, and RT-PCR tech-niques exhibit high sensitivity, but also have high require-ments in terms of experimental apparatus and conditions. These methods cannot be applied to conventional clinical detection under simple experimental conditions. In the present study, a simple, rapid, and sensitive method for de-tecting KRAS gene mutations was established based on probe polymerization-conjunction–agarose gel electropho-resis (PPC-AGE). This method was used to detect KRAS gene mutations at the six sites (G12S, G12R, G12C, G12D, G12A, and G12V) of codon 12.
Materials and Methods
Plasmid template and clinical samples
Plasmids that carry the wild and mutation alleles (G12S, G12R, G12D, and G12A) of codon 12 of the KRAS gene were constructed according to PCR-mediated site-specific mutagenesis technology. Plasma samples were collected from 72 patients with non-small cell lung cancer, who were admitted in the Affiliated Hospital of Hubei Uni-versity of Arts and Science and Zaoyang Clinical College. Circulating DNA samples were extracted according to the instruction of the DNA extraction kit (QIAamp DNA Blood Mini Kit, Qiagen), and stored at -20°C for detection of KRAS gene mutations.
Detection probe
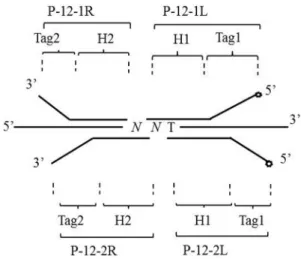
As shown in Figure 1, the mutations of codon 12 were detected using two pairs of oligonucleotide probes (P-12-1R/P-12-1L and P-12-2R/P-12-2L). P-12-1R and P-12-1L were used to detect mutations at G12S, G12R, and G12C, while P-12-2R and P-12-2L were used to test mutations at G12D, G12A, and G12V. Each probe pair comprises of five parts: homologous hybridization sequences (H1 and H2)
with the template, general amplification primer sequences (Tag1 and Tag2), and the 5’-end biotin labeling of probes P-12-1L and P-12-2L. The oligonucleotide probe se-quences were as follows:
P-12-1L: 5’biotin-GGGTTCGTGGTAGAGCGTCG GAGTACTCTTGCCTACGCCAC-3’,
P-12-1R: 5’p-AGCTCCAACTACCACAAGTGG CTGCTATCTCGGTGTCGTCTGG-3’;
P-12-2L: 5’biotin-GGGTTCGTGGTAGAGCGTC GGAGTCACTCTTGCCTACGCCA-3’;
P-12-2R: 5’p-CAGCTCCAACTACCACAAGGG CTGCTATCTCGGTGTCGTCTGG-3’.
Tag1 sequences and their sequences complementary with Tag2 (C Tag2) were as follows:
Tag1: 5’-GGGTTCGTGGTAGA GCGTCGGAGT--3’;
CTag2: 5’-CCAGACGACACCGAGATAGCAGC C-3’.
The oligonucleotide probes were synthesized by Shanghai Sangon Co., Ltd.
KRAS gene amplification
Exon 2 of the KRAS gene was amplified by PCR. The forward and reverse primers used were as follows: 5’-TAAGCGTCGATGGAGGAGTT-3’ and 5’-CATCA TGGACCCTGACATAC-3’, respectively. The amplifica-tion system comprised of 5mL of the circulating DNA
sam-ple, 2.5mL (10 pmol/mL) of each amplification primer, 5 mL of deionized water, and 15 mL of 2´ Taq PCR
Mastermix. The amplification conditions were as follows: 32 cycles of 95°C for five minutes, 95°C for 45 seconds, 54°C for 45 seconds, 72°C for 90 seconds, and 72°C for four minutes. The amplified DNA sequences were ex-tracted (SanPrep Column PCR Product Purification Kit, Shanghai Sangon Biotech) and stored at -20°C. The ampli-fication products were subjected to the direct sequencing method.
Polymerization and conjunction
P-12-1R and P-12-1L corresponded to a group of four reaction tubes (“G1,” “A1,” “C1,” and “T1”), and P-12-2R and P-12-2L to another group of four reaction tubes (“G2,” “A2,” “C2,” and “T2”). These eight reaction tubes were added with 28mL of the reaction buffer (20 mM of
Tris-HCl (pH 7.6), 25 mM of KAC, 10 mM of MgAC2, 10 mM
of DTT, 1 mM of NAD, and 0.1% Trion-´100), 50 fmol of
detection probes, and 5 fmol of template sequences. Next, the tubes were added with 1mL of deoxyribonucleotide (25 mM) bases that are complementary with the labeling of
dif-ferent tubes (for example, dATP was added to tube T, and dCTP was added to tube G). These tubes were processed at 95°C for three minutes and at 49°C for five minutes. Subse-quently, 1mL of enzyme solution (1 unit Pfu of DNA
poly-merase (Shanghai Sangon, Co., Ltd., China) and 2 units of
Taq DNA ligase (New England BioLabs, USA) were added. Then, the tube was again processed at 49°C for five minutes and at 98°C for 10 minutes. All reaction tubes were cooled in ice bath.
Purification of the conjunction-dependent probe
Conjunction products in the different reaction tubes were purified through the magnetic particles of streptavidin (Xi’an GoldMag Nanobiotech Co. Ltd., China). These pu-rified magnetic particles were washed by aqueous alkali (0.1 M of NaOH) to eliminate the non-specifically ad-sorbed nucleotide sequence. Finally, the magnetic particles were stored in Tris-HCl buffer solution (10 mM, pH 7.5).
Amplification and detection
The conjunction-dependent probes that bound to the streptavidin magnetic beads were subjected to PCR ampli-fication. A 20-mL reaction mix contained 5mL of the
mag-netic particle template, 2.5 pmol of Tag1 and CTag2 primers, and 10mL of 2´ TaqPCR MasterMix (Tiangen
Co. Ltd., China). The reaction conditions were as follows: 95 °C for 30 s followed by 28 cycles of 95 °C for 25 s, 60 °C for 45 s, and 72 °C for 20 s, and 72 °C for 1 min. The PCR products were placed in different tubes and used for 3.5% agarose gel electrophoresis (AGE). The mutation detection results could be judged by the appearance of targeted detec-tion fragments in the corresponding reacdetec-tion tubes. For ex-ample, if the targeted band only appears in lanes corresponding to “G1” and “G2,” it is considered a wild template (the base sequence of codon 12 is GGT). If the tar-geted band appears in lanes corresponding to “G1,” “G2,” and “C1”, the template of codon 12 has the heterozygosis mutation of G12R (the base sequence of codon 12 is CGT/GGT). If the targeted band only appears in lanes cor-responding to “C1”, the template of codon 12 has the ho-mogenous mutation of G12R (the base sequence of codon 12 is CGT). The rest could be judged in the same manner.
Results
Detection flow
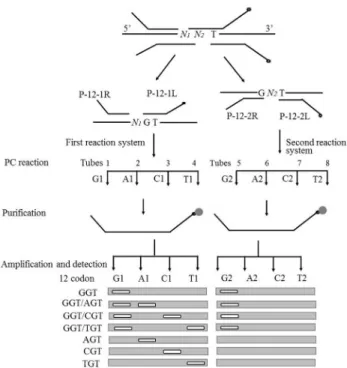
As shown in Figure 2, the entire detection process in-cludes polymerization/conjunction reaction (PC reaction), purification, amplification, and detection. During the PC reaction, each pair of detection probes corresponds to the C, T, G, and A reaction tubes. After all reaction systems were heated and denaturated to the annealing temperature, gaps corresponding to the detected mutation base were formed among different probe pairs. Each deoxyribonucleotide was correspondingly added to different reaction tubes (for example, dATP was added to tube T and dCTP was added to tube G). When the added bases were complementary to the detection templates, the corresponding pair of detection probes was connected to the conjunction-dependent probes under the effect of DNA polymerase and ligase. However,
these detection probes were not connected when the added base mismatched with the bases at the mutation sites of the template. After the PC reaction, the probes were purified using streptavidin magnetic particles. The conjunction-dependent probes were purified on the magnetic particle surface, and were used as a template. All purified products were amplified by PCR using Tag1 and CTag2. Then, the amplification products were subjected to 3.5% AGE. The mutation type was judged by the appearance of targeted bands in the corresponding lanes of the reaction tubes.
Optimization of hybridization temperature
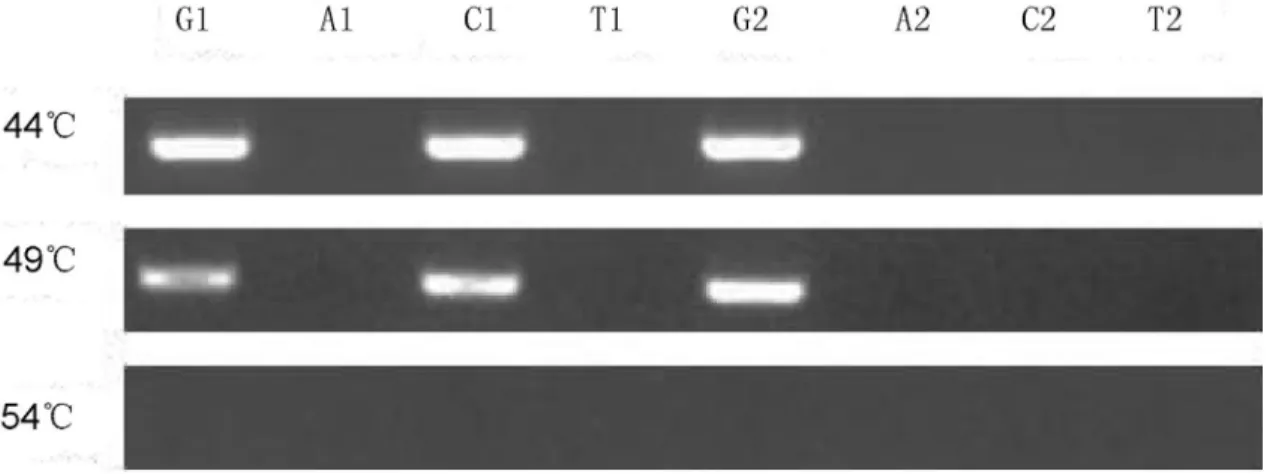
The annealing temperatures of P-12-1L (P-12-2L), P-12-1R (P-12-2R), and of the template ranged from 49 °C to 51 °C. The annealing temperature of the PC reaction was optimized using three temperature gradients: 44 °C, 49 °C, and 54 °C. The wild plasmid and mutation plasmid tem-plates of G12R were used as detection objects. The AGE re-sults are shown in Figure 3. At 44 °C and 49 °C, the amplification bands were clearly observed in lanes corre-sponding to tube C; the remaining lanes did not exhibit am-plification bands. When the annealing temperature increased to 54 °C, all lanes had no amplification bands. This finding shows that the annealing ability of probes on the detection template is negatively correlated with anneal-ing temperature. The detection probes could be annealed to the template from 44 °C to 49 °C, in order to obtain the con-junction reaction. However, these probes could not be an-nealed to the template at temperatures higher than 54 °C
due to the absence of targeted amplification bands. Hence, 49 °C was selected as the optimal temperature to achieve an effective annealing of probes on the template and a speci-ficity of the PC reaction.
Specificity of detection
The specificity of the proposed detection method was tested by determining the cycle number in the amplification reaction. Equal proportions of wild plasmid template and mutation plasmid template (G12S or G12D) were mixed, and the cycle number of the amplification reaction was set to 25 and 35. Approximately 5 mL of the amplification
products were collected from each reaction tube and used for 3.5% AGE (Figure 4). Under two circulation condi-tions, the wild-type and mutation plasmids of G12S, P-12-1L, and P-12-1R corresponded to G1, A1, C1, and T1
reac-tions. Obvious bands were detected in lanes corresponding to G1 and A1. In addition, P-12-2L and P-12-2R corre-sponded to the G2, A2, C2, and T2 reactions, and an obvi-ous band was detected in the lane corresponding to G2. Concerning wild and G12D mutations, an obvious band was detected in lanes corresponding to G1, G2, and A2. Meanwhile, nonspecific bands in other lanes were absent for 35 cycles. Hence, the proposed detection method exhib-its high specificity and amplification volume.
Sensitivity test
Different proportions of wild plasmid and mutation plasmid templates (G12S) were mixed. The proportions of the mutation plasmid template in the total detection tem-plate were set to 50, 10, 5, and 2% (Figure 5). Under all pro-portions of the mutation plasmid templates, amplification
Figure 3- Optimization of hybridization temperature. G, A, C and T represent the four reactions corresponding to each pair of detection probes.
Figure 4- Specificity detection with the PCR cycle numbers. G, A, C and T represent the four reactions corresponding to each pair of detection probes.
bands were found in lanes corresponding to C and T. With the reduction of the mutation allele (G12S), amplification bands in lanes corresponding to T darkened. However, am-plification bands were still detected in lanes corresponding to T when the proportion of the mutation allele was lower than 2%. This finding shows that the proposed method ex-hibits high sensitivity, and that it can be applied to detect mutation alleles in inhomogeneous samples.
Sample detection
The mutations of codon 12 of the KRAS gene in 72 patients were detected using the proposed method. The de-tection results were compared with the direct sequencing data (Figure 6A,B). Mutations were detected in three sam-ples: the G12S (GGT/AGT) mutation of the #17 sample, the G12R (GGT/CGT) mutation of the #51 sample, and the G12A (GGT/GCT) mutation of the #38 sample. However, these direct sequencing results did not exhibit obvious se-quencing peaks corresponding to mutation bases at codon 12 of the KRAS gene. Impure peaks corresponding to mu-tation bases were found in #17, #51, and #38 samples, and almost overlapped with the background peak. Therefore, determining the genotype according to direct sequencing results alone is difficult. These results confirm that the pro-posed method is superior to direct sequencing in terms of its sensitivity and applicability for detecting inhomogeneous samples.
Discussion
The present study established a simple and fast method for KRAS gene mutation detection based on the method for detecting EGFR gene mutations (Tanget al., 2014). The proposed detection method can detect six kinds of mutation behaviors of codon 12 through eight reactions, as well as the mutation behaviors of codons 13 and 16 using the same principle. This method is simpler and does not need expensive experimental instruments or reagents, such as fluorescent probes and high-quality detection samples, when compared to methods like fluorescent quantitative PCR, mass spectrometry, or DNA direct sequencing. The probe length is less than 50 bp, and it can detect mutation alleles using ordinary PCR instruments and AGE. Com-pared with the RFLP method, ours has no limitations on the enzyme cutting site and is more applicable for mutation de-tection under simple and conventional experimental condi-tions.
The high specificity of the proposed method can be maintained by: (1) using one pair of probes and four similar reaction systems, when detecting one single-base mutation site. Each reaction system was added with one dNTP to en-sure that the PC reaction could be accomplished only upon complementation between the added dNTP and the base at the mutation site of the detection template. In the four reac-tion systems, the PCR amplificareac-tion results of two systems could be used to determine the genotype of the mutation site, and the remaining reaction systems could be used as a control group to avoid non-specific results. (2) The PC
action can only be accomplished under the dual specificity of DNA polymerase and DNA ligase. (3) The Tm values of H1 and H2 of the detection probe differed by 11 °C com-pared with that of Tag1 and Tag2 in the amplification prim-ers, thereby reducing the mutual influence between the connection reaction and the follow-up amplification reac-tion.
This method exhibits high detection sensitivity and can detect as low as 2% mutation alleles in the mixed plasmid template where wild/mutation sites are located. Therefore, the proposed method can be used to detect muta-tions in inhomogeneous samples, design Tag1 and Tag2 on the probe sequence, and implement the secondary amplifi-cation of products after PC reaction in order to increase their numbers, resulting in a fast detection under the AGE level. Although DNA sequencing is the gold standard of mutation detection, it exhibits low sensitivity (only 20–50%; Garciaet al., 2000; Dufortet al., 2009), which is inadequate for detecting gene mutations in tumor tissues, circulating DNA samples, and other inhomogeneous sam-ples. In the present study, KRAS mutations in the samples could not be judged based on the sequencing spectra alone, because the sequencing peaks that corresponded to the mu-tation sites in the direct sequencing spectra could not be separated from the background signal. Pyrosequencing, RT-PCR, and mass spectrum detection methods exhibit sensitivity as high as 1% (Jarryet al., 2004; Dufortet al., 2009), but require an expensive detection platform, equip-ment and reagents. Hence, these techniques cannot be ap-plied under conventional laboratory conditions.
In conclusion, a method for detecting KRAS gene mutations was established based on PPC-AGE. This me-thod can be easily operated, and is applicable for inho-mogeneous samples under simple experimental conditions (e.g., ordinary nucleic acid electrophoresis and PCR equip-ment). Furthermore, this method does not need expensive experimental apparatuses and reagents. However, it cannot detect unknown mutation sites, and the detection sensitivity of AGE is limited. Therefore, this method cannot be ap-plied when the total proportion of mutation alleles in inho-mogeneous samples is lower than 2%. The proposed method has limited detection capabilities.
Acknowledgments
This research was supported by the Science and Tech-nology Project of Xiangyang City (Grant no. 201673) and the scientific research project of Hubei Province Health and Family Planning Commission (Grant no. WJ2015MB266).
References
Altimari A, de Biase D, De Maglio G, Gruppioni E, Capizzi E, Degiovanni A, D’Errico A, Pession A, Pizzolitto S, Fio-rentino Met al.(2013) 454 next generation-sequencing out-performs allele-specific PCR, Sanger sequencing, and pyro-sequencing for routine KRAS mutation analysis of
forma-lin-fixed, paraffin-embedded samples. Onco Targets Ther 6:1057-1064.
Chen J, Bi H, Hou J, Zhang X, Zhang C, Yue L, Wen X, Liu D, Shi H, Yuan Jet al.(2013) Atorvastatin overcomes gefitinib re-sistance in KRAS mutant human non-small cell lung carci-noma cells. Cell Death Dis 4:e814.
Choi HS, Min KT, Cha YS and Hong SP (2014) Multiplex detec-tion of KRAS mutadetec-tions by a matrix-assisted laser desor-ption/ionization-time of flight mass spectrometry assay. Clin Biochem 47:1091-1097.
Dobre M, Comanescu M, Arsene D, Iosif C and Bussolati G (2013) K-ras gene mutation status in colorectal cancer: Comparative analysis of pyrosequencing and PCR-RFLP. Rom J Morphol Embryol 54:567-574.
Dufort S, Richard MJ and de Fraipont F (2009) Pyrosequencing method to detect KRAS mutation in formalin-fixed and par-affin-embedded tumor tissues. Anal Biochem 391:166-168. Garcia CA, Ahmadian A, Gharizadeh B, Lundeberg J, Ronaghi M
and Nyrén P (2000) Mutation detection by pyrosequencing: sequencing of exons 5-8 of the p53 tumor suppressor gene. Gene 253:249-257.
Hamfjord J, Stangeland AM, Skrede ML, Tveit KM, Ikdahl T and Kure EH (2011) Wobble-enhanced ARMS method for de-tection of KRAS and BRAF mutations. Diagn Mol Pathol 20:158-165.
Heideman DA, Thunnissen FB, Doeleman M, Kramer D, Verheul HM, Smit EF, Postmus PE, Meijer CJ, Meijer GA and Snijders PJ (2009) A panel of high resolution melting (HRM) technology-based assays with direct sequencing possibility for effective mutation screening of EGFR and K-ras genes. Cell Oncol 31:329-333.
Hsu HC, Thiam TK, Lu YJ, Yeh CY, Tsai WS, You JF, Hung HY, Tsai CN, Hsu A, Chen HC et al. (2016) Mutations of KRAS/NRAS/BRAF predict Cetuximab resistance in meta-static colorectal cancer patients. Oncotarget 7:22257-22270. Jarry A, Masson D, Cassagnau E, Parois S, Laboisse C and Denis MG (2004) Real-time allele-specific amplification for sensi-tive detection of the BRAF mutation V600E. Mol Cell Probes 18:349-352.
Kinugasa H, Nouso K, Miyahara K, Morimoto Y, Dohi C, Tsutsumi K, Kato H, Matsubara T, Okada H and Yamamoto K (2015) Detection of K-ras gene mutation by liquid biopsy in patients with pancreatic cancer. Cancer 121:2271-2280. Kriegsmann M, Arens N, Endris V, Weichert W and Kriegsmann
J (2015) Detection of KRAS, NRAS and BRAF by mass spectrometry-a sensitive, reliable, fast and cost-effective technique. Diagn Pathol 10:132.
Lee SE, Lee SY, Park HK, Oh SY, Kim HJ, Lee KY and Kim WS (2016) Detection of EGFR and KRAS mutation by pyro-sequencing analysis in cytologic samples of non-small cell lung cancer. J Korean Med Sci 31:1224-1230.
Leiser D, Medová M, Mikami K, Nisa L, Stroka D, Blaukat A, Bladt F, Aebersold DM and Zimmer Y (2015) KRAS and HRAS mutations confer resistance to MET targeting in pre-clinical models of MET-expressing tumor cells. Mol Oncol 9:1434-1446.
Li W, Shi Q, Wang W, Liu J, Ren J, Li Q and Hou F (2014) KRAS status and resistance to epidermal growth factor receptor ty-rosine-kinase inhibitor treatment in patients with metastatic colorectal cancer: a meta-analysis. Colorectal Dis 16:0370-0378.
Lu SS, Xu X, Guo HQ, Cao J, Pan QJ and Wang MR (2013) De-tection of EGFR and K-ras mutations in non-small cell lung cancer using cytological specimens. Zhonghua Zhong Liu Za Zhi 35:585-589.
Mack E, Stabla K, Riera-Knorrenschild J, Moll R, Neubauer A and Brendel C (2016) A rational two-step approach to KRAS mutation testing in colorectal cancer using high reso-lution melting analysis and pyrosequencing. BMC Cancer 16:585.
Mascaux C, Iannino N, Martin B, Paesmans M, Berghmans T, Dusart M, Haller A, Lothaire P, Meert AP, Noel S et al.
(2005) The role of RAS oncogene in survival of patients with lung cancer: A systematic review of the literature with meta-analysis. Br J Cancer 92:131-139.
Ohba T, Toyokawa G, Osoegawa A, Hirai F, Yamaguchi M, Taguchi K, Seto T, Takenoyama M, Ichinose Y and Sugio K (2016) Mutations of the EGFR, K-ras, EML4-ALK, and BRAF genes in resected pathological stage I lung adeno-carcinoma. Surg Today 46:1091-1098.
Omidifar N, Geramizadeh B and Mirzai M (2015) K-ras mutation in colorectal cancer, a report from Southern Iran. Iran J Med Sci 40:454-460.
Tang YT, Xiao N, Li ZS, Zou JM, Cao R, Zhao XH and Shao JH (2014) Detection of mutations by fill-in ligation reaction
with enzyme-linked immunosorbent assay for rapid medical diagnosis. Biosci Biotech Bioch 78:998-1004.
Tao LY, Zhang LF, Xiu DR, Yuan CH, Ma ZL and Jiang B (2016) Prognostic significance of K-ras mutations in pancreatic cancer: a meta-analysis. World J Surg Oncol 14:146. Trujillo-Arribas E, Macher HC, Jiménez-Arriscado P, de la
Por-tilla F, Molinero P, Guerrero JM and Rubio A (2016) Scre-ening of KRAS mutation in pre- and post-surgery serum of patients suffering from colon cancer by COLD-PCR HRM. Adv Exp Med Biol 924:39-41.
Vincenzi B, Cremolini C, Sartore-Bianchi A, Russo A, Manna-vola F, Perrone G, Pantano F, Loupakis F, Rossini D, On-garo Eet al.(2015) Prognostic significance of K-Ras muta-tion rate in metastatic colorectal cancer patients. Oncotarget 6:31604-31612.
Zhang H, Song J, Ren H, Xu Z, Wang X, Shan L and Fang J (2013) Detection of low-abundance KRAS mutations in colorectal cancer using microfluidic capillary electrophoresis-based restriction fragment length polymorphism method with opti-mized assay conditions. PLoS One 8:e54510.
Zhang H, Zhang X, Wang J, Xian J, Chen X and Zhang W (2015) Comparison of high-resolution melting analysis, Sanger se-quencing and ARMS for KRAS mutation detection in meta-static colorectal cancer. Clin Lab 61:435-439.
Associate Editor: Luis F. Z. Batista