14ª Conferência da Associação Portuguesa de Sistemas de Informação (CAPSI 2014) 03 e 04 de Outubro de 2014, Évora, Portugal
ISSN 2183-489X
DOI http://dx.doi.org/10.18803/capsi.v14.30-45
30
An Integrated Model of the Human Body
António Barbeito, Escola Superior de Tecnologia e Gestão de Águeda - Universidade de Aveiro, Portugal, [email protected]
Marco Painho, Instituto Superior de Estatística e Gestão de Informação - Universidade Nova de Lisboa, Portugal, [email protected]
Pedro Cabral, Instituto Superior de Estatística e Gestão de Informação - Universidade Nova de Lisboa, Portugal, [email protected]
João Goyri O’Neill, Faculdade de Ciências Médicas - Universidade Nova de Lisboa, Portugal, [email protected]
Abstract
Currently there are digital anatomical atlases of the human body capable of providing interactively information on anatomical structures. These models, can use vector or raster representations. In both cases they present limitations. Geographic information systems (GIS) have the characteristic of operating simultaneously with spatial and alphanumeric information. GIS features give the ability to operate efficiently with spatial information and conduct spatial analyses that combine the location of objects with their alphanumeric attributes. In this work a three-dimensional GIS model of the human body was developed. The model integrates vector and matrix representations allowing the exploration of the human body, both on surface and in its interior. This system offers a high degree of interactivity and an accurate access to the information within the human body. The results demonstrated the relevance and interest of the developed system in the study of the human body.
Keywords: Anatomical atlas, 3D GIS, Vector–raster integration, Segmentation, 3D Reconstruction.
1. I
NTRODUCTIONInformation relating to the human body is usually represented in books and atlases [Yuan et al. 2008]. As information systems are designed to capture, create and distribute information [Valacich 2011], it is pertinent to consider the management of this type of information in such systems. In particular, an important feature of the anatomical information is the fact that it has a three-dimensional geometric component. Although current anatomical atlas deal with this spatial information, their models may have some limitations particularly with regard to the topological relations between the various spatial structures. These limitations are felt, for example, in terms of spatial analysis involving the model objects.
GIS are information systems that have been specifically designed to operate with spatial information providing, for this, topological data models. However, once they arise in the context of cartography, its traditional area of application is the representation of entities related to the earth's surface.
14ª Conferência da Associação Portuguesa de Sistemas de Informação (CAPSI 2014) 31 The present study evaluates the feasibility and possible advantages of using a model of the human body, built in a GIS environment, in order to be implemented in an anatomical atlas.
1.1. Models of the Human Body
The evolution from purely analogue atlases to representations in digital format brought the possibility to interact with three-dimensional models, which enhances the possibilities of study the Human Body. Effectively, the systems of representation of the human body based on three-dimensional digital models facilitate the study and understanding of human anatomy. The main advantages of these systems are the ability to interact with the object, the greater realism and detail of anatomical structures, the navigation capabilities, including the zooming tools and dynamic queries.
1.1.1 Vector Models
Usually, non-topological vector models come from computer aided design (CAD) software. These models allow making representations of the human body by using a set of geometric primitives - faces (usually triangles), points and lines - and a set of attributes defining the properties of the geometric components. The information is preferably structured in layers and the use of visual parameters allows obtaining high-quality views [Argosy Publishing 1996]. Typically, the vector representation of open surfaces in three dimensional space is achieved with the Triangulated Irregular Network (TIN) models comprising a continuous mesh of triangles. Similarly, surface models for truly three-dimensional data are also constituted by triangles (or other geometric shape) with the possibility of producing closed surfaces. However, these models do not have capabilities for spatial analysis based on topological relationships and do not allow the internal representation of the structures. The system developed by [Kim and Chung 2013] contains a vector model of the human body associated to medical information. From the geometric point of view it is a pure CAD model built in 3DS Max. Unlike purely CAD models, the vector surface model developed by [Barbeito et al. 2011] aims at the analysis of inclusion by associating an exterior normal to each triangle.
The 3D Formal Data Structure (3DFDS) topological vector model is a typically 3D GIS model used to represent three-dimensional objects. As a surface model, is not efficient in modelling phenomena that do not show well-defined borders [Abdul-Rahman and Pilouk 2008]. In particular, this model fails when trying to represent the spatial continuity of anatomical structures.
The vector representation of continuous phenomena in three-dimensional space is accomplished with 3D TIN model, also called Tetrahedral Network (TEN). It is essentially an extension of the Triangulated Irregular Network (TIN) model, considering that the triangles, 2-simplex, are converted in tetrahedra, 3-simplex. Thus, each three-dimensional object is represented by a set of adjacent tetrahedrons. TEN model, classified as a
14ª Conferência da Associação Portuguesa de Sistemas de Informação (CAPSI 2014) 32 geological model, was introduced with the explicit goal of overcoming some of the limitations of the 3DFDS model [Wang et al. 2006]. It consists of four objects: body (consisting of tetrahedra), surface (consisting of triangles) line (consisting of arcs) and points (materialized by nodes). The topological relations are given by the adjacency between spatial objects. This is a particularly important model because, as mentioned [Abdul-Rahman and Pilouk 2008], TEN model has been identified as the most appropriate to represent 3D objects.
1.1.2 Raster Models
Contrary to the vector model, the raster model uses an initial partition of geographic space. This model converts discrete or continuous phenomena into discrete units. Thus, the geographic space is decomposed into cell matrices, called pixels (2D) or voxels (3D), on which the phenomena are represented. In the two-dimensional context [DeMers 2002] refers to the widespread use of square cells, despite the existence of other possible shapes (eg, triangles, parallelograms or hexagons).
Like in 2D, 3D raster models have great simplicity but are inefficient with regard to the volume of generated data. Therefore, it is customary to use compression algorithms on this data type.
Despite raster models effectively materialize the concept of field (spatial continuity) when the topological queries are a fundamental requirement, it is necessary the use of vector data models [Heywood et al. 1998]. Currently, the raster models are very important in medical applications because the scanning systems, that take information from interior of the human body, provide large volumes of data in this area.
There are also many applications that use data from medical imaging. These applications process the original data in view of the representation and interpretation. As a result, it is possible to obtain three-dimensional reconstructions of the human body. The work of [Vongkornvoravej et al. 2006] clearly shows the construction of a database that receives a 3D model based on voxel data, which can be viewed as an embryonic raster GIS.
1.1.3 Integrated Models
[Spanel and Krsek 2006] indicate that the raster data from the imaging are not suitable for three-dimensional modeling, so that segmenting algorithms are developed. This procedure allows to build three-dimensional vector objects that model the anatomic structures. The work of these authors shows the construction of an integrated non-topological vector-raster model. However, the lack of three-dimensional topological data models specifically designed for the representation of the human body in GIS is described by [Suwardhi and Setan 2006]. This observation reflects the demand for GIS for this type of representations.
14ª Conferência da Associação Portuguesa de Sistemas de Informação (CAPSI 2014) 33 The simultaneous need for topological relationships and representation of continuous structures could advise the use of a three-dimensional vector model such as the TEN model. However, when the input data are presented in raster format, using a TEN model has some limitations:
The need to rebuild a second model to represent the continuous structures;
The increased complexity of the new model relative to the model initially available;
Degradation of the initial data when producing the tetrahedrons mesh from the voxel matrix.
A possible solution to accomplish the various requirements set out in order to circumvent the limitations of the various models described, is the integration of raster and vector models. While the internal representation of the anatomical structures is the responsibility of the raster component, the vector component will be responsible for representing the external surfaces and build topology inherent in the model.
Integrated models are not unheard to GIS, particularly for 3D GIS. Effectively, 3D GIS integrated models are often found in the representation of land surface and underlying geological structures. Some of the integrated models in 3D GIS and respective application areas are identified by [Wang et al. 2006].
3D GIS integrated models could be applied in many distinct areas, however, as a recent tool, they are quite unknown in these potential areas. Moreover, the complexity of these models and the fact that an optimal model for the various applications does not exist, hinders the dissemination and recognition of its potential. Thus, it is usual to find integrated 3D GIS models developed only under very specific applications. The 3DTM exemplifies one of these integrated models that aims to expose mining to 3D GIS [Duncan and Abdul-Rahman 2013].
1.1.4 Proposed Model
The models available in the anatomical atlases fall into two groups: vector or raster.
Vector models are used to represent the external surfaces of the anatomical structures. As is usual in GIS and CAD models, the information is structured in layers. They have the ability to integrate topological information although this integration does not take place, making them closer to the CAD models. These vector surface models allow to perform "Select by Attributes" operations, retrieve alphanumeric information by pointing the geometrical component (and vice versa) and independent manipulation of layers.
The raster models are used to represent the interior of the anatomical structures. Its current relevance stems largely from the fact that there are numerous sources of data based in this format. They have simpler data structures than vector models and allow the representation of continuous space phenomena. However, their
14ª Conferência da Associação Portuguesa de Sistemas de Informação (CAPSI 2014) 34 topological features are more limited, the representation of objects by its boundaries is not as efficient and the volume of data is substantially greater.
The absence of topology and the lack of integrated vector-raster models in current anatomical atlases leads to several limitations, namely:
The capacity to visualize the surface and the internal components of the model; The capacity to realize identification operations over the components of the model; The capacity to perform analyses based on topological data, for example:
o Perform measuring operations along elements that contain branches (connectivity topology); o Find which structures touch or are near a given structure (neighbourhood topology);
o Identify the structures contained in a certain volume or crossed by a needle (containment topology);
More generally, the capacity to perform "Select by Location" operations.
Thus, many of the functions found in GIS are not available in the anatomical atlas, which limits the capabilities of interaction, manipulation, navigation, analysis and study of the human body, as intended with the anatomical atlas.
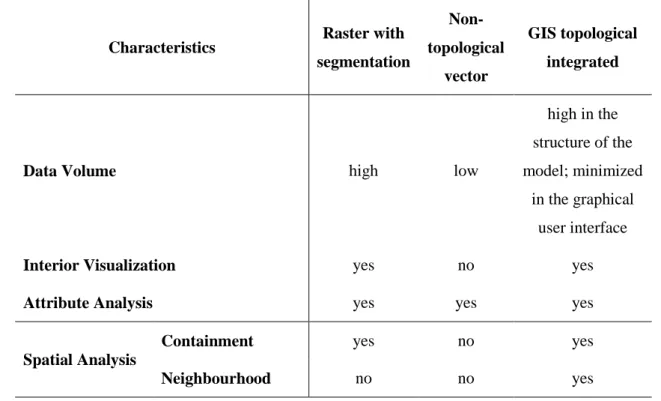
Table 1 compares some relevant characteristics of three types of models: raster, non-topological vector and integrated topological GIS. The potential of the GIS integrated model is demonstrated in this table and, therefore, the advantages in using such model in anatomical atlases.
Characteristics Raster with segmentation Non-topological vector GIS topological integrated
Data Volume high low
high in the structure of the model; minimized
in the graphical user interface
Interior Visualization yes no yes
Attribute Analysis yes yes yes
Spatial Analysis
Containment yes no yes
14ª Conferência da Associação Portuguesa de Sistemas de Informação (CAPSI 2014) 35
Connectivity no no yes
Identification
By structure yes yes yes
By surface region no yes yes
By interior region yes no yes
Table 1 – Comparison between models for the human body representation. The model developed in this study consists of 4 main components:
Surface Vector; 3D RGB matrix; 3D Mask matrix;
Attribute table(s), connected to spatial component.
The vector component consists of a closed three-dimensional surface modelling the human body surface. This surface consists of a triangles mesh. The structure of the model stores the positions of the vertices and an identification number for each triangle along with the numbers of its vertices.
The 3D RGB matrix contains voxels with colour information of the interior of the body. This matrix reflects the three-dimensional rearrangement of the input data (the slices sequence).
The 3D Mask (raster) matrix is obtained by the segmentation of the body. In one hand, it has the containment topologic information and, on the other hand, constitutes the connection between the raster and the vector components. The Mask matrix stores the identification numbers of the structures: in terms of GIS language, this is a matrix that contains the identification of the layers of the system. In the present work, this layer matrix distinguishes the interior and the exterior of the body.
Attribute tables contain alphanumeric information about the spatial objects represented in the model. The link between the geometric components and alphanumeric attributes is made through a common field. The voxels in the 3D Mask matrix can contain a value which is registered in the attribute table along with the other proper attributes.
14ª Conferência da Associação Portuguesa de Sistemas de Informação (CAPSI 2014) 36
2. D
ATA ANDM
ETHODS2.1. Data
The data used in this study consists of 1878 anatomical axial RGB images – raster data - of the male, representing the entire human body. The images are 24-bit of depth colour, spaced 1 mm along the Z axis, and a pixel of 0.33 mm in the XY plane.
These data come from the Visible Human Project (VHP) [Ackerman 1994], which is conducted by the U.S. National Library of Medicine and implemented at the University of Colorado's Health Sciences Center.
2.2. Methods
The present work was geared towards designing and implementing an integrated GIS model whose components allow (1) the implementation of the topological relationships in the model structure, (2) the interactive visualization of the internal anatomical structures and (3) the implementation of identification functions through the geometric-alphanumeric components linkage.
The methods described in this section relate to the flow of operations conceived to build the components of the proposed model described in section 1.1.4 from the input data. The conceptual model is built by the process shown in Figure 1.
Figure 1 - Process for obtaining the conceptual model.
The first step to obtain the 3D Mask matrix is the segmentation of the human body. For this, it is necessary to extract the human body of the surrounding area, consisting of blue gel.
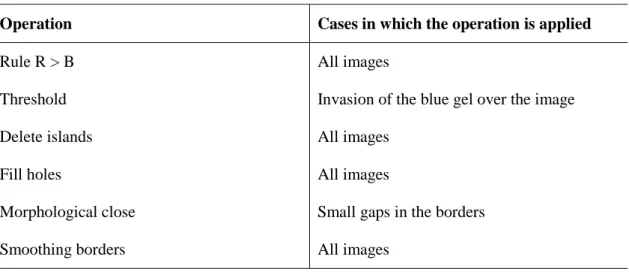
The segmentation is a recursive process in which the general rule R > B (red greater than blue) is applied. Some additional adjustments were made to deal with specific errors or noise in input data. Additional operations used in the segmentation process include: applying a threshold; eliminating noise (islands) outside the body area; filling holes inside the body; applying morphological close operations (a dilation followed by an erosion); smoothing the external border of the body. Table 2 shows the cases in which the operations constituting the segmentation procedure were used.
14ª Conferência da Associação Portuguesa de Sistemas de Informação (CAPSI 2014) 37 Operation Cases in which the operation is applied
Rule R > B All images
Threshold Invasion of the blue gel over the image
Delete islands All images
Fill holes All images
Morphological close Small gaps in the borders
Smoothing borders All images
Table 2 – Operations used in the segmentation procedure
After the segmentation step, a 3D voxel structure is built from the segmented slices in order to obtain the 3D Mask matrix. From this matrix a point cloud is obtained by extracting the border voxels. More precisely, a file with the three-dimensional coordinates of these voxels is produced. This file constitutes the input data for the 3D reconstruction process that leads to the final vector model.
The vector surface consists of a mesh of triangles obtained by a 3D reconstruction Poisson algorithm. A particular screened Poisson reconstruction developed by [Kazhdan and Hoppe 2013], which incorporates the surface points as interpolation constraints, is used. These authors show that the screened Poisson technique improves fit accuracy and sharpens the reconstruction without amplifying noise.
The Poisson reconstruction algorithm needs oriented points as input, that is, beyond the point cloud, normal directions are required. First of all, a horizontal normal vector is determined for each point in each horizontal plane. The direction of the vectors corresponds to the composition of the normal directions to the segments joining the actual point to its neighbours on either side. In a second phase, each point is joined to its nearest upper and lower neighbours, which determines the vertical direction by composing the vertical components of the normal vectors. The final direction at each point is the combination between the horizontal and vertical directions.
The value of the point weight, requested in the screened Poisson algorithm, was determined on a recursive empirical basis.
After developing the model, a prototype was built. The prototype includes a graphical environment in which the model is embedded, as well as functions developed to operate and test the model. Two main functionalities were developed along with the model: The interactive visualization of the interior of the body and an identification function.
14ª Conferência da Associação Portuguesa de Sistemas de Informação (CAPSI 2014) 38 The interactive visualization of the interior of the body is based on the following sequential procedure:
Interactive identification of three non-coplanar points on the body surface so as to define a cutting plane;
Elimination of the triangles that are strictly above the plane
Identification of the triangles of the vector model involved in intersection with the cutting plane; Definition of the cut lines in the triangles involved;
Elimination of the geometric figures above the cut line;
Readjustment / reconstruction of new triangles: when the shape below the intersection line is a quadrilateral, two triangles are built instead.
Placing the cutting plane on temporary model;
Rendering of the cutting plane by interpolating the 3D RGB matrix;
To render the cutting plane, sampling points with the same resolution as the initial data are placed on the plane. Finally, each point is interpolated by using a 26-neighbourhood in the 3D RGB matrix.
Through the visualization procedure, initiated by defining a cutting plane, raster-vector integration, which occurred at the level of the data structure of the model, also occurs at the visual level. This means that only the raster portion corresponding to a possible cutting plane is placed on the visual interface, which allows to reduce the weight of the data in this interface.
Besides the visualising functionality, identification functions were also developed. Identification functions retrieve information contained in the attribute tables by pointing the graphical components. This can be done at the level of the geometric objects (vector boundaries), vertices of the surface model or voxels of the raster component. In the present model the identification function is tested at the level of the voxels. For this, each voxel position is associated to the corresponding information in the context of an attribute table. In turn, the attribute table can contain internal information or links to external documents.
3. R
ESULTSIn this section two types of results are distinguished, (1) the intermediate results obtained during the reconstruction process of the model and (2) the final results obtained using the model, which are, essentially, the visualizations of the interior of the human body and the identification of structures on the raster component that covers the cutting plane.
14ª Conferência da Associação Portuguesa de Sistemas de Informação (CAPSI 2014) 39
3.1. Segmentation of the human body
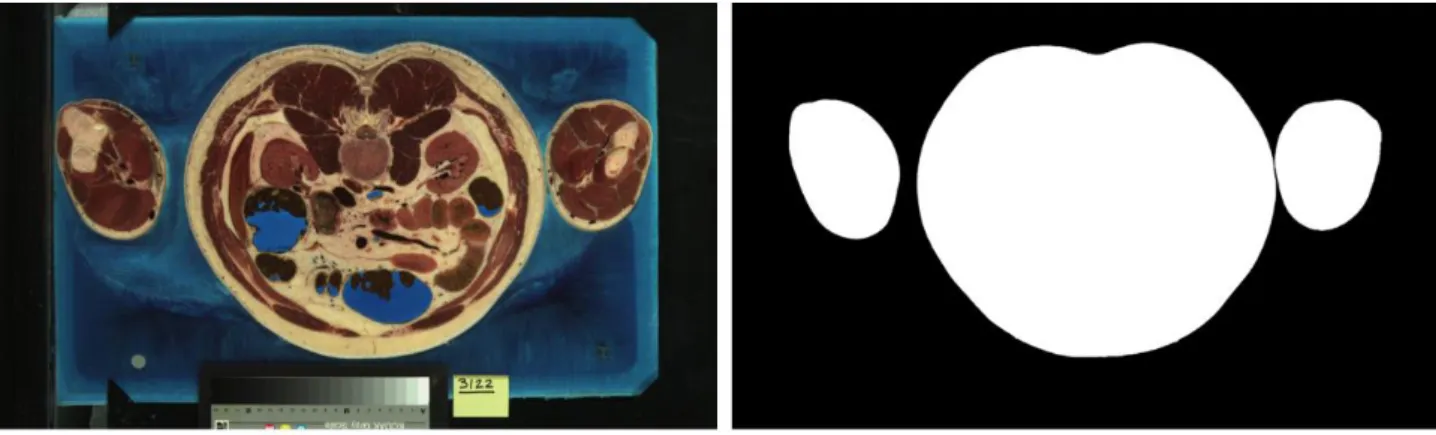
The result of a segmented slice is shown in figure 2. This is a case were no relevant noise occurs, so that, segmentation was carried out with the common operations described in table 2: Rule R > B; Delete islands; Fill holes; Smoothing borders.
Figure 2 – The segmentation process of the human body: input data and the respective mask.
Figure 3 shows an example where an additional operation (a threshold value of 0.3) was applied to deal with noise caused by the blue gel over the body region.
Figure 3 – The segmentation process with an additional threshold.
3.2. Reconstruction of the 3D Model
The vector surface model of the human body, obtained through the 3D reconstruction screened Poisson algorithm, is shown in figure 4. The screened Poisson point weight parameter was determined by visual assessment of the model. Starting from zero (which corresponds to the unscreened Poisson algorithm), a final value of 4 is achieved.
14ª Conferência da Associação Portuguesa de Sistemas de Informação (CAPSI 2014) 40 Figure 4 – 3D screened Poisson reconstruction from the point cloud.
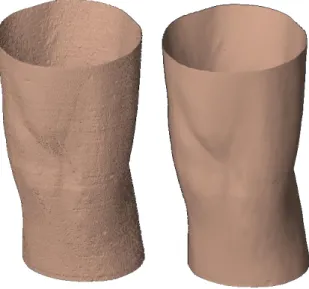
To overcome the initial pixelated appearance of the surface component, the number of triangles in the final model is reduced. The combination of this reduction with the smoothing of the boundary points gives a more realistic appearance to the model (figure 5).
14ª Conferência da Associação Portuguesa de Sistemas de Informação (CAPSI 2014) 41 Figure 5 – The effect of smoothing border points and reducing the number of triangles: (a) surface without smoothing/
reducing; (b) surface with smoothing / reducing.
3.3. Interior Visualization
The interior of the body is accessed through the definition of cutting planes. The steps of the procedure to visualize the interior of the body are depicted in figure 5.
Figure 5 – Interior visualization: (a) Definition of the cutting plane; (b) Eliminating triangles; (c) Adjusting involved triangles; (d) Rendering cutting plane.
To render the cutting plane, three interpolation methods are tested: (1) Nearest neighbour; (2) Linear and (3) Cubic. Nearest neighbour method was discarded due to a banding effect noticed in some interpolations. The
14ª Conferência da Associação Portuguesa de Sistemas de Informação (CAPSI 2014) 42 high density of the interpolating 3D RGB matrix leads to similar results for the other two methods, therefore the linear interpolation was implemented since it is less computationally demanding than the cubic interpolation.
3.4. Identifying structures in the cutting plane area
GIS connects spatial information with alphanumeric attributes. Once the connection is stablished, it is possible to retrieve alphanumeric information by identifying the geometric component.
In the present work two distinct identification functions were locally built. The first function connects values in the 3D Mask matrix with the name/description of the corresponding structures. The second function connects the 3d Mask values to specific hyperlinks, so that, pointing a geometric structure causes a web page opening.
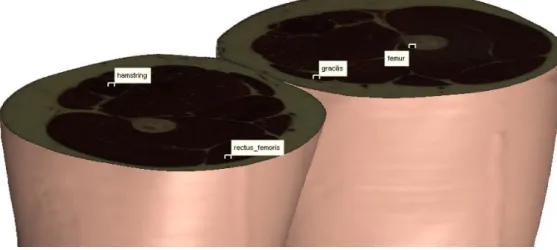
In figure 6 several points on the cutting plane were identified and the associated information is shown.
Figure 6 – Identify function.
Figure 7 shows an identification function connecting the geometric component to a page of a document in the web [Open Library 2006].
14ª Conferência da Associação Portuguesa de Sistemas de Informação (CAPSI 2014) 43 Figure 7 – Identify function: connection to an external document in Open Library web page.
4. C
ONCLUSIONS4.1. Present Work
As shown in the results section, the developed model allows to exploit the interior of the human body with a high degree of interactivity. The two main functionalities of the system are the visualizations specified by the user and the identifications made on the raster component. The alphanumeric information can be built into the system itself, or it may be external. In the latter case, it is accessed through hyperlinks defined in the attribute table. Once implemented the mechanism of cutting planes, it is possible to visualize the internal structures and retrieve information from the human body with a high degree of accuracy, which meets the objective of the present work.
Compared with surface vector models which, by their very nature, are hollow, the developed model allows to visualize the interior of the human body. Due to the data used, it is a fairly realistic visualization.
Regarding raster models, the present model, by integrating vector and raster components, presents the typical capacities of these two components. Thus, the model is prepared for the development of topological components that allow performing spatial analysis (e.g., inclusion or neighbourhood analysis) or measuring distances along anatomical structures, which are unusual features in raster models.
Finally, the inclusion of an integrated model in an anatomical atlas allows to exploit the capabilities listed in table 1, which are not normally available on these platforms. For example, the anatomical atlases provide a finite number of images of the human body, while the present model allows to display any required region.
14ª Conferência da Associação Portuguesa de Sistemas de Informação (CAPSI 2014) 44
4.2. Future Work
Following this work, the segmentations of various anatomical structures should be continued. For each segmented structure a 3D model should be reconstructed. This means that each anatomical structure corresponds to a layer of information and will have a similar model to the global model of the body developed in the present work. This approach will create a multilayer system centred on individually segmented anatomical structures. Being the model made up of several vector objects, it becomes advantageous building the topological relationships between objects.
The improvements to be implemented in the model favour the development of new GIS features, including measurement and spatial analysis (the latter made possible by topological component). This GIS environment takes better advantage of the features of the model, allowing a more efficient and substantial study of the anatomy of the human body, as intended with the use of anatomical atlases.
R
EFERENCESAbdul-Rahman, A. and Pilouk, M., Spatial data modelling for 3D GIS, Springer, 2008.
Ackerman, M., The Visible Human Project, U.S. National Library of Medicine, http://www.nlm.nih.gov/research/visible/visible_human.html, (2 June 2014), 1994.
Argosy Publishing, inc., The Visible Body, http://www.visiblebody.com/index.html (2 June 2014), 1996. Barbeito, A., Cabral, P. and Painho, M., “Human body modeling in geographic information systems”,
Information Systems and Technologies (CISTI), 1, 6 (2011), 110-115. DeMers, M., GIS Modeling in Raster, John Wiley and Sons, Inc, 2002.
Duncan, E. and Abdul-Rahman, A., “3D GIS for mine development – integrated concepts”, International Journal of Mining, Reclamation and Environment, (2013), 1-16.
Heywood, D. Cornelius, S. and Carver, S., An introduction to geographical information systems, Addison Wesley Longman, 1998.
Kazhdan, M. and Hoppe, H., “Screened Poisson surface reconstruction”, ACM Transactions on Graphics, (2013).
Kim, S.-H. and Chung, K.-Y., “Medical information service system based on human 3D anatomical model”, Multimedia Tools and Applications, (2013), 1-12.
14ª Conferência da Associação Portuguesa de Sistemas de Informação (CAPSI 2014) 45 Spanel, M. and Krsek P., “Vector-based Medical Image Segmentation using Adaptive Delaunay
Triangulation”. Sixth IASTED International Conference on Visualization, Imaging, and Image Processing, (2006).
Suwardhi, D. and Setan, H., “3D Geo-database Implementation using Craniofacial Geometric Morphometrics Database System”, In Innovations in 3D Geo Information Systems, (2006), 279-294.
Swartz, A., Open Library, https://openlibrary.org, (2 June 2014), 2006.
Valacich, J.S. and Schneider, C., Information Systems Today, Prentice Hall: Englewood Cliffs, 2011.
Vongkornvoravej, P. Roongmangsorakarn, S. Chaisaowong, K., Segmentation of Medical Images from Computerized Tomography to Create a 3-Dimensional Model of Human Skull, King Mongkut’s Institute of Technology North Bangkok, 2006.
Wang, Y. Wu, L. Shi, W. and Li, X., “3D integral modeling for city surface & subsurface”, Innovations in 3D Geo Information Systems, (2006), 95-105.
Yuan, Y. Qi, L. N. and Luo, S. Q., “The reconstruction and application of virtual Chinese human female”, Computer Methods and Programs in Biomedicine, 92, 3 (2008), 249-256.