Journal of Food Engineering 31 (1997) 125-136 0 1997 Elsevier Science Limited
ELSEVIER
Printed in Great Britain. All rights reserved PII:SO260-8774(96)00075-l 0260-8774/97 $17.00 + 0.00
Dimensionless Analysis of the Flow of Spherical Particles in
Wo-phase Flow in Straight %bes
Paulo N. Baptista,” Fernanda A. R. Oliveira,” * Jorge C. Oliveira”
& Sudhir K. Sast$
“Escola Superior de Biotecnologia, Universidade Cat6lica Portuguesa, Rua Dr. Ant6nio Bernardino de Almeida, 4200 Porto, Portugal
“Ohio State University, Agricultural Engineering Department, 590 Woody Hayes Drive, Columbus, OH 43210, USA
(Received 15 June 1996; accepted 13 September 1996)
ABSTRACT
In the aseptic processing of particulate fluid foods, the residence time
distribution of particles and the fluid-to-particle heat transfer are intimately related to the linear and rotational velocities of the particles. The development of models correlating these velocities with fluid and particle characteristics and with operating conditions is therefore very useful, as it provides a fast method to estimate fluid-to-particle heat transfer coeficients without measuring the actual particle velocities. The models can further be used to estimate the average residence time of the particles. Data for modelling particle linear and rotational velocities were obtained by videotaping the flow, along the wall, of individual spherical particles in transparent 2-m long straight tubes. Linear and rotational velocities were correlated with generalized Reynolds, Archimedes and Froude
numbers, to the particle-to-@id density simplex and to the particleltube
diameter ratio. The models obtained had correlation coefficients of 0.89 and 0.86 for the particle linear and rotational velocities, respectively. @ 1997 Elsevier Science Limited. All rights reserved
NOMENCLATURE Particle diameter (m)
Tube diameter (m)
g Acceleration of gravity (m/s*)
*To whom correspondence should be addressed (Fax: 351-2-590351). 125
126 P IV Baptista et al.
I Upward tube inclination (“)
K Consistency coefficient (Pa s”)
n Flow behaviour index
Vf Average fluid velocity (m/s)
VP Particle linear velocity (m/s)
“Pn Normalized particle velocity
Dimensionless numbers
Ar Archimedes number = (PfPp-Pf) sin (I) gdz/$
Fr Froude number = vzigd,
R% Generalized Reynolds number = (8pfv2P”di)/{2” K[(3n+l)/n]“)
Greek Letters
a Simplex of density = (pp - pf)/pf)
Pe Effective fluid viscosity = pfvfdp/Re, (kg/m s)
Pf Fluid density (kg/m”)
PP Particle density (kg/m”)
0 Particle rotational velocity (m/s)
0” Normalized particle rotational velocity
INTRODUCTION
The application of continuous thermal processing to particulate fluid foods has been widely studied in the last decade. The modelling of particle flow in solid-liquid suspensions is essential for the estimation of both particle residence time and fluid- to-particle heat transfer coefficients, the key factors in this field. Several works focus on particle flow using different approaches, such as the Danckwerts (1953) residence time distribution (RTD) concept, theoretical modelling based on fluid mechanics and empirical correlations.
Taeymans et al. (1985) used the RTD concept to study the flow of particles in scraped-surface heat exchangers. This concept, widely used in the chemical engineering field, was later applied by a number of researchers to different continu- ous processing systems (e.g. Berry, 1989; Singh & Lee, 1992; Palmieri et al., 1992; Abdelrahim et al., 1993; Baptista et al., 1994; Sandeep & Zuritz, 1994).
Sastry & Zuritz (1987) developed a mathematical model for particle flow in a straight tube. In this work the particle motion was described as a result of buoyancy, drag and Saffman and Magnus lift forces. Later, Dutta & Sastry (1990) extended this model to account for the reaction and wall friction forces that might affect the particle movement when in contact with the tube wall, Similar models may be found for the description of particle-fluid flow in other engineering fields (e.g. Durst et al., 1984; Sommerfeld, 1990; Meng & van der Geld, 1991; Asakura et al., 1991). These models are very complex, requiring the knowledge of a number of parameters such as momentum diffusion coefficients for the mixture, the specific interaction forces, the slip velocities between liquid and solid phases and the velocities of the liquid and of the mixture phase, making the result often difficult to apply in practice.
Dimensionless analysis may be used as an alternative way to describe such com- plex physical phenomena. Nesaratnam & Gaze (1987) correlated particle linear
Flow of spherical particles 127 velocity of spherical (pea) and cubic (carrot) particles with the particle Froude and Reynolds numbers. The model reasonably predicted the particle velocity for high Froude numbers, whereas a large scatter was found for low Froude numbers. Dutta & Sastry (1990) developed dimensionless correlations to predict the particle/fluid velocity ratio as a function of the particle Froude number and of a dimensionless viscosity, which included rheological characteristics of the fluid, fluid density and velocity. In this work, low-concentration suspensions (up to 0.81 vol.%) of spherical particles were used and it was concluded that the main effect was due to the dimensionless viscosity. In other engineering fields, similar work has been developed, although for particles much smaller than the usual size in particulate fluid foods. Ohashi et al. (1980) developed dimensionless correlations for horizontal and vertical flow of low concentration (up to 5 vol.%) of fine particle suspensions (diameters between 321 and 1840 pm). These correlations included the particle Reynolds number based on the terminal settling velocity in the stagnant fluid, and a Froude number based on the suspension average velocity and on the tube diam- eter. Okuda (1981) verified that the particle/fluid velocity ratio was mainly dependent on the particle Froude number and on the ratio between particle and tube diameter for spherical particles (diameter between 6 and 38 mm) in suspen- sions up to 5 vol.% solids concentration.
All the above-mentioned works describe the particle flow in terms of its linear velocity. However, the velocity profile of the fluid also imparts a rotational motion to the particle that is very likely to affect the heat transfer between the particle and the fluid (Zitoun & Sastry, 1994). In spite of the importance of this motion, no literature could be found on the estimation of the particle rotational velocity. The main objective of this study was to develop dimensionless correlations to predict linear and rotational velocities of single particles flowing close to the wall in straight tubes. The influence of the parameters that are expected to affect particle motion the most were analysed: flow rate, fluid viscosity, diameter and density of the particles and upward inclination and diameter of the tube.
MATERIALS AND METHODS
The particles and the fluid
Spheres of polystyrene and of acetal (Hoover Precision Products, Inc., Sault Ste Marie, MI, USA) with a density of 1.065 & 0.015 g/cm” and 1.425 kO.005 g/cm3, respectively were used. The liquid phases were sodium carboxymethylcellulose (CMC) solutions (0.1-0.3 wt%). The rheological properties of the CMC solutions were determined experimentally with a coaxial cylinder viscometer (Contraves
RHEOMAT Model 115, Contraves AG, Zurich, Switzerland). A power-law model
could be used to fit all the data, with flow behaviour indices between 0.71 and 1.00 and fluid consistency coefficients between 0.0020 and 0.106 for a shear rate range between 6.65 and 1008 s-‘. Because fluid viscosity is dependent on these two rheological parameters, an effective viscosity, pe (Grabowski & Ramaswamy, 1995) was considered throughout the work. This is the viscosity of a Newtonian fluid having the same Reynolds number. Density was found to be independent of the CMC concentration and equal to 1.00 +O.Ol g/cm3.
128 II N. Baptista et al.
Experiments
The particle flow was analysed in transparent straight glass tubes (2.0 m long). A T- tube was fitted at the inlet to introduce the particles into the system. The CMC solution was recycled using a rotary lobe pump (on-line model OL1/0004/15, John- son Pump Ltd, UK), while particles were recovered in a net at an intermediate tank at the outlet of the tube. Tubes with different diameters (2.2 and 5.1 cm) were easily used and different tube upward inclinations were also tested. For each experiment, the flow of a single particle along the bottom of the transparent tube was video- taped. The linear velocity of the particle (v,) was determined by playing the videotape in slow motion and measuring the time necessary for the particle to travel a certain length of the transparent section. In the same length and time interval the rotational velocity of the particle (0) was measured by counting the number of rotations of a line drawn circumferentially around the particle. Velocities were measured at different sections to ensure the constant velocity of the particle.
The experiments were conducted at room temperature (c. 22”C), covering a total of 131 different combinations of the selected variables: average fluid velocity in the tube (vr), effective viscosity (cl& of the fluid, diameter (dp) and density (p ) of the particles and diameter (d,) and upward inclination (I) of the tube. Table 1 SLOWS the range of values, as well as the number of levels, used for each variable. For each set of experimental conditions, six replicates were performed.
Data analysis
The particle linear and rotational velocities were normalized by the average fluid velocity (vpn = v,/vr; w, = o/i+). The correlations were developed in terms of these dimensionless velocities and of different dimensionless numbers, expected to be relevant for solid-fluid flow: generalized Reynolds number (Re,), Archimedes number (Ar) and Froude number (Fr). The Archimedes number was modified to include the effect of tube inclination. This number was developed for fluidization (Brodkey & Hershey, 1988) and was later used by Grabowski & Ramaswamy (1995) to predict the incipient or start-up velocity for a particle to flow in particulate suspensions in a holding tube. Re, and Fr were also included in the models because they account for many of the forces involved in the particle movement: Re, repre- sents the ratio between inertial and viscous forces, while Fr is related to the ratio of inertial to gravitational forces (Brodkey & Hershey, 1988). Other dimensionless ratios were also included in the correlations: the simplex of density (a) (Grabowski & Ramaswamy, 1995) and the particle/tube diameter ratio (d&f,). Several multiple linear and non-linear regressions were tested using the Statistica software (Stata 3.0,
TABLE 1
Range of Variables used in the Modelling of Particle Linear and Rotational Velocities
hiable level Minimum Maximum “f (m/s) 0.119 0.702 PP (glcd) 1.065 1.425 4 4 (mm) (mm) 6.35 22.0 25.4 50.8 X (kg; s) 1.19 0.0020 8.21 0.0457
Flow of spherical particles 129 Computing Resource Center, 1992). The data were fitted to a model including all dimensionless groups with a multi-parameter regression:
vPn (or 0,) = a RehArcFrd ae (d,/d$ (1)
Another alternative for fitting the data was a second-order polynomial model, using the variables tested rather than the dimensionless numbers:
\/pn
(or 0,) = i5
bi,jXiXj;=I j=l
(2)
where bi,j stands for the model coefficients and x are the several variables (vr, /A~, tan(Z), a, d,/d,). By performing a stepwise regression, it was possible to select the relevant terms of eqn (2) to create a simpler model. To assess and compare the different models, regression coefficients and average percentage differences between estimated and experimental values were computed. Furthermore, the error distribu- tion was analysed and cross-validation, as described by Walpole & Myers (1993) was applied. For this purpose, prediction coefficients were calculated. These coeffi- cients are related to the ability of the models to predict new data and may be used as a criteria for model selection (the higher the coefficient, the better the model).
RESULTS AND DISCUSSION
The experiments were performed in both laminar and transient flow regimes. The normalized particle linear velocity varied between 0.27 and 1.27, being in general lower than unity. Under some experimental conditions the particles showed almost no rotational movement. For values of the normalized rotational velocity ~0.1, the scatter of the experimental data was very high and therefore these values (11 experiments) were not considered for the development of the correlations. In the remaining experiments, values of the normalized rotational velocity up to 0.86 were obtained. The range of dimensionless numbers and dimensionless ratios obtained is shown in Table 2.
The dimensionless analysis [eqn (l)] led to the following results: Vpn = 0.77 Re~.“53Fr0.“92Ar0.0’ 1 c1 -0.28
(3)
TABLE 2
Range of Dimensionless Numbers used in the Modelling of Particle Linear and Rotational Velocities
fXI1ensionless number Re, Ar Fr M d&t
Minimum 62 7.4 0.035 0.065 0.216
130 I! N. Baptista et al.
o” = 0.23 &,;.%j+. - 0.2SAr - 0.083 ao.50
The regression coefficients were respectively 0.89 and 0.86, and the prediction coefficients were respectively 0.83 and 0.80. The average difference between esti- mated and experimental values was 13.3% for the linear velocity and 20.4% for the rotational velocity, and a random distribution of the errors was verified in both cases.
The stepwise regression of eqn (2) led to the following results:
vpn = 1.4vr-0.00478a+2.4 +26 tan(l)-0.93vz+7.41e-06a2
co, = 0.00442cc+O.750
+84.3(tan Z)’
These correlations had regression coefficients of 0.99 and 0.97 respectively and
(6)
the prediction coefficients were respectively 0.90 and 0.77. The average difference between estimated and experimental values was 9.9 and 19.1% respectively for linear and rotational velocities, and the errors were also randomly distributed.
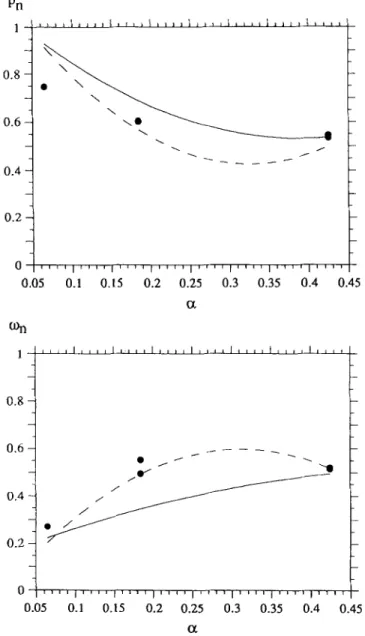
Although the second-order polynomial models show better correlation coefficients compared with the dimensionless correlations, in terms of prediction the results are very similar, as shown by the prediction coefficients. This is particularly noticeable for w,. A detailed analysis of the model predictions is shown in Figs 1-4, for typical examples of the effect of the particle/tube diameter ratio, the simplex of density, the fhtid effective viscosity and the fluid average velocity respectively, on the normalized particle linear and rotational velocities.
Dimensionless correlations are based on the dynamic similarity principle and they can be expected to provide much better consistency in scale-up. Therefore, eqns (3) and (4) would seem preferable for describing the results. A good example of the better insight offered by the dimensionless correlations is the absence of fluid viscosity in the multi-parameter correlation to predict normalized linear velocity [eqn (5)], which th ere f ore would never consider a viscosity effect. If one looks at the corresponding dimensionless correlation [eqn (3)], this result may be easily explained by the fact that an increase in viscosity promotes a decrease in both Re, and Ar. Therefore, for some ranges of these numbers the effect of viscosity may not be noticeable, but a significant effect may arise for other ranges.
Figure 1 shows that both vpn and w, increase with increasing dJd, ratio, an effect adequately predicted by both types of correlations.
Figure 2 shows the effect of the simplex of density, where the decrease in I”,,” and increase in w, with increasing simplex are slightly better described by the dimension- less correlations [eqns (3) and (4)] for the intermediate value. The fact that w, increases while vpn decreases is probably related to the increasing density difference,
Flow of spherical particles 131
causing better contact between the particle and the wall. In this situation, the particles roll perfectly over the tube wall surface and w, approaches vpn, which is visible in Fig. 2(a) and (b).
The effect of fluid viscosity is very mild, with increasing viscosity promoting only
l-I
0.8 ..j j 0.4 - , ’ l -0 0.2 - ? 0.2 0.3 0.4 0.5 0.6 0.7 dp&Fig. 1. Influence of particle/tube diameter ratio for a fIxed set of conditions (vr = 0.13 m/s, CI = 0.425, I= 8.21”, pe = 0.0030 kg/m s): ( a normalized particle linear velocity; (b) normal- )
ized particle rotational velocity. -, Dimensionless correlation; - - -, polynomial correlation; l , experimental data.
132 I? N Baptista et al.
a slight decrease in o,, as shown in Fig. 3. This corresponds to the fact that increasing viscosity leads to better lubrication between the particle and the wall, that is, increasing slip.
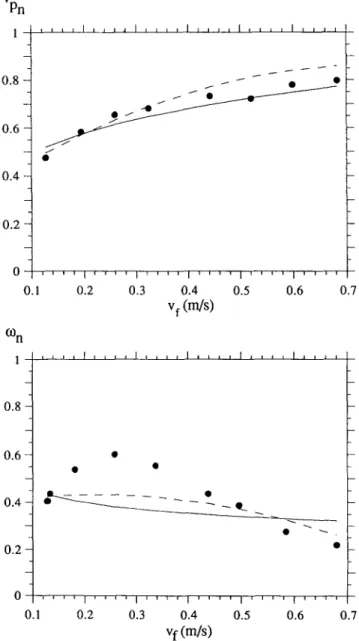
The effect of increasing fluid velocity, shown in Fig. 4, again provides evidence that the rotational velocity is dominated by perfect rolling or partial slip of the
0.2 -
0.8 -
0 ]1111,1111,1‘11,1111,1~11,1111,1111,1111
0.05 0.1 0.15 0.2 0.25 0.3 0.35 0.4 0.45 a
Fig. 2. Influence of simplex of density for a tied set of conditions (vf = 0.13 m/s, dJ
d, = 0.289, I = 1.19”, p, = 0.0039 kg/m s): (a) normalized particle linear velocity; (b) normalized particle rotational velocity. - Dimensionless correlation; - - -, poly-
Flow of spherical particles 133
particle over the surface wall. As the fluid velocity increases, vpn always increases. However, the particles become more and more ‘lifted’, with a layer of fluid possibly flowing near the bottom of the particle and causing it to slip increasingly. The rotational velocity therefore starts to decrease. This effect is less well predicted by
0.6 1 t a __ ---_---_a---
I*-
ri.
0.4 I l @ 1 a 0.2 4L
00
0 0.01 0.02 0.03 0.04 0.05 w,Wg/m.s) % 0.6 1 0 0.01 0.02 0.03 0.04 0.05 pe Wg/m.s)Fig. 3. Influence of effective fluid viscosity for a fixed set of conditions (vf = 0.13 m/s, c1= 0.425, ddd, = 0.289, I = 1.19”): (a) normalized particle linear velocity; (b) normalized particle rotational velocity. - Dimensionless correlation; - - -, polynomial correla-
134 Z? N. Baptista et al.
the correlations, which do not suggest the maximum w, that the experimental results clearly show. It should be stressed that both correlations could yield a curve with a clear maximum with the proper fit coefficients; however, the regression converged in both cases to a smoother line.
0.1 0.2 0.3 0.4 0.5 0.6 0.1 “f (m/s) 0.8 0.6 l 0 0 0.1 0.2 0.3 0.4 0.5 0.6 0.1 vf (m/s)
Fig. 4. Influence of average fluid velocity for a fixed set of conditions (CX = 0.425, dd
d, = 0.289, Z = 8.21”, pL, = 0.0034 kg/m s): (a) normalized particle linear velocity; (b) normalized particle rotational velocity. -, Dimensionless correlation; - - -, poly-
Flow of spherical particles 135
CONCLUSIONS
It is concluded that both normalized linear and rotational velocities depend on the Reynolds, Froude and Archimedes numbers and also on the dimensionless ratios, particle diameter/tube diameter and simplex of density. The effects on the linear and rotational velocities are different. In this work, these differences can be under- stood simply in terms of the rolling or slipping effect between the particle and the tube wall surface. The better the contact between particle and tube wall, the higher the rotational velocity, which in a perfect-contact situation becomes equal to the particle velocity.
ACKNOWLEDGEMENTS
The authors are grateful to the Junta National de Investigacao Cientifica e Tecnolo- gica and to the CEC (Flair Programme) for financial support. The authors would like to acknowledge the invaluable support of ARSOPI, the metallurgical company where the flow visualization system used in this work was built. Special mention is also due to Susana Caldas, Susana Silva and Joakim Sannervik for their collabora- tion in the experimental work.
REFERENCES
Abdelrahim, K. A., Ramaswamy, H. S., Marcotte, M. & Toupin, C. (1993). Residence time distribution of carrot cubes in starch solutions in a pilot scale aseptic processing system.
Food Res. Int., 26, 431-441.
Asakura, K., Tozawa, Y. & Nakajima, I. (1991). Numerical calculation of velocity and concentration distributions and pressure loss of a solid-liquid flow. In Liquid Solid Flows.
ASME, New York, p. 45.
Baptista, P. N., Oliveira, F. A. R., Oliveira, J. C. & Straul3, A. (1994). A general analysis of the residence time distribution of particles in the aseptic processing of particulate fluid foods in tubular systems. In Minimal Processing of Foods and Process Optimization, ed. R. P. Singh & F. A. R. Oliveira. CRC Press, Boca Raton, FL, pp.153-67.
Berry, M. R. (1989). Predicting fastest particle residence time. In Proceedings of the First
International Congress in Aseptic Processing Technologies, Indianapolis. Food Science Department, Purdue University, West Lafayette, IN, p. 6.
Brodkey, R. S. & Hershey, H. C. (1988). Transport Phenomena. McGraw-Hill, Singapore. Danckwerts, P. V. (1953). Continuous flow systems: distribution of residence times. Chem.
Eng. Sci., 2, l-13.
Durst, F., Milojevic, D. & Schonung, B. (1984). Eulerian and Lagrangian predictions of particulate two-phase flows: a numerical study. Appl. Math. Modell., 8, 101- 115.
Dutta, B. & Sastry, S. K. (1990). Velocity distributions of food particles suspensions in holding tube flow: experimental and modelling studies on average particles velocities. J.
Food Sci., 55, 1448-1453.
Grabowski, S. & Ramaswamy, H. S. (1995). Incipient carrier fluid velocity for particulate how in a holding tube. J. Food Eng., 24, 123-136.
Meng, H. & van der Geld, C.W. M. (1991). Particle trajectory computations in steady non- uniform liquid flows. In Liquid Solid Flows. ASME, New York, pp. 183-193.
Nesaratnam, R. & Gaze, J. E. (1987). Application of a particle technique to the study of particle sterilization under dynamic flow, Technical Memorandum No. 461. Campden Food and Drink Research Association, Chipping Campden, UK. .
I? N. Baptista et al.
Ohashi, H., Sugawara, T., Kikuchi, K. & IsC, M. (1980). Average particle velocity in solid- liquid two-phase flow through vertical and horizontal tubes. J. Chem. Erg. Japan, 13,
343-349.
Okuda, K. (1981). Trajectory and diffusion of particles in liquid-solid flow of slurry pipeline. J. Pipelines, 1, 211-223.
Palmieri, L., Cacace, D., Dipollina, G. & Dall’Aglio, G. (1992). Residence time distribution of food suspensions containing large particles when flowing in tubular systems. J. Food
Erg., 17, 225-239.
Sandeep, K. P. & Zuritz, C. A. (1994). Residence time distribution of multiple particles in non-Newtonian holding tube flow: statistical analysis. J. Food Sci., 59, 1314-1317.
Sastry, S. K. & Zuritz, C. A. (1987). A model for particle suspension flow in a tube, Paper No. 87-6537. American Society of Agricultural Engineering, St Joseph, MI.
Singh, R. K. & Lee, J. H. (1992). Residence time distribution of foods with/without particu- lates in aseptic processing systems. In Advances in Aseptic Processing Technologies, eds R. K. Singh & P. E. Nelson. Elsevier Applied Science, London, pp. 7-62.
Sommerfeld, M. (1990). Particle dispersion in turbulent flow: the effect of particle size distribution. Part. Syst. Charact., 7, 209-220.
Taeymans, D., Roelans, E. & Lenges, J. (1985). Influence of residence time distribution on the sterilization effect in a scraped surface heat exchanger used for processing liquids containing solid particles, Paper presented at IUFoST Symposium on Aseptic Processing and Packaging of Foods, Tylosand, Sweden, September 9-12.
Walpole, R. E. & Myers, R. H. (1993). Probability and Statistics for Engineers and Scientists. Macmillan, NY.
Zitoun, K. B. & Sastry, S. K. (1994). Determination of convective heat transfer coefficient between fluid and cubic particles in continuous tube flow using noninvasive experimental techniques. J. Food Process Erg., 17, 209-228.