Equity Valuation
Ferrari NV
Fabio Giacomo Müller
Dissertation written under the supervision of Professor José
Carlos Tudela Martins
Dissertation submitted in partial fulfillment of requirements for the
International MSc in Management, at the Universidade Católica
Abstract
The presented dissertation has the aim to determine the fair value of the Italian luxury car manufacturer Ferrari NV. In line with this, a target price is developed and finalized in an investment recommendation based on the outcome of this work and the current share price. The state of the art literature of equity valuation and the most suitable valuation approaches for the company are assessed in a first step. Followed by an in-depth analysis of the business and the industry it operates in. Subsequently, the assumptions and the forecasted financials are presented and applied in both, a discounted cash flow and multiples approach.
The DCF analysis derives at a share price value of €61.83 compared to the market price of €50.10 as of 16th of November 2016. The multiple valuation arrived at a significantly lower level of €42.62 and did not confirm the results under the fundamental approach. The target price is set to €58.36 and resembles an upside of 15%.
A comparison to the valuation of UBS equity research on Ferrari is conducted and critically reviewed to evaluate the differences of both valuations.
Resumo
A presente dissertação tem como principal objectivo determinar o justo valor do fabricante de carros de luxo Italiano, Ferrari NV. Assim, um preço alvo foi desenvolvido culminando numa recomendação de investimento baseada no resultado deste trabalho e preço corrente de cada acção.
Primeiramente foram analisadas a existente literatura sobre o tema, assim como os métodos de avaliação mais adequados para a empresa. Posteriormente segue-se uma análise profunda do negócio e da indústria na qual opera. Subsequentemente, os pressupostos e previsões financeiras são apresentados e utilizados para as abordagens de DCF e Múltiplos.
A analise DCF resulta num preço por acção de 61.83€ comparado a um preço de mercado de 50.10€ a 16 de Novembro de 2016. A avaliação por múltiplos chegou a um nível significativamente mais baixo de 42.62€ e não confirmaram os resultados da abordagem principal. O preço alvo é fixado a 58.36€ e representa um valor 15% acima.
A comparação face à avaliação da UBS Equity Research sobre a Ferrari foi realizada e criticamente revista, de modo a avaliar as diferenças entre as duas avaliações.
Acknowledgements
Firstly, I would like to take this opportunity to express my deepest gratitude to my parents who made it possible for me to pursue my chosen way in a personal and professional matter. I am especially grateful for having such an amazing person as my sister, who is always by my side with unconditional support whenever it is needed, which helped me immensely during the past years.
Secondly, I would like to thank Professor José Carlos Tudela Martins for his advisory throughout the process of this dissertation for his valuable feedback and guidance.
Lastly, I want to thank every single person that was part of this journey and made it so special.
Table of Contents
List of equations ... VI List of figures ... VII List of tables ... VIII List of abbreviations ... IX
1 Introduction ... 1
2 Literature Review ... 3
2.1 Multiples ... 3
2.1.1 Types of Multiples... 3
2.1.1.1 Equity Value Multiples ... 4
2.1.1.2 Enterprise Value Multiples ... 4
2.1.2 Peer Group ... 5
2.2 Discounted Cash Flow-based Valuation ... 5
2.2.1 Cost of Capital ... 5
2.2.2 Cost of Equity ... 5
2.2.2.1 Risk-free interest Rate ... 6
2.2.2.2 Beta ... 7
2.2.2.3 Market Risk Premium ... 7
2.2.3 Cost of Debt ... 7
2.2.4 Weighted Average Cost of Capital ... 8
2.2.5 Free Cash Flow to the Firm ... 8
2.2.6 Free Cash Flow to Equity ... 9
2.2.7 Capitalized Cash Flow ... 9
2.2.8 Adjusted Present Value ... 9
2.2.9 Forecasting ... 10
2.2.10 Terminal Value ... 10
3 Company Analysis ... 12
3.1 History of Ferrari ... 12
3.2 Initial Public Offering and Spin-off ... 13
3.3 Share Price Performance ... 13
3.4 Business Segments ... 14
3.5 Geographic Operations ... 15
3.6 Historical Performance ... 16
4 Industry Analysis ... 18
4.1 Luxury Player ... 18
4.2 High Net Worthy Individuals (HNWI) ... 18
4.3 Challenges and Opportunities ... 19
5 Financial Forecast ... 21
5.1 Income Statement ... 21
5.1.1 Revenues ... 21
5.1.2 Monte Carlo Simulation Sales ... 23
5.1.3 Cost of Goods Sold (COGS) ... 24
5.1.4 Selling, general & administrative costs (SG&A) ... 24
5.1.6 Other expenses/income ... 24 5.1.7 Interest ... 25 5.1.8 Taxes ... 25 5.2 Balance Sheet ... 25 5.2.1 Fixed Assets ... 25 5.2.2 Current Assets ... 26
5.2.3 Long Term Liabilities ... 27
5.2.4 Current Liabilities... 28
5.2.5 Equity ... 28
5.3 Cash Flow Statement ... 29
5.4 Capital Expenditures (Capex) and Depreciation ... 29
5.5 Net Working Capital ... 29
5.6 Cost of Capital ... 30
5.6.1 Cost of Equity ... 30
5.6.2 Cost of Debt ... 31
5.6.3 Weighted Average Cost of Capital (WACC) ... 31
6 Valuation ... 33
6.1 Relative Valuation Approach ... 33
6.1.1 Peer Group ... 33
6.1.2 Multiples Valuation ... 34
6.2 Discounted Cash-Flow (DCF) ... 35
6.2.1 Sensitivity Analysis ... 37
7 Comparison with UBS Equity Research ... 39
8 Conclusion ... 41 References ... X Appendix ... XIII
List of equations
Formula 1: Price-Earnings Multiple ... 4
Formula 2: Enterprise Value to EBITDA Multiple ... 4
Formula 3: Calculation Cost of Equity with Capital Asset Pricing Model ... 6
Formula 4: Regression equation for beta of stock i ... 7
Formula 5: Cost of Debt ... 8
Formula 6: Calculation for weighted cost of capital ... 8
Formula 7: Free Cash Flow to the Firm Calculation ... 8
Formula 8: Free Cash Flow to Equity calculation ... 9
Formula 9: Calculation of Adjusted Present Value ... 10
List of figures
Figure 1: Index Performance S&P 500 & Stoxx 600 - 2012-2016 (Reuters, 2016) ... 1
Figure 2: Shareholder Structure Ferrari N.V. 2016 ... 13
Figure 3: Stock price performance RACE.MI: January 16 - November 16 (Reuters, 2016) ... 14
Figure 4: Revenue Generating Segments as percentage of Total Revenue in 2015 ... 15
Figure 5: Generated Revenues by Geography ... 16
Figure 6: Historical Performance Revenues and EBIT in thousand Euros ... 16
Figure 7: Wealth growth in total amount held between 2015-2025 ... 19
Figure 8: Shipments of cars from 2005 until 2023E ... 22
Figure 9: Cluster analysis peer group ... 34
List of tables
Table 1: Total Fixed Assets Forecast (in t Euro)... 26
Table 2: Total Current Assets Forecast (in t Euro) ... 27
Table 3: Total Long Term Liabilities Forecast (in t Euro) ... 27
Table 4: Total Current Liabilities Forecast (in t Euro) ... 28
Table 5: Capex Forecast ... 29
Table 6: Working Capital forecast ... 30
Table 7: Cost of Equity calculation ... 31
Table 8: Market Value of Debt Calculation (in t Euros) ... 32
Table 9: Leading multiples overview ... 35
Table 10: Multiple Valuation Overview ... 35
Table 11: Free cash flow to the Firm forecast ... 36
Table 12: Discounted Cash Flow Analysis ... 37
List of abbreviations
CAGR Compound Annual Growth Rate
Capex Capital Expenditures
CAPM Capital Asset Pricing Model
CEO Chief Executive Officer
COGS Cost of Goods Sold
DCF Discounted Cash Flow
EBIT Earnings before Interest and Taxes
EBITDA Earnings before Interest, Taxes, Depreciation and Amortization
ECB European Central Bank
EV Enterprise Value
FCA Fiat Chrysler Automobiles FCFE Free Cash Flow to the Equity FCFF Free Cash Flow to the Firm
FED Federal Reserve Bank
GDP Gross Domestic Product
HNWI High Net Worth Individual
IAS International Accounting Standards
IFRS International Financial Reporting Standards IPO Initial Public Offering
IRAP Italian Regional Production Tax IRES Italian Corporate Income Tax
NV Dutch Public Company
NWC Net Working Capital
NYSE New York Stock Exchange
OLS Ordinary Least Square
P/E Price-to-Earnings
PP&E Property, Plant & Equipment R&D Research & Development S.p.A. Italian Public Company
SG&A Selling, General & Administrative Expenses
SPV Special Purpose Vehicle
WACC Weighted Average Cost of Capital
1 Introduction
Since the downstream of interest rates over the last decade, investors are seeking for attractive alternatives to gain higher yields when investing their money. Fixed income bonds are highly affected by the low-interest rate level and do not seem to be attractive for retail investors anymore as they cannot expect any high gains from that investment with accurate yields.1 Contrary to these unfavorable downward movements stock markets have risen and performed well during the past years.
Figure 1: Index Performance S&P 500 & Stoxx 600 - 2012-2016 (Reuters, 2016)
Due to this fact, many retail investors have put their focus on share capital investments, which makes an in-depth analysis and investment advice on an individual stock even more attractive than before. Political and economic factors such as recent announcements of the FED and the ECB about interest rate outlooks have profoundly affected the stock market.2 These fluctuations create an investor sentiment that many security prices might not reflect the fair value of the underlying assets and therefore create investment opportunities with high potential.
In 2015 Ferrari NV underwent an initial public offering (IPO) in the course of its separation from the parent company FCA. As a private corporation with a long and powerful history, this public offering came with a lot of attention of the public. The listing also raised the question whether Ferrari is one of many car manufacturers or if it is rather placed among luxury companies that typically act in a very different segment than the automobile industry. Given the fact that there is not any enterprise that is a perfect match to Ferrari the investor sentiment given by the current valuation multiples of the market Ferrari trades well in line with luxury peer companies rather than automotive peers. Due to the beginning struggling 1 http://www.wsj.com/articles/as-yields-fall-investors-turn-to-alternative-assets-1477274402 2 https://www.ft.com/content/11b16252-bcb5-11e2-9519-00144feab7de 90 110 130 150 170 03 -1 2 07 -1 2 11 -1 2 03 -1 3 07 -1 3 11 -1 3 03 -1 4 07 -1 4 11 -1 4 03 -1 5 07 -1 5 11 -1 5 03 -1 6 07 -1 6 11 -1 6 5 Yea r Ind ex P er fo rm ance (I nd ex = 1 00 o n 0 3/2 01 2) S&P 500 Stoxx 600
after the IPO and the upcoming 70th anniversary this paper has the objective to estimate the fair value of the company given all the recent company-, industry- and macro-specific factors. In order to determine an in-depth equity analysis of Ferrari NV the primary purpose and the research question of this work is stated as follows:
What is the fair value of Ferrari NV (RACE.MI) as of 16th of November 2016?
In line with the research question, the following topics will be discussed accordingly: suitable valuation methods, important value drivers, macroeconomic environment and dynamics of the industry.
In a first step the most commonly used valuation techniques will be presented in a state of the art literature review with an indication of the most suitable methods to value Ferrari.
Followed by a company analysis that presents the company itself, the historical performance and further describes the spin-off of the business from FCA, its parent company.
Afterward, the industry will be analyzed to point out the environment and important drivers of the industry. This chapter also elaborates the major challenges and opportunities that affect for Ferrari based on the industry development.
In the fifth chapter, a detailed financial forecast based on all available information is developed. It serves as a demonstration of how the assumptions were made and gives an outlook on the financial performance of the company.
Based on these assumptions and forecasts the following chapter is about the actual equity valuation of Ferrari. It presents the techniques that were used and how the value is calculated that then comes up with an estimated value.
Chapter seven gives a critical acclaim of a valuation of the UBS equity research on Ferrari in order to compare this works assessment to the value that the investment bank drew from their assumptions.
The final chapter is about drawing conclusions and identifying limitations of the report at hand.
2 Literature Review
The technique of valuation has been becoming more and more attractive in the past years as it is the general approach to allocate resources and investment decisions. Even the non-finance executives are getting more interested in valuation as they use it as a base to take decisions in operations, ownership claims and opportunities (Luehrmann 1997). It is important to understand that value does not equal price as a valuation can be done from several viewpoints, such as buyer and seller side, that differs significantly (Fernández 2001). Goldman Sachs researchers advice to use several valuation approaches to crosscheck the values obtained as "different approaches can lead to very different values" (Young et al. 1999).
This chapter gives an overview of the state of the art valuation techniques and an analysis of the suitability of the techniques in order to develop a fair value for Ferrari NV.
2.1 Multiples
The multiple valuation is not an approach to develop the intrinsic value of a company, but more an estimation for the value at current market conditions as the value is derived from the market momentum of comparable companies (Damodaran 2002). It represents in one kind of way the price that investors are willing to pay (Young et al. 1999). Due to its simplicity, the method is used many times as a supportive valuation next to a fundamental valuation approach in order to challenge and check the assumptions that have been taken in the fundamental estimation (Koller et al. 2010; Goedhart et al. 2005). In fact, it became state of the art to use more than one valuation approach in order to crosscheck the values and to better understand the critical factors of the valued firm and its peers (Young et al. 1999; Fernández 2002). Therefore a carefully chosen group of comparable companies is crucial for a good estimation of value (Eberhart 2004). In addition to this, Liu et al. (2002) have proven that forward-looking multiples outperform the accuracy of the valuation over trailing and leading multiples as described by (Pinto et al. 2015). It also refers to the difficulty of using relative valuation across different countries and industries as it is profoundly affected by accounting standards, economic and resulting differences.
2.1.1 Types of Multiples
There are two main types of multiple valuation. Price multiples consider the stock price to its portion of fundamental value, whereas Enterprise value comes up with the total market value and its ratio to a fundamental value of the company and all its capital (Pinto et al. 2015).
2.1.1.1 Equity Value Multiples
Equity Value multiples or also called earnings multiples as presented in Formula 1 are widely used due to their simplicity, availability of data and easiness to communicate (Pinto et al. 2015). The most commonly used earnings multiple is the P/E ratio as it resembles the current market valuation for a company.
𝑃/𝐸 𝑀𝑢𝑙𝑡𝑖𝑝𝑙𝑒 = 𝑀𝑎𝑟𝑘𝑒𝑡 𝑃𝑟𝑖𝑐𝑒 𝑝𝑒𝑟 𝑆ℎ𝑎𝑟𝑒 𝐸𝑎𝑟𝑛𝑖𝑛𝑔𝑠 𝑝𝑒𝑟 𝑆ℎ𝑎𝑟𝑒
Formula 1: Price-Earnings Multiple
But the multiple comes with several distortions as Foushee et al. (2012) explains; it is highly driven by the leverage ratio of a company. Hence, it is not only focusing on the operating profit, which better resembles the value of the capital. The second weak point of the P/E multiple is that it is an accounting measure that can be manipulated easily with non-recurring items in profit and loss (Koller et al. 2010).
This valuation serves as a good indication of the equity value and counts to one of the most used key ratios in the financial world. Therefore it is used in this work among others to estimate the equity value for Ferrari.
2.1.1.2 Enterprise Value Multiples
The enterprise multiples represent the market value of a company in proportion to some sort of value such as EBITDA or EBIT, as presented in Formula 2. Several authors suggest to chose enterprise multiples over earnings multiples as they are less sensitive to the level of leverage of the peers when applying the method to a group of companies with different capital structures (Pinto et al. 2015; Koller et al. 2010).
𝐸𝑉/𝐸𝐵𝐼𝑇𝐷𝐴 =𝑀𝑉 𝐸𝑞𝑢𝑖𝑡𝑦 + 𝑀𝑉 𝐷𝑒𝑏𝑡 − 𝐶𝑎𝑠ℎ 𝐸𝐵𝐼𝑇𝐷𝐴
Formula 2: Enterprise Value to EBITDA Multiple
In order to derive to an accurate enterprise value through this multiple, Goedhart et al. (2005) suggests adjusting the calculated value for excess cash, other non-operating assets, operating leases and pensions.
It is important to crosscheck the values derived from the equity multiples with the values of the enterprise multiples to offset the negative point of both approaches with the positive features.
2.1.2 Peer Group
Comparing the company only to its industry fellows might be misleading as there can be major inter-industry differences. Therefore it is more beneficial to compare growth rates, returns on invested capital and the capital structure to find the right comparable companies (Goedhart et al. 2005; Foushee et al. 2012; Fernández 2002). According to leading literature, the peer group should be chosen by carefully analyzing the companies return on invested capital and growth expectations (Koller et al. 2010; Goedhart et al. 2005; Eberhart 2004; Pinto et al. 2015).
2.2 Discounted Cash Flow-based Valuation
Leading finance literature explains four common types of firm valuation based on discounted future expected cash flows: (1) free cash flow to the firm, (2) cash flow to equity, (3) capitalized cash flow and (4) adjusted present value (Oded & Michel 2007). Each method relies on the carefully forecasted financial items that correspond to the cash flow of a firm's operations, and the enterprise/equity value can be obtained by discounting those cash flows at an appropriate discount rate. Free cash flow does not equal the accounting cash flow as it is based on the accrual approach and uses an arbitrary mechanism to determine revenues, costs and expenses (Fernandez 2013).
As the capital structure of Ferrari NV is considered to stay constant over the near future, the DCF method will be applied, as it is more appropriate in this situation. Thus, the free cash flows and the terminal value will be discounted by the wacc.
2.2.1 Cost of Capital
The cost of capital is a rate of return that investors of the company demand for an investment with the same risk profile (Damodaran 2002). It is the minimum return that investors could expect when investing in a similar portfolio entailing the same risk (Koller et al. 2010; Luehrmann 1997). The cost of capital can be split down into required return on equity and required return on debt as described in the following:
2.2.2 Cost of Equity
The cost of equity is the required excess return or premium that investors demand above the risk-free rate in order to invest in a portion of the company’s equity and therefore are exposed to the risk profile (Damodaran 2002; Pinto et al. 2015). There are three major models to calculate the cost of equity.
Starting with the Capital Asset Pricing Model (CAPM) as it is often referred to as the most fundamental and traditional method (Sharpe 1964; Zabarankin et al. 2014; Graham &
Harvey 2001). The CAPM is, as seen in Formula 3, is composed of a linear function with the intercept of the risk-free rate and the slope of a beta that represents the firm's exposure to the market risk and a premium that resembles the market risk itself (Damodaran 2002; MacKinlay 1995). A calculation based on CAPM is made by an OLS regression for the beta using the return of the company to a particular benchmark like the index in which the company is listed and multiply it by a risk premium that resembles the excess return (Bartholdy & Peare 2003).
𝐶𝐴𝑃𝑀: 𝑘𝑒 = 𝑟𝑓+ ß ∗ (𝑟𝑀− 𝑟𝑓)
Formula 3: Calculation Cost of Equity with Capital Asset Pricing Model
According to Fama & French (1992) the return of a security can in be estimated in the long run with the help of three factors of systematic risk. In addition to the CAPM they use a size premium, with the assumption that companies with small market capitalization have higher returns in respect to companies with larger market capitalization, and a value premium assuming that the Price-to-Book Value of a company influences the cost of equity.
A third alternative to estimate the cost of capital is the Arbitrage Pricing Model by Ross (1976). The return of an asset is predicted taking into account macroeconomic factors in a linear function. It analyzes the arbitrage situation of the asset. If there is no arbitrage, the asset can be priced in line with comparable assets.
In the case of Ferrari the CAPM approach is considered to be superior to the Fama & French model as the company is not significantly influenced by the additional factors included in the three-factor model.
2.2.2.1 Risk-free interest Rate
The risk-free rate is the first component of the CAPM model and part of the calculation of the market risk premium; it should be chosen under two conditions. Firstly, the asset has to be considered free of default risk and, secondly, no reinvestments are allowed for that the actual returns can match its expected returns (Damodaran 2002). As an investment with zero default risk does not exist in reality, the return of a bond issued by the government is the closest asset that fulfills these conditions (Pinto et al. 2015).
Furthermore, the risk-free rate used for the first component of the CAPM should be equal to rate utilized in the calculation of the risk premium, and the duration of the bond should range in the same period as the investment horizon (Fernández 2004; Pinto et al. 2015).
2.2.2.2 Beta
According to (Damodaran 1999), beta is a constant that measures the additional risk when including the asset to a diversified portfolio and can be estimated using the market model, comparable companies or the calculator provided by financial data providers such as Bloomberg or Thomson Reuters (Pinto et al. 2015). The beta estimation based on the average of comparable companies is not considered to be as accurate as the market model (Fernández 2011). When applying the market model, as presented in Formula 4, the observed sampling frequency in a particular period and the choice of a benchmark index are two critical aspects with significant influence on the beta estimation.
𝑅𝑖 = 𝛼𝑖 + 𝛽𝑖∗ 𝑅𝑀 + 𝜀𝑖
Formula 4: Regression equation for beta of stock i
Pinto (2015) suggests aligning company characteristics to the choice of the benchmark index. The key features are the region of operations and its competitors, size of the company and growth expectations. The effectiveness of the chosen sample period and its frequency is highly discussed under leading researchers. Bartholdy & Peare (2005) for example argue that five years monthly data brings the highest accuracy, while Reeves & Wu (2013) claim that high-frequency data such as one year daily returns are even more accurate.
Due to its recent IPO in October 2015, there is only one option, namely one-year daily returns, to apply the market model on Ferrari NV. In order to come up with a forward-looking perspective of the beta that is calculated based on historical returns, the results should be adjusted with a market beta of one (Blume 1975).
2.2.2.3 Market Risk Premium
Koller et al. (2010) assert "sizing the market risk premium is arguably the most debated issue in finance." Three models can be used in order to estimate the market size premium of which none is internationally accepted or superior to another: the historical returns approach, regression analysis and DCF valuation (Koller et al. 2010). For the consistency of the CAPM model the risk-free rate for computing the market risk premium (rf) should be equal the rf used
in the first determinant of the formula (Pinto et al. 2015). The index that resembles the market return (rM) should resemble the characteristics of the companies operations in order to
reproduce the same type of diversification (Stulz 1999). 2.2.3 Cost of Debt
The effective rate a company has to pay to serve its current debt. As interest expenses are tax deductible, there are two forms of cost of debt: the pre-tax cost of debt and the after-tax cost
of debt (Graham 2000). According to Damodaran (2002) cost of debt is driven by three factors: risk-free rate, company's default risk, and the tax advantage. In case the company has an investment-grade the pre-tax cost of debt can be determined by using the yield to maturity (YTM) of the long-term debt. By deducting the tax benefit, as presented in Formula 5, the company’s after-tax cost of capital (kD) can be estimated under the condition that the
enterprise meets its coupon payments on time and reimburses its face value in full (Goedhart et al. 2005).
𝑘𝐷 = 𝑌𝑇𝑀(𝐿𝑜𝑛𝑔𝑇𝑒𝑟𝑚 𝐷𝑒𝑏𝑡) ∗ (1 − 𝑇𝑎𝑥)
Formula 5: Cost of Debt
In case the company has no credit rating it can be estimated by looking and past credit default spreads that were applied to the company or to estimate a synthetic rating based on the company’s financial ratios (Damodaran 2002).
2.2.4 Weighted Average Cost of Capital
In order to determine the present value of the levered cash flows it should be discounted by a rate that reflects the combined effect of financing and investment decisions, which is represented by the weighted average of cost of equity and after-tax cost of debt at market values (Miles & Ezzell 1980). Formula 6 presents the calculation of the wacc with its respective components.
𝑤𝑎𝑐𝑐 = 𝑀𝑉(𝐸)
𝑀𝑉(𝐸) + 𝑀𝑉(𝐷)∗ 𝑟𝐸+ (1 − 𝑇) ∗
𝑀𝑉(𝐷)
𝑀𝑉(𝐷) + 𝑀𝑉(𝐸)∗ 𝑘𝐷
Formula 6: Calculation for weighted cost of capital
Despite the fact that its name "weighted average cost of capital (wacc)" is neither a cost nor a required return, it is simply the weighted average of a required return (rE) and a cost (kD)
(Fernández 2011).
2.2.5 Free Cash Flow to the Firm
The free cash flow to the firm, as presented in Formula 7, is the money that is available for all capital provider of the company already deducted for operating expenses and investment needs (Pinto et al. 2015). More precisely it is the cash that is left on the table for any kind of capital providers of the company such as debt holders, equity provider and non-equity investors in the particular period.
By discounting this cash flow figure with the wacc, the enterprise value can be determined (Fernandez 2013).
2.2.6 Free Cash Flow to Equity
Free cash flow to equity derives from the free cash flow to the firm and is the money that goes to common stockholders after serving all creditors and preferred stockholders (Pinto et al. 2015). One possible calculation of FCFE can be done as presented in Formula 8, starting from the FCFF and deducting net interest and principle payments to debt holders as well as adding new debt borrowings (Fernandez 2013).
𝐹𝐶𝐹𝐸 = 𝐹𝐶𝐹𝐹 − 𝐼𝑛𝑡𝑒𝑟𝑒𝑠𝑡 ∗ (1 − 𝑇) + 𝑁𝑒𝑡 𝑏𝑜𝑟𝑟𝑜𝑤𝑖𝑛𝑔
Formula 8: Free Cash Flow to Equity calculation
The FCFE has to equal the amount of dividends and other money to shareholders such as retained earnings. According to (Damodaran 2006) the discounted cash flow to equity is an equity valuation method based on potential dividends not on actual dividends as FCFE differs most of the time from dividends paid. In order to derive at the equity value of the company the FCFE has to be discounted by the cost of equity (rE). In a final step, the net debt of the
firm has to be added to the equity value in order to obtain the enterprise value (Oded & Michel 2007).
2.2.7 Capitalized Cash Flow
The capitalized cash flow method is not often used to value publicly traded firms as it is more appropriately used to value small private businesses with stable growth and no projections can be done (Pinto et al. 2015). The capitalized cash flow model will not be considered in this paper, as it is not beneficial to develop the valuation of Ferrari based on this method.
2.2.8 Adjusted Present Value
The adjusted present value method follows the findings of Modigliani & Miller (1958) who claimed that in perfect capital markets, enterprise value is not affected by capital structure. In reality, however, the existence of imperfections, financial distress and taxes influence the value of a company significantly.
The adjusted present value separates the valuation of operations and tax benefits in order to disregard the capital structure of the enterprise. The two principal components of the approach are shown in Formula 9. The valuation starts with the firm value of an unlevered company and adds the present value of tax shields to it (Koller et al. 2010).
𝐴𝑃𝑉 = 𝑃𝑟𝑒𝑠𝑒𝑛𝑡 𝑉𝑎𝑙𝑢𝑒𝑈𝑛𝑙𝑒𝑣𝑒𝑟𝑒𝑑+ 𝑃𝑟𝑒𝑠𝑒𝑛𝑡 𝑉𝑎𝑙𝑢𝑒𝑇𝑎𝑥 𝑆ℎ𝑖𝑒𝑙𝑑𝑠
Formula 9: Calculation of Adjusted Present Value
It is preferably applied when the capital structure of a company is constantly changing (Graham & Harvey 2001).
2.2.9 Forecasting
The financial forecast is a prediction of the company’s future performance and should be done carefully and consistent in line with economic theory, competitor and industry analysis and historical evidence to derive reliable estimates of revenues, sales and cash flow (Pinto et al. 2015). To start the forecasting, it is important to analyze the company's historical financial performance deeply and to prepare the raw data as it serves as the basis for your prediction.
Most important is the preparation of the historical income statement, balance sheet and statement of retained earnings (Koller et al. 2010). Projections can either be made by taking a fundamental analysis of future expectations such as opportunities and strategic plans or by only looking at past results and benchmarks. It is recommendable to prepare several scenarios in a forecast such as "base," "worst" or "best" in order to reduce biases in the estimates (Ruback 2011). It is highly important to separate the historical performance from recurring and non-recurring or extraordinary items, as they will overly bias your prediction (Damodaran 2002). As most items of the income statement can be attached to a particular ratio, it is often used to estimate line items according to forecast ratios such as cost in percentage of sales (Koller et al. 2010). As predictions tend to overestimate the future development, Ruback (2011) suggests using an inflated discount rate to antagonize the bias of a too optimistic forecast.
2.2.10 Terminal Value
The DCF method is based on the 2-Stage approach that consists of the first stage with detailed forecasting for a certain number of years and the second stage that determines the terminal value in perpetuity assuming a constant growth rate (Pinto et al. 2015). Only when the company has reached a steady-state phase a terminal value can be determined as an infinite going concern assumption. The Terminal Value is often based on questionable assumptions and has a significant effect on the valuation in total (Penman 1998). Damodaran (2002) introduces three possible approaches to determining the terminal value, using multiples, a liquidation estimate or assuming a constant growth rate of cash flows and therefore using a perpetual growth model. As Ferrari NV is observed under the going concern assumption the
multiple and continual growth model, as displayed in Formula 10, will be taken into account for the valuation.
𝑇𝑒𝑟𝑚𝑖𝑛𝑎𝑙 𝑉𝑎𝑙𝑢𝑒𝑇 =
𝐶𝑎𝑠ℎ 𝐹𝑙𝑜𝑤𝑇+1 𝑟 − 𝑔
Formula 10: Terminal Value under perpetual growth model
Formula 10 is based on the assumption that the rate of return was used smaller than the growth rate (r > g). In order to determine the growth rate in perpetuity, it should be considered that a company could not grow higher than the economy it is operating in. Basically, the growth rate for an infinite period of time should not exceed excess GDP growth plus inflation. Due to the current situation were interest rate are at an historical low and inflation in advanced economic countries is stagnating the terminal value is affected significantly.
3 Company Analysis
Ferrari is one of the most famous and highly exclusive luxury car manufacturers around the world, also known for its hugely successful Formula One team Scuderia Ferrari. The company was founded by Enzo Ferrari in 1947 and is based in Maranello, Italy. According to Brand Finance (2015), Ferrari is among the top ten of the most powerful brands according to their Brand Strength Index (BSI).3 With only 7,664 manufactured cars in 2015, Ferrari follows a small volume production strategy in order to promote its exclusivity and scarcity strategy. The company was owned by FCA Group with a stake of 90% since 1988 and the remaining 10% held by Piero Ferrari, Enzo’s son. In October 2015 Ferrari separated from FCA Group through an IPO at the New York Stock Exchange, NYSE (Ferrari, 2015) under the ticker RACE.K. It is currently also listed on the Milan Stock Exchange under the Ticker RACE.MI.
3.1 History of Ferrari
Ferrari founder Enzo Ferrari was born in 1898 in Modena, Italy and counts as one of the most prestigious racecar drivers and entrepreneurs. Growing up with a passion for racing he founded his racing team called ‘Scuderia Ferrari’ in 1929. In 1947, Ferrari launched its first racing car, in the following Ferrari has become the most famous racing team nowadays with over 5,000 victories across all racing disciplines. Its highly successful Formula One activities are also used as marketing instruments and generate revenues in the form of merchandising, licensing and royalty income (Company website, 2016).
Road cars were initially built in order to fund its racing activities starting with the launch of the first road car, the 166 Inter V12, in 1948 followed by V8 engine cars in the 1970s. Up to now Ferrari has built some of the most luxurious and highly desired sports cars that the world has seen and the Cavallino Rampante (“prancing horse”) became one of the most iconic logos among brands worldwide (Company website, 2016).
In 1969 Fiat acquired 50% stake of Ferrari becoming the primary stakeholder next to Enzo Ferrari. Upon the death of Ferrari founder Enzo in 1988, Fiat became controlling stakeholder with owning 90%, while the remaining 10% were kept by the son Piero Ferrari. In October 2014 FCA announced the separation of Ferrari from its mother company (Prospectus, 2016).
3.2 Initial Public Offering and Spin-off
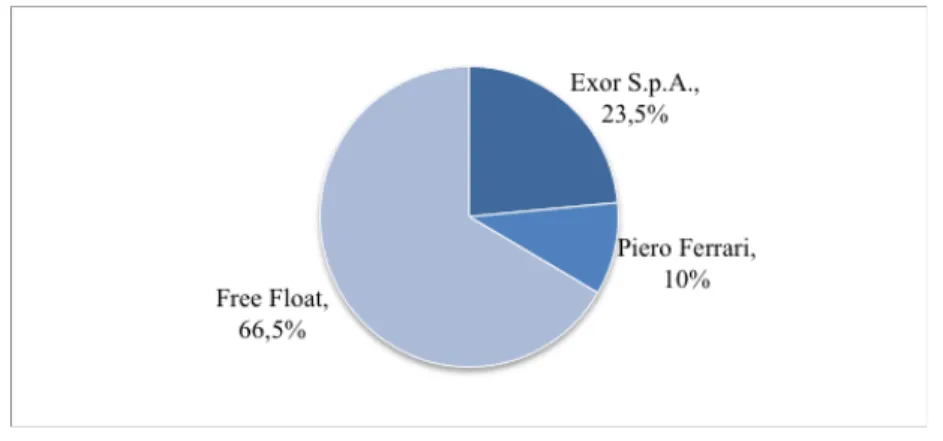
After the announcement of its separation from FCA Group in 2014, Ferrari initiated its public offering in October 2015 with a special purpose vehicle (SPV) that held 100% of Ferrari S.p.A. formerly owned by FCA Group. In order to restructure its capital, FCA Group gave out a promissory note to the special purpose vehicle. Under the ticker, "RACE.K" Ferrari distributed 10% of its stake to the public keeping 80% held by FCA Group and 10% by Piero Ferrari. In January 2016 the separation was completed by a spin-off as the final step. The 80% stake held by FCA Group was transferred to the special purpose vehicle and successfully distributed to common shareholders and mandatory convertible security holders of FCA Group in a demerger. On completion, the SPV got merged into Ferrari and renamed to Ferrari N.V. with legal headquarters in Amsterdam, Netherlands (Prospectus, 2016). After the spin-off in January 2016, Ferrari N.V. remained the following shareholder structure, as presented in Figure 2.
Figure 2: Shareholder Structure Ferrari N.V. 2016
Exor S.p.A. is an Italian investment company and the largest shareholder of Ferrari N.V. with 23.5% of the total common shares. Piero Ferrari remained its 10% of stake in common shares.
Due to the loyalty voting mechanism, Exor’s and Piero Ferrari stake in the company results in a relative voting power of 33.4% and 15.4%, respectively. The remaining 66.5% of common shares are available for public investors and are traded on the NYSE as well as the Milan Stock Exchange (Ferrari, 2015).
3.3 Share Price Performance
Current developments of the stock price of RACE.MI has shown that after a rough post-IPO phase the common shares have recovered and even succeeded its initial price by the end of September 2016. As leading literature has shown that the “short-run underpricing” is a common phenomenon for stocks that just went public (Ritter, 1991).
Figure 3: Stock price performance RACE.MI: January 16 - November 16 (Reuters, 2016)
As presented in Graph 3, the stock price has shown significant upwards momentum since July 2016 and has recently overpassed the €50 mark. The interim report at the beginning of November has given a great outlook on the estimation of 2016 end of the year results.
3.4 Business Segments
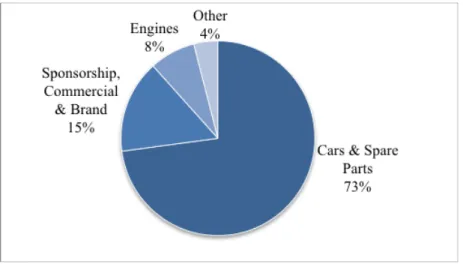
The company is structured in four revenue lines as separated in Graph 4. With 7,644 manufactured cars in 2015 and €2bn generated revenue (73% of total), Cars & Spare Parts represents the strongest segment and core business of Ferrari. This section includes design, development, and production of Ferrari models. Ferrari models can be split into two categories. Cars with a V8 engine that have an average price of around 200k and V12 engines that are sold at an average of 300k.
Currently ten various Ferrari vehicles are on the market. In order to follow its corporate strategy of scarcity and exclusivity the production and waiting list, management is well designed to ensure these values.4 With waiting times of one up to two years for a delivery of the car, the future revenue streams can be reliably forecasted.
A crucial part of its brand image is the Formula One activities and the main channel for Ferrari’s marketing activities. The revenue line Sponsorship, Commercial & Brand is the second biggest revenue generating segment, with 15% of total revenues. This section includes the revenues of Scuderia Ferrari Racing Team and income generated by licenses, merchandising and royalties of the Ferrari brand.
25 30 35 40 45 50 55 Euro
Figure 4: Revenue Generating Segments as percentage of Total Revenue in 2015
The Engines segment generated 8% of Ferrari's total revenue in 2015. This part consists mainly of shipments of engines to Maserati that make 81% of the segment revenue. Ferrari has exclusively manufactured for Maserati, and no other car manufacturer is considered as a purchaser of the engines, and it assures that the engines are assembled and manufactured under the same production processes. In 2015 Maserati purchased 3,300 V8 and 21,500 V6 engines from Ferrari. The remaining 19% of segment revenue are generated by motor rentals of Scuderia Ferrari for its Formula One activities.
Other revenues generate 4% of total income and are mainly created by the Ferrari Financial Services Group and the profits of the management of the Mugello racetrack. This circuit is primarily used for testing and developing purposes and is also frequently rented to special events or other car manufacturers.
3.5 Geographic Operations
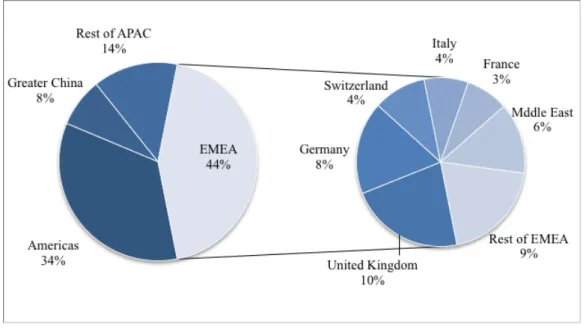
From a geographical view, Ferrari is mostly operating in Europe and America with combined revenue generation of 78% of total revenues, 44%, and 34% respectively. The breakdown of the revenue origins can be observed in Figure 5. Stable economy countries like Germany and the UK represent the strongest markets for Ferrari within Europe, with 8% and 10% respectively, followed by the Middle East with 6% of total revenues. The Asia and Pacific region only accounts for 22% of income but is subject to change shortly developments as global wealth growth is driven by those regions.
Figure 5: Generated Revenues by Geography
With Ferrari producing all of its cars and engines in Modena, Italy the company is affected by currency fluctuations for 56% of its sources of income as they are outside of Europe.
3.6 Historical Performance
Ferrari has become one of the most prestigious car brands, with highly luxurious cars like the “LaFerrari” or the “Enzo” just to name a few, and the most successful Formula One team, winning 224 Grand Prix, 15 World Constructor titles, and 15 World Driver's Championship.
Figure 6: Historical Performance Revenues and EBIT in thousand Euros
Ferrari sold 7,664 cars in 2015, a historic high, generating €2.8bn in revenues by a solid 17.8% EBIT margin, as presented in Graph 6, making it undoubtedly unique among its
Revenues in t € EBIT in t € 0 100 200 300 400 500 600 700 800 0 500 1.000 1.500 2.000 2.500 3.000 3.500 4.000 4.500 5.000 Revenues EBIT
automobile manufacturer peers. Between 2005 and 2015 Ferrari had a growth of 9.23% CAGR in revenues, increasing its units sold per year by 3.95% CAGR, from 5,409 in 2005 to a historic high of 7,664 units sold in 2015.
By apparently sticking to its small volume strategy, keeping the demand at a higher level than the supply, Ferrari set its goal for units per annum to 9,000 by 2019, which indicates a 4.1% CAGR, way lower than the expected growth of its target group of high net worth individuals (HNWI).
4 Industry Analysis
Ferrari is serving a small niche market in the automobile sector, namely the ultra-luxury sector. Consumers do not purchase this kind of cars to meet their transportation need, and Ferrari is not solely selling a transportation vehicle but rather the experience and prestigious feeling of owning one, which is privileged to the world’s richest human beings. It counts to the most recognized brands even though the number of potential buyers is extremely low. Target customers are high net worth individuals in a mature age, mostly men. Therefore the crucial economic factor that drives the future development of Ferrari is the HNWI growth.
4.1 Luxury Player
The company has quite a different understanding of business, pricing and brand image than other car manufacturers. It operates in a unique position compared to its automotive peers. With only 7,664 units produced per annum, it is far away from production sales of BMW with roughly 2 million units per annum or even Porsche with 200 thousand units per annum. It is even hard to compare it to other ultra luxurious car companies such as Aston Martin or Lamborghini as none of them is publicly traded and can keep up with the brand image of Ferrari.
Comparing key factors like EBITDA margin and growth rate Ferrari positions itself well in the luxury good sector. Given its brand awareness, pricing power and low volatility on economic cyclicality or depressions gives Ferrari also typical characteristics of a luxury player. These features and the positioning of Ferrari make it more volatile to the development of high net worthy individuals (HNWI) and less to global GDP movement.
4.2 High Net Worthy Individuals (HNWI)
According to Capgemini's World Wealth Report (2016), the HNWI market will grow 8% until 2017, which is above the general economic growth of the expected GDP development worldwide of 2.4% (Worldbank, 2016). Given the fact that the outlook until 2025 is showing a high growth rate all along the company enjoys a beneficial prospect.
Figure 7: Wealth growth in total amount held between 2015-2025
By analyzing the World Wealth Report carefully, presented in Graph 7, it is observable that most of the worldwide growth is generated in Asia-Pacific, showing a total wealth increase of 142% until 2025, equaling a 9.2% CAGR. The rest of the world is growing at a slower pace at an average of 4.5% CAGR reaching a total increase of 55% by 2025. The total CAGR estimated for the next ten years will be 6.1%.
Nevertheless, Ferrari is more resilient to the general growth expectations as they use to have long waiting lists that already indicate the future growth estimations.
4.3 Challenges and Opportunities
According to the high growth of HNWI in the Asia Pacific region, Ferrari has a tremendous opportunity to enlarge its business in this area as for now it only accounts for roughly 22% combined. The company already tried to focus their strategy towards this trend by celebrating the 50th anniversary of Ferrari being in Japan with a strongly limited special vehicle, the J50.5 For now, the management around CEO Sergio Marchionne has not defined a clear strategy to increase sales in this region.
Even though the outlook of Ferrari’s target market looks very promising, the biggest challenge for Ferrari is to find the trade-off between its scarcity and exclusivity strategy and to grasp the growing demand by increasing its car sales. Increasing sales aggressively would mean that Ferrari has to cut its high-profit margins most likely and to invest in new plants while simultaneously losing its scarcity and exclusivity status as the cars will become
5
inflationary. Most certainly this outcome is not the long-term strategic goal of the company and would disregard its primary strategy.
Other significant limitations to future operations are new laws, regulations, and policies concerning fuel efficiency, reduced greenhouse gas or pollutant emissions that will apply for Ferrari. As those regulations are about to change quite dynamically, especially in recent years. The most significant impact on the company will be when they exceed the yearly shipment of 10,000 cars, as they will not be considered as independent manufacturer of fewer than 10,000 vehicles per year anymore and more strict rules and standards have to be met (Annual Report, 2015).
5 Financial Forecast
The valuation of this work is conducted as of 16th November 2016, and all necessary assumptions and financial data have been taken from the information available at this point. The company has released an interim report of the first three-quarters on the 3rd of November. The financial year is considered to follow the standard calendar year, starting on the 1st of January until the 31st of December of the particular year. As the data cut-off period is close to the end of the fiscal year 2016, the valuation will be performed based on the forecasted years from 2017-2023, when the company is to be considered in a steady state. The steady-state assumptions are particularly based on the exclusivity strategy of Ferrari and the fact that by the expected growth 2023 will be the year when they hit the limit of 10k vehicles per annum.
5.1 Income Statement
At first, the historical development of the single items of the income statement will be analyzed in order to come up with forecasted values. All relevant assumptions and calculations will be presented in the following.
5.1.1 Revenues
Ferrari’s revenues are mainly generated through the sale of cars accounting for 70% of total revenues. With an average car price of more than 200 thousand euros Ferrari is highly dependent on the growth of HNWI. Ferrari sticks consequently to its small volume strategy and its active management of waiting list, which leads to very robust revenue forecasts. As they set a particular production at lower levels than its demand, there is high revenue stream certainty as most of the models that are launched are already sold out before even the first model has left the factory. Thus, the revenue streams of Ferrari are more driven by the strategy set by the management including the launches and active management of new models than by the actual demand growth.
Also the fact that Ferrari is a highly recognized and robust brand in the luxury sector the risk in revenue and cash flow is significantly lower than general automotive producer. In 2013 Ferrari reduced its production to 7,000 models, a total of 400 units lower than 2012 in order to promote the scarcity of its products even though the demand was growing in that year.
Figure 8: Shipments of cars from 2005 until 2023E
According to the prospectus of Ferrari's IPO the management has set a strategic plan for responding to the growth of demand in emerging markets and the changes in size and spending capacity of its target clients to reach a total of 9,000 units by 2019, equaling a CAGR of 4.1%. Given the growth of the target clientele of 6.1% CAGR of HNWI over the next ten years, Ferrari will grow at a slightly lower pace. As the limitation of 10k sold cars will be exceeded in 2023, Ferrari is subject to decrease their growth expectations and to grow on a steady level of inflation to keep their strategy ongoing until they have responded to the limitation.
The second most important component of forecasting revenues next to the units produced is the average price per unit in order to calculate the total revenue. The average price of a V8 model ranges around 200k euros and for V12 machines around 300k. Nevertheless, special editions like the LaFerrari are as expensive as 1,000k euros. While the ratio between the broad range of V8 and V12 machines remained at a level of around 80/20 to come up with an average value of 220k for the general models excluding the limited vehicles. The company generally launches one new model every year with a cumulative lifecycle of 8-9 years leading to an average model range of 8 to 9 cars. Waiting lists for buying a vehicle are from 12 up to 24 months, and usually, pre-owners of a Ferrari get asked first to award the loyalty of the customers.
Ferraris second biggest segment regarding revenues is generated by sponsorship, commercial and brand as it accounts for 15% of total revenues. The main driver in this segment is the Formula One racing team as it serves as the primary marketing tool. It also includes the sponsorship activities of Scuderia Ferrari and the broadcasting licenses of the racing team. Historically seen Ferrari is the most successful race team in the Formula One but
0 2.000 4.000 6.000 8.000 10.000 No of Cars sold
underperformed in this sector with position three or four among all teams. This segment has already been the one with the lowest growth rate in the last years and is assumed to continue at a low rate as 2% CAGR for the following years. Significant expenses have to be put in Scuderia Ferrari to make it compete at the top again. Nonetheless, Ferrari is to be considered one of the most valuable brands according to Brand Finance (2015).
Regarding Engines, it is mainly dependent on the sales to Maserati, as it accounts for 81% of total engine revenues (8% of overall revenues). In the annual report, Ferrari gives the outlook of a cumulative output of 260,000 engines sold to Maserati by 2023, which equals a CAGR of 7.2% starting from 21,500 engines sold in 2015. The other 19% come from engine rentals to the Formula One team. As the racing team has not been very successful in recent years, with championships lastly won in 2008, Ferrari expects the revenues generated by Scuderia Ferrari to lessen and expenses about to grow, due to new regulations and requirements of the motorsport (Annual Report, 2015). As costs in development will increase significantly and can only bring higher revenues in future years the engine proceeds of the Formula One team are about to decrease during the explicit period.
Thus, the expected growth of the whole engine segment is assumed to be around 4.8% CAGR until 2023, corresponding to a 6.8% increase in engine sales to Maserati and a -5% decrease in rentals to the Formula One racing team.
The smallest part of generated revenues referred to as others, is equally divided in revenues from financial services and the management of the Mugello racetrack an accounts for 3% of total revenues. As the financial service income is attached to cars sold the same growth rate is assumed. Ferrari does not disclose any further information on the racetrack revenues. Thus the historical mean of the development of other income will be taken into account.
5.1.2 Monte Carlo Simulation Sales
Based on these estimates for the specific revenue lines a Monte Carlo simulation was performed taken into account the historic standard deviation of the revenues to better simulate potential influences on sales. The financial forecasting is significantly reliable on the sales predictions. Therefore it is more sophisticated to use this model that makes the forecasting more robust to certain economic scenarios. The simulation of the sales was performed 2,000 times and the median outcome of sales are presented in the following chapters and are used as the basis for the valuation. The total results of the Monte Carlo Simulation are presented in the appendix as for every sales prediction a specific share price was calculated.
5.1.3 Cost of Goods Sold (COGS)
The cost of sales is mainly composed by the expenses that occur with the manufacturing and distribution of cars sold as well as costs related to engines shipments to Maserati and rentals to the Formula One team. It also includes warranty and product-related costs that will occur in the future but are estimated at the time of shipment. In the previous four years, the cost of sales amounted for slightly above 50% of revenues. The relative amount of COGS at the end of the third quarter in 2016 was at 50.7% of revenues, a reduction of 120bp when comparing it to the value of the first three-quarter in 2015, by 52.5% at the year-end.
Ferrari just recently renegotiated its long-term contracts in order to achieve higher efficiency regarding variable costs related to the manufacturing of the cars. Thus, it will be assumed that the future costs can be estimated with the average of the portion of costs on revenues in the year 2015 and 2016 projected to the year's end. The COGS will be calculated at a fixed 51.3% of total revenues for the years 2017 until 2023.
5.1.4 Selling, general & administrative costs (SG&A)
This block of costs can be further divided into two parts, the selling costs that mainly consist of expenses for marketing and selling personnel and the general and administrative expenses that cannot be directly attributed to either sales, manufacturing or R&D functions. In 2015 the expenses of the initial public offering were included in the general and administrative costs, which makes it not representative for the usual operations to forecast the following years. Therefore, the simple average the years 2012 to 2014 were taken. The SG&A costs amount to 11% of total revenues and will be kept at this fixed percentage for the forecasted years.
5.1.5 Research & Development (R&D)
Ferrari mainly uses R&D costs in order to improve their Formula One race cars and uses the findings to transfer it to its luxury sports cars. As previously described in the company analysis the underperformance of the Formula One team and the importance of its success drives Ferrari to increase their efforts in R&D. The company already follows this investment strategy on the Formula One team for the last years and therefore the average of the period of 2012 until 2016, projected to the year-end, will be used to estimate its cost percentage regarding total revenues. Relatively to the total revenues, Ferrari uses 19.7% in R&D expenses.
5.1.6 Other expenses/income
assets, rentals and miscellaneous income. This item is difficult to estimate and therefore the mere average of the historical values of the years 2012 until 2015 is taken into consideration in order to forecast other expenses/income. Thus, this item will be related to total revenues at a constant 5%.
5.1.7 Interest
The interest income/expenses are only related to the industrial operations of Ferrari, as the financial services income/expenses are included in net revenues. The historical value of the last four years was taken for the estimation, as it resembles the low interest rate phase that is currently going on. Net financial income/expenses were assumed to stay at a constant level of -0.8% of the EBIT.
5.1.8 Taxes
Ferrari is legally based in the Netherlands but all its production and administration offices are located in Maranello and Modena, Italy. Therefore the company is being taxed corresponding to Italian taxation law. Italian corporations are subject to a general corporate income tax, IRES, and a regional production tax, IRAP (Deloitte 2016). In 2017 the new tax reform in correspondence to Italy’s stability law of 2016 will become effective and the IRES will be decreased from 27.5% to 24%. The IRAP stays at 3.9% rate, which sums up to an effective tax rate of 27.9% starting from 2017 onwards.6
5.2 Balance Sheet
As the balance sheet is related to several items on the income statement and vice versa, it is essential to understand these inter-relationships, and therefore the line items of the balance sheet will be forecasted in the following.
5.2.1 Fixed Assets
The statement of financial position showed a total of €1,85bn of fixed assets for the fiscal year 2015, composed of the items presented in Table 1. As Ferrari follows the IFRS standards, in particular, IAS 36, the company's Goodwill is subject to impairment tests and will not be amortized. Thus, the goodwill will be assumed to stay at the same level over the forecasted period at the level of 2016. It is tested for impairment annually or if certain circumstances occur more frequently.
6
The property, Plant & Equipment (PP&E) and Intangible Assets were analyzed carefully to its historical development from 2012 until Q3 2016. Yearly changes regarding additions, disposals, amortization, reclassification and translation differences on year-to-year change were taken into account in order to come up with an estimate for these items. The growth of these two items is closely attached to the sales growth and therefore projected to grow in line with revenues. PP&E and Intangible Assets are subject to grow at half of the rate of revenues with a CAGR of 1.45% during the explicit period.
Table 1: Total Fixed Assets Forecast (in t Euro)
Investments and other financial assets include investment properties, participation in unconsolidated companies and non-current financial assets. Currently, Ferrari is not holding investment properties anymore as they got sold in 2015. The current composition of this line item is the options hold by Ferrari in buying shares of Delta Top Co the entity that is responsible for the promotion of the Formula One Championship and non-current other securities or financial assets. Ferrari discloses only a little information about the option as the fact that the option is granted from 2014 until 2020, it is renewable and gets measured independently at fair value. This item is assumed to stay constant during the forecasted period.
Deferred taxes will be influenced due to the change in Italian tax legislation, but it is expected to develop at a fixed percentage of total income tax expenses. In the IPO year of 2014 and Q3 2016, this portion was at an average of 84.8% of total income tax expenses. This level will be assumed in order to forecast this item on the balance sheet for the upcoming years.
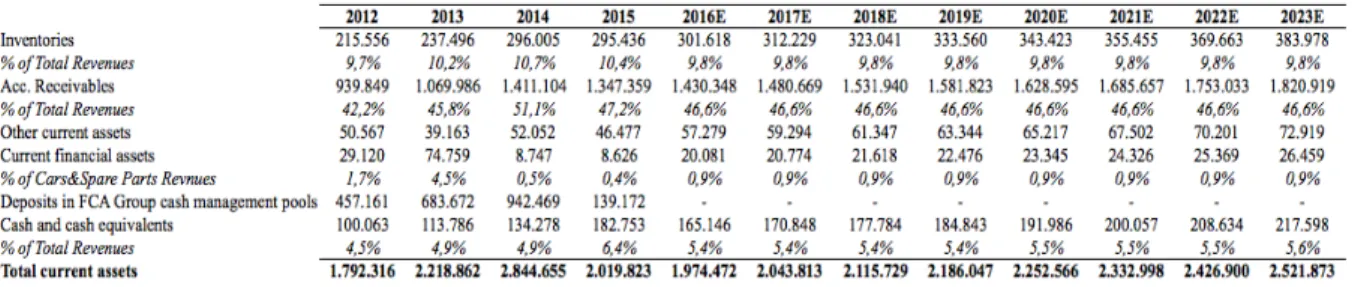
5.2.2 Current Assets
Current Assets are tightly attached to sales and cost of sales for the specific fiscal year. In line with the calculation of the working capital most line items were calculated as average days, they are covered either regarding sales or cost of sales.
Accounts receivable in days were estimated based on the historic five-year average from 2012 until 2015 regarding sales. The coefficient of 170 days on average is multiplied by the amount of sales per day (Sales/365) in the particular year.
Inventories in days, on the other hand, are measured by matching it to the cost of sales of the explicit period. In line with receivables, the five-year average indicates the ratio for the forecasted years with a coefficient of 69.9.
Table 2: Total Current Assets Forecast (in t Euro)
Other current assets are assumed to grow in line with the company’s sales and therefore. The historical average determines a fixed 1.87% of total sales.
Current financial assets can be divided into two attributes: cash flow hedges and financial derivatives. The cash flow hedges are mostly related to the car selling to foreign currency markets. Thus this item will be attached to sales with a historical percentage of IPO levels from 2014 until Q3 2016. The historical average approach derives at 0.9% of total sales. 5.2.3 Long Term Liabilities
According to the 2015 annual report of Ferrari, the expenses for employee benefits and provisions are distributed to the several cost items on the income statement, therefore the average percentage of employee benefits and provisions, according to the year's total costs is taken into account when forecasting the balance sheet value in the particular year. Employee benefits and provisions account for 3.8% and 5.6% of total costs respectively.
Deferred tax liabilities are forecasted in line with deferred tax assets, with 15.1% of total income taxes in the forecasted period. Simultaneous to the asset side it is estimated based on the average during the years after the IPO, where they started to pay taxes as an autonomous entity and not as part of the FCA Group.
Table 3: Total Long Term Liabilities Forecast (in t Euro)
Ferraris debt can be broken down into four components: syndicated loan, bond, securitizations and other financial liabilities. The syndicated loan with a maturity of four years
was set up in order to pay down the financial liabilities with FCA group. It now consists of a term loan and a revolving credit facility. The bridge loan was paid down and replaced by issuing a long-term bond with a maturity of seven years. The securitization has a five-year maturity. Other financial liabilities are associated with Ferrari Financial Service business on the same level with different maturities. According to its maturity and tendency to recover the debt with new debt Ferrari is subject to keep its current debt level stable over the forecasted period.
Other liabilities that are considered to be non-current liabilities are subject to stay at a constant level at Q3 2016 level.
5.2.4 Current Liabilities
In line with current assets, accounts payables, and other liabilities are closely connected to cost of sales. Thus, the relative value of the cost of sales will be applied to estimate the future balance sheet values of these items. Accounts payables are broken down into days and amount to 135.8 days of cost of sales until they will be paid for the forecasted period.
Other liabilities are measured as percentage of total cost of sales at historical average level at 34.2%. Other liabilities are seen as one block and are not broken down into the specific items as they are all attached to cost of sales.
Table 4: Total Current Liabilities Forecast (in t Euro)
The item current tax payable is also seen on historical average regarding real total income taxes paid according to the income statement at the specific end of the year.
5.2.5 Equity
Based on the above-stated assumptions of the Balance Sheet development during the explicit period, Equity is growing accordingly at profit retention rate. The company has not paid any dividends since its IPO but announced to pay dividends dependent on business conditions, financial conditions, earnings, cash balances, etc. At the moment of this valuation the company has not announced any dividend payments nor any dividend plan for the future, thus dividends will not be considered in this work.
Non-controlling interest was mainly attributable to the subsidiary Ferrari Financial Services and the Chinese distribution company, Ferrari International Cars Trading (Shanghai).
derive at the full ownership of 100%. This affects the payments in non-controlling interests. Thus, payments in non-controlling interest will be kept at the same level as interim 3Q 2016.
5.3 Cash Flow Statement
The cash flow statement is one of the most essential components for the financial reporting of a company. It breaks down the sources of cash inflow and outflow. Thus, it is essential to forecast this overview of future cash movements and its allocation. The most important input comes from the capex, depreciation, and net working capital prediction.
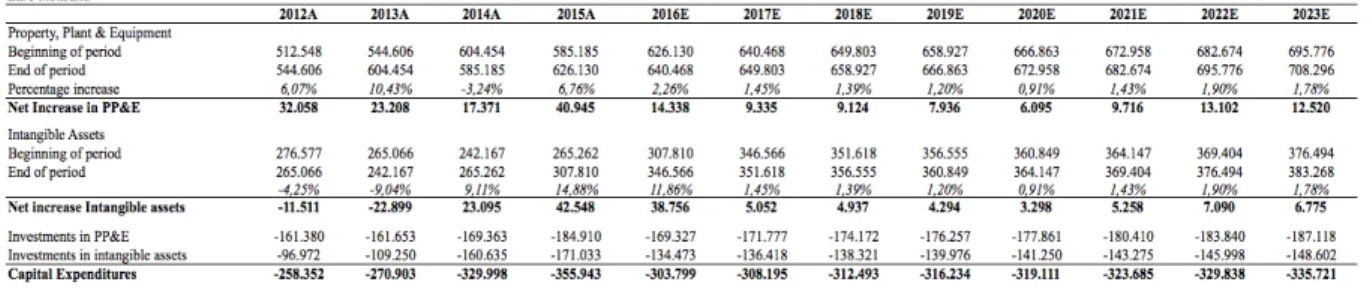
5.4 Capital Expenditures (Capex) and Depreciation
Capital expenditures were calculated based on the historical development of the company's investments in PP&E and externally acquired intangible assets. Historically around 57% of total intangible assets were either externally purchased or patents with useful life and therefore subject to amortization. As observable in the Prospectus (2015) the company just made “significant investments” in their facilities in Italy between 2002 and 2015. Therefore Capex is subject to decrease and depreciation is profoundly influenced of that as the useful life is set to 20 years.
Table 5: Capex Forecast
Depreciation is calculated as percentage of PP&E and intangible assets that were acquired externally at historical values and carried forward at a slightly lower level than sales growth during the explicit period.
5.5 Net Working Capital
The precise forecast of the items to calculate the net working capital can be found above in the chapter of the balance sheet. The general approach of matching inventories, trade payables, and trade receivables regarding days to cost of goods sold or sales, respectively. Other items that have to be considered are estimated at a historical percentage of total revenues. The historical average of the years 2012-Q3 2016 were deemed to determine the explicit period.