Recebido: 04/10/2019 Aprovado: 24/10/2019
1 Federal University of Pampa (UNIPAMPA) - Campus Alegrete, Brazil. Av. Tiarajú, 810 - Alegrete - RS - Brazil. CEP: 97546-550.
2 Pos-Graduate Program in Mechanical Engineering (PROMEC), Federal University of Rio Grande do Sul (UFRGS) - Porto Alegre, Brazil. Sarmento Leite, 425, 2 floor. Porto legre – RS –Brazil. CEP 90050-170.
3 Pos-Graduate Program in Engineering (PPEng), Federal University of Pampa (UNIPAMPA) - Campus Alegrete, Brazil. Av. Tiarajú, 810 - Alegrete - RS - Brazil. CEP: 97546-550.
* Corresponded autor: [email protected]
ANALYSIS OF STRENGTH OF BRITTLE MATERIALS UNDER DIFFERENT STRAIN RATES USING LDEM SIMULATIONS
Carla Driely Morsch Vidal1, Guilherme Schumacher da Silva2, Chiara Valsecchi1, Luis Eduardo Kosteski3*
ABSTRACT
This paper presents a study on the variation of strain rate influence with the scale effect in quasi-brittle materials. Works in the literature report an increase of dynamic resistance with strain rate. To study this relation, a numerical model that combines the Finite Element Method and the Lattice Discrete Element Method is employed. This mixed model was implemented on the commercial software Abaqus/Explicit. The samples are prepared with FEM at the extremity and LDEM for the central part, which has a reduction in the cross-section, so the rupture occurs in the middle. In the simulations, four model specimens with dimensional variations were subjected to direct tensile testing with different strain rates. The results showed that with the increase of applied strain rate, the resistances also increase and the body dimension influences this behavior. The variation of the tensile strength is found without modifications on the elemental constitutive relationship or material parameters. At last, a method that could lead to an independent relationship between the dynamic intensification and the stain rate of scale effect is also proposed.
1. INTRODUCTION
Concrete structures with special applications, such as nuclear reactor contention, protection shelters and protection plates against explosions, among others, can suffer loading with high tension or strain rates, varying from 10 s-1 to 1000 s-1. Vehicle collisions, explosion impacts and earthquakes can also generate high tension or strain rates, at which the material apparent resistance can significantly increase.
Malvar and Crawford (1998) presented a data collection to sustain that in concrete, the dynamic increase factor (DIF), i.e. the ratio of the dynamic to static strength, is a bilinear function of the strain rate (in a log-log plot): below 10e-6 s-1 there is no increase in the strain rate, while the slope changes when the rate reaches 1 s-1.
Several works evaluate the effect of the strain rate in concrete with different tests and different specimen sizes. Among others, Brara et al. (2001) performed tests experimentally in wet concrete based on the Hopkinson compression bar; Wu et al. (2005) performed experimental tests and numerical simulations with the finite element method and Weerheijm and Van Doormaal (2007) also measured the tensile failure of concrete at high loading rates with an alternative split Hopkinson bar test methodology. Lu et al. (2014) submitted recycled aggregate concrete specimens to compressive loading based on split Hopkinson pressure bar tests, finding that impact properties of recycled aggregate concrete exhibit strong strain-rate dependency, that increases approximately linearly with strain-rate. Moreover, Ibrahim et al. (2016) investigated the stress-strain characteristics of hybrid fiber reinforced concrete composites under dynamic compression using the Split Hopkinson Pressure Bar getting that degree of fragmentation of composite specimens increases with increase in the strain rate.
Lu and Li (2011) reported that, at high strain rates, the triaxiality effect on the increase of the dynamic tensile strength in concrete is negligible. According to them, the increase in tensile strength is associated with the intrinsic properties of the material, instead of “structural effects”; for this reason, the effect can be mostly assigned to micro fissure inertia.
An important aspect evaluated by Riera et al. (2011), for both physical or numerically simulated displacement controlled tensile tests, is that it can only be considered conclusive the results where the ratio between the displacement rate and the propagation rate of the longitudinal wave Cp does not exceed the strain εmin, at which the damage starts to form in the
material. Moreover, the minimal strain has to be higher than the critical deformation failure (εp), at which the damage occurs. The study concludes that a strain rate threshold that varies
with the material properties and the specimen size has to be considered to validate the simulations.
Another aspect to be considered is that the tests in the engineering practice operate on models and specimens extremely reduced in comparison with the real structures. These tests are essential to evaluate structure or composition material behaviors, and for this reason, it is essential to consider the scale effect in order to transfer the experimental results to the real structure scale.
The size effect is a phenomenon characterized by structural behavior changes when dimensional variations occur. This phenomenon can alter the main parameters that govern the mechanical solid behavior, such as stress, strain and fatigue material resistance, being that these parameters decrease when the structure size increases.
On the topic of size effect of quasi-brittle materials, several contributions can be found in the literature; among others, it is important to highlight the works of Carpinteri and coworkers. Carpinteri presented his basic ideas in his book (Carpinteri, 1986), and few years later, in Carpinteri and Chiaia (1997), he introduced the multifractal law. This theory was applied in different contests, for example in Carpinteri et al. (2003), and it will be used in one of the applications carried out in this work. Another classical approach to understand the size effect was proposed by Bažant and Chen (1997). An interesting discussion about the two theories could be followed in Bažant and Yavari (2005) and in Carpinteri et al. (2007).
Different methods are available in the literature to study these effects. There are several aspects to be considered in applying a classical approach, as finite element method (FEM) and boundary element method (BEM), to solve a problem where a fracture could appear. For this reason, a combination between these methods and the cohesive interface technique (Xu and Needleman, 1994), or the extended finite element formulation (Moes and Belytschko, 2002) should be applied to bypass the hypothesis of a continuum medium used in the classical methods. Cotsovos and Pavlovic´ (2008), Ožbolt et al. (2014) and Guo et al. (2017), among others, use the Finite Element Method to model concrete tensile failure under high loading rates.
On the other hand, the discrete element approach is another way to solve the problem, as it is more natural to deal with fracture and fragmentation. The works of Li and Liu (2002), Liu and Liu (2007) and Silling and Lehoucq (2010) relate with this approach.
Lattice Models, of which the formulation used in the present work is a special case, belong to this Discrete Element Method group. Basically, the solid is modeled by means of an array of uniaxial elements, which interconnect nodal masses with two or three degrees of
freedom. The stiffness of these elements can be determined from the mechanical properties of the anisotropic solid to be represented. Schlangen and van Mier (1995), Rinaldi and Lai (2007), Rinaldi (2009; 2011) and Mastilovic (2011) employ different versions of the Lattice approach, while Hwang et al. (2016, 2017) and Cusatis (2011) also use Lattice Models to simulate concrete tensile failure under high loading rates.
The method used in the current work was proposed originally by Riera (1984). In this formulation, the lattice has a regular or quasi-regular arrangement, and no rotations are considered within the connections. In the lattice discrete element method (LDEM) the masses are concentrated in the nodes, interconnected by one-dimensional elements with constitutive relation, based on the bilinear law proposed by Hillerbog (1978), which allows to model the fracture and the anisotropic damage with relative facility.
Riera et al. (2011) employed LDEM to carry out simulations at high strain rates for concrete. An increase in tensile strength was observed without any changes in the constituent equations or material parameters. Simulations on the size effect can be found in several applications, as in Miguel et al. (2010) and Iturrioz et al. (2009) for concrete beam; Riera et
al. (2014) for rocks dowels; Kosteski et al. (2011) for the analysis of crack propagation in
solids.
With the aim to develop a flexible modeling tool, LDEM is implemented using Abaqus/Explicit (Dassault Systèmes, Simulia, 2013). This allows to combine the LDEM with the capabilities of Abaqus for contact and eigenvalue analyses, and for the inclusion of rigid parts into the model assembly. The validation of this implementation is found in Kosteski et
al. (2010); this approach was used to simulate reinforced concrete plates subjected to impact
in Kosteski et al. (2014) and to model the falling-weight impact test of PMMA specimens in Kosteski et al. (2015).
In this work, a combination of the lattice discrete element method (LDEM) with the finite element method (FEM) will be used to perform direct tensile tests for different size specimens and strain rates; the results will be evaluated and compared with the results present in the literature.
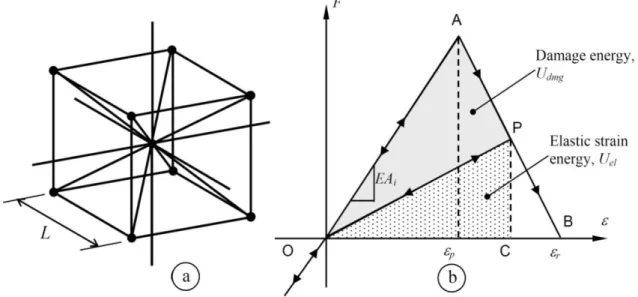
2. THE LATTICE DISCRETE ELEMENT METHOD IN FRACTURE PROBLEM The lattice discrete element method (LDEM), suggested by Riera (1984), consists in representing the continuum through a spatial arrangement of bars, whose mass is concentrated at the truss nodes. The basic cubic module, as shown in Figure 1, is composed by 20 bar
corresponding to the three components of the displacement vector in a global reference system.
Figure 1 (a) Basic DEM cubic module. (b) Hillerborg´s constitutive law adopted for concrete.
The discrete element representation of the orthotropic continuum was adopted to solve structural dynamic problems by means of explicit and direct numerical integration of the equations of motion, assuming the mass lumped at the nodes. The equivalence between an orthotropic elastic solid, with principal orthotropic axes oriented in the direction of the longitudinal elements, and the cubic array model was demonstrated by Nayfeh and Hefzy (1978), within the framework of linear elasticity.
For the basic geometric arrangement used in this version of LDEM, the length of longitudinal and diagonal elements are 𝐿𝐿𝑛𝑛 and 𝐿𝐿𝑑𝑑 = �3𝐿𝐿𝑛𝑛/2, respectively. The equations that relate the equivalent bar stiffness and properties of an isotropic elastic solid are presented as follows:
𝐸𝐸𝐸𝐸𝑛𝑛 = 𝐸𝐸𝐸𝐸𝐿𝐿2, 𝐸𝐸𝐸𝐸𝑑𝑑 = 𝐴𝐴𝑛𝑛2√33 (1) Where Young’s module is denoted by E, L is the length of longitudinal elements, 𝛿𝛿 = 9𝜈𝜈
(4−8𝜈𝜈) and 𝐸𝐸 = 9+8𝛿𝛿
18+24𝛿𝛿 are coefficients that relate the parameters defined for longitudinal and diagonal elements with the linearly elastic solid properties. Poisson’s coefficient ν appears in the definition of factor δ. The LDEM model used herein is completely equivalent to an isotropic elastic solid when ν = 0.25. For other values of Poisson’s ratio, small differences can appear, as discussed by Jikov and Yates (2012). The relations between the properties of elastic solids and LDEM element stiffness are further examined by Kosteski et al. (2012).
It is worth noting that, since nodal coordinates are updated at every time step, large displacements are naturally accounted for. At the same time, the LDEM has a natural ability to model cracks. They can be introduced into the models as pre-existent features or as the irreversible effect of crack nucleation and propagation. Crack nucleation and propagation requires non-linear constitutive models for material damage, in order to allow the elements to break when they attain a critical condition.
Each bar element submitted to traction in this model follows the bilinear softening law proposed by Hillerborg (1978), adopted for the representation of concrete material (Figure 1 b). In the case of compressive loads, the material behaves as linear elastic. Thus, the failure in compression is induced by indirect traction.
The area under the curve is equivalent to the energy density that is necessary to break the element. From linear fracture mechanics, the relationship between the energy density and the properties of the model in LDEM can be expressed as (2).
∫ 𝐹𝐹(𝜀𝜀)𝑑𝑑𝜀𝜀𝜀𝜀𝑟𝑟
0 =
𝐺𝐺𝑓𝑓𝐴𝐴𝑖𝑖𝑓𝑓
𝐿𝐿𝑖𝑖 (2)
In the first term of this expression, F is the force and ε is the strain of an element. In the second term, Gf is the specific fracture energy, a material property, L is the module edge
length and Af is the equivalent fracture area defined in order to satisfy the condition that the
energy dissipated through the continuum fracture and by the discrete representation are equivalent.
The angular coefficient of the elastic part represents the equivalent elastic modulus, that is the product between cross-section area and the Young modulus EAi. A basic parameter
of the bilinear constitutive relationship is given by: 𝜀𝜀𝑝𝑝 = �𝐸𝐸𝑑𝑑𝐺𝐺𝑓𝑓
𝑒𝑒𝑒𝑒 (3)
In equation (2), εp represents the strain peak, where Gf is the material toughness and deq the characteristic length, which is considered a material property. The strain εr is related to
the ultimate load of the element and is defined by ε𝑟𝑟 = 𝜀𝜀𝑝𝑝𝑑𝑑𝑒𝑒𝑒𝑒(𝐴𝐴𝑖𝑖
𝑓𝑓 𝐴𝐴𝑖𝑖)(
2
𝐿𝐿𝑖𝑖) (4)
It should be noted that εr depends on the material properties and also on the
discretization level. Figure 1b shows the bilinear relationship where the strains εp and εr are
It is important to point out that the specific fracture energy Gf is proportional to the
area below the bilinear elemental constitutive law. Hence, when the damage energy density equals the fracture energy, the element fails and loses its load carrying capacity.
The intrinsic inhomogeneities of materials are represent by random fields introduced by variations in the properties E, ρ e Gf, based on three-dimensional stochastic fields proposed
by Shinozuka and Deodatis (1991). The distribution of the random field and its correlation length can also be fit. An explanation of how this can be performed is found, among other, in Miguel et al. (2008), Puglia et al. (2010) or Kosteski et al. (2012).
In this work, it is admitted that Gf is a 3D random field, herein assumed to have a
Weibull probability distribution with defined mean, coefficient of variation and correlation length. This postulation is very important because the random field is independent of the LDEM mesh. For this reason, the simulation results do not change when the LDEM mesh is modified and the modeled random field remains constant (Kosteski et al. 2012, Birck et al. 2018).
The model space is encircled by a regular prism. This prism is subdivided in equal minor prism of equal size to the correlation lengths (lcx, lcy, lcz) of the random field. Every vertex of these prisms, herein called poles, is associate to a statistical independent random value of the Gf field, with a Weibull probability distribution function with desired mean and
coefficient of variation. In this way, the special random field of toughness Gf is defined.
Then, the prismatic domain of the random field and the LDEM mesh domain are superimposed. To each LDEM element is assigned a property, Gf in this work, linearly
interpolated from its eight nearest poles, considering the barycenter of each LDEM element as weights for this calculus. In this way, if the mesh changes, the interpolated values will be kept consistent in the same regions. This process of tridimensional interpolation was first employed in LDEM applications by Miguel et al. (2008).
All the explanation related to this method can be found, between others, in Kosteski et al. (2009, 2011, 2012, 2014, 2015), Iturrioz et al. (2009), Miguel et al. (2010) or Riera et al. (2011, 2014).
2.1 LDEM in Abaqus-Explicit
In order to analyze structures with complex geometry or non-standard boundary conditions, the Lattice Discrete Element Method (LDEM) was introduced in the ABAQUS/Explicit (Dassault Systèmes, 2013) system. The LDEM is implemented using 2-node linear-displacement truss elements (T3D2) for the model discretization.
The non-linear constitutive law is implemented through the smeared model due to Hillerborg (1978) by means of the *BRITTLE CRACKING, *BRITTLE SHEAR and *BRITTLE FAILURE keywords. *BRITTLE CRACKING is set to TYPE=STRAIN to specify the critical failure strain (point A in Figure 1b) and the limit strain (point B in Figure 1b); *BRITTLE SHEAR is specified to complete the model data only, as Mode-II shear stresses are not induced in bar elements; *BRITTLE FAILURE is used to remove the failed elements from the model after they attain the limit strain.
Additionally, the material property variability was account for. Validations of this DEM version and more details about its implementation were presented by Kosteski et al. (2010; 2014; 2015).
3 SIMULATION OF RATE DEPENDENCE AND SCALE EFFECT OF CONCRETE DISPLACEMENT CONTROLLED TENSILE TESTS
3.1 DESCRIPTION OF THE NUMERICAL MODEL
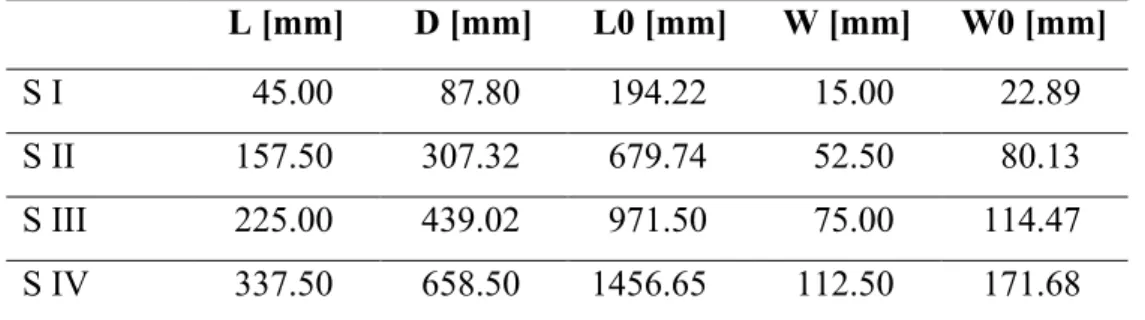
Figure 2 represent the characteristic geometry of the “dog bone” samples used in the simulations, while Table 1 resumes the dimensions of each specimens (configurations I to IV), all presenting the same thickness, t = 15 mm. It is important to notice that the specimen S II was obtain multiplying all the dimensions of the specimen S I for 3.5; samples S III and S IV were obtained similarly, and are, respectively, 5 and 7.5 times sample S I.
Figure 2 Geometry of the specimen with a “dog bone” shape used in the simulations. Table 1 Dimensions of the concrete specimens
L [mm] D [mm] L0 [mm] W [mm] W0 [mm]
S I 45.00 87.80 194.22 15.00 22.89
S II 157.50 307.32 679.74 52.50 80.13
S III 225.00 439.02 971.50 75.00 114.47
For the simulations, the samples described were uploaded into the software Abaqus, which allows to combine the finite element method (FEM) and the lattice discrete element method (LDEM). Particularly, the specimens were elaborated using FEM at the extremities and LDEM for the central section; this is possible because the rupture is expected in the central region, as it suffers a reduction of the transversal section. In Figure 3, the simulated models are reported in details. In order to avoid connection ruptures, the junction between the two parts was defined through the central nodes of the outermost cubic modules. The insert b) in Figure 3 illustrate the junction scheme; for more details, please see Kosteski (2012).
The samples are fixed on the inferior surface (insert c, Figure 3) and a growing strain is applied, uniformly distributed, on the superior surface, inducing a nominal uniform tensile strength (insert a, Figure 3).
The portion of the model S I evaluated through the FEM presents 80 elements C3D8R (an 8-node linear brick, reduced integration, hourglass control), while the portion simulated with the LDEM has 2 cubic modules in length, 7 in height and 2 in thickness, summing 300 degree of freedom. The models S II (7x22x2 LDEM elementary cubes), S III (10x31x2 LDEM elementary cubes) and S IV (15x46x2 LDEM elementary cubes) have 1008, 2120 and 3480 finite elements, as well as 2580, 5028 and 10908 LDEM degree of freedom, respectively.
Figure 3 Specimens simulated with LDEM and FEM in the Abaqus environment. The inserts detail the boundary conditions (a and c) and the contact area between the two methods (b).
The property values for concrete used in the simulations are collected in Table 2. These data were already used by Riera et al. (2014), as the parameter validity to appropriately represent the material was confirmed by experimental tests. It is important to note that the same LDEM element size is adopted for all the simulations. This means that, when the dimension of the sample change, the quantity of elements of the LDEM mesh also changes, but its length is always the same.
The propagation rate of the longitudinal wave in the simulated material will be:
C𝑝𝑝 = �𝐸𝐸 𝜌𝜌⁄ = 3603.28 m/s (5)
Riera et al. (2011) point out that, for both experiments or computational evaluations, traction tests with displacement control are valid only if the ratio between the displacement rate and the rate of propagation of the longitudinal wave in the material do not exceed the deformation εmin, in which the fissure starts to occur.
Table 2 Simulation data for concrete
Properties Concrete E [GPa] 29.43 ρ [Kg/m³] 2266.7 ν 0.25 Gf [N/m] 130 CV(Gf) [%] 50 εp 2.059E-4 L [m] 0.0075 lcx = lcy = lcz [m] 0.03 Dt [s] 4.47E-7
With the properties used in the present LDEM simulations, this relationship is fulfilled when the maximum test rate is equal to εpCp = 0.742 m/s. Therefore, the maximum strain rate
for the S I, S II, S III and S IV samples are 3.821, 1.092, 0.764 and 0.509 s-1, respectively. The specimens were tested under eight different strain rates (constant) equal to 0.1%, 1%, 5%, 10%, 20%, 30%, 50% and 80% of the maximum strain rate of each sample, in order to verify the effects of the loading rate. The strain rates corresponding to 0.1% of the maximum strain (0.0038; 0.0011; 0.00076 and 0.00051s-1, respectively) were considered as static loading. For each specimen size and different strain rate, 4 repetitions were realized to validate the model.
3.2 SCALE EFFECT OF STATIC LOAD
Four simulations for each specimen were made under static loading (0.1% of the maximum deformation rate). In Figure 4a, it is possible to see the result of the stress-strain curves obtained for the sample S II. Figure 4b represents the variation of the maximum stress in relation to the total length of specimen, L0. It is possible to observe the scale effect on the stress, since it can be verified that the rupture tension decreases when the size of the specimens increases. The rupture tension for sample S IV and S V are statistically different from sample S II and different among them (one-way Anova, Tukey and Fisher tests, p < 0.05).
The maximum stress for class C60 concretes, with 60MPa of compressive strength, presents a strain of about 0.2% in compressive load. In this kind of material, the ultimate strength in compression is usually five to ten times larger than in tension (see Kupfer and Gerstle, 1973). Therefore, the values obtained in these simulations well correspond with the experimental ones. Moreover, the size effect found in experiments on concrete specimens (Ferro 1994; Carpinteri and Ferro 1998; van Vliet and van Mier 2000) also agree with the simulations here presented.
0 50 100 150 200 250 300 0.0 2.0 4.0 6.0 8.0 Sim 1 Sim 2 Sim 3 Sim 4 σ (MP a) ε (µm/m)
S II
200 400 600 800 1000 1200 1400 1600 0.0 2.0 4.0 6.0 8.0 σmáx (MP a) L0 (mm)Figure 4 a) Stress versus strain curves for specimen S II with static loading, and b) Variation of maximum stress for different sizes of specimens.
3.3 STRAIN RATE EFFECT
Figure 5 shows the stress-strain response of one simulation performed for each specimen size under the different strain rates applied. The strain is calculated on the central part of the specimen and the reaction was measured in the lower part of the sample, at which the displacement was restricted. The values in the legend represent the percentage of the
deformation rate applied in relation to the calculated maximum. In this figure, it can be clearly seen that, as the loading rate increases, the maximum tension increases.
It is important to note that the strains are calculated from the imposed displacement on the upper surface of specimen (inset a in Figure 3) and the stress through the reaction forces measured on the inferior surfaces (inset c in Figure 3). For this reason, a delay might appear in the strain-stress curves at elevated strain rates. In these cases, the specimen starts to deform, but the tensile wave takes some time to reach the opposite surface were the reactions are measured. This phenomenon is clearly observed in Figure 5.
0 50 100 150 200 250 300 0.0 3.0 6.0 9.0 12.0 15.0
S I
σ (MP a)ε
(µm/m) 0 50 100 150 200 250 300 0.0 3.0 6.0 9.0 12.0 15.0S II
σ (MP a)ε
(µm/m) 0 50 100 150 200 250 300 0.0 3.0 6.0 9.0 12.0 15.0S III
σ (MP a)ε
(µm/m) 0 50 100 150 200 250 300 0.0 3.0 6.0 9.0 12.0 15.0S IV
0,1% 1% 5% 10% 20% 30% 50% 80% σ (MP a)ε
(µm/m)Figure 5 Stress versus strain curves for each specimen under the different strain rates employed.
Table 3 presents the mean maximum stress of the four simulations performed for each loading velocity and size of the sample. This table also summarizes the coefficient of variation (CV) found for each case. The strain rates are given in relation to the maximum rate that can be applied to each specimen size, as stated before.
Table 3 Maximum stress and coefficient of variation. Percent of ε& maximum [%] CP I CP II CP III CP IV σmax,average [MPa] CV [%] σmax,average [MPa] CV [%] σmax,average [MPa] CV [%] σmax,average [MPa] CV [%] 0,1 5,86 13,19 6,34 4,06 5,67 3,93 5,32 11,60 1 5,86 13,17 6,35 4,32 5,69 3,84 5,36 11,41 5 6,25 15,02 6,52 3,88 5,84 2,84 5,62 8,20 10 6,53 13,83 6,78 5,52 6,12 1,15 5,79 8,81 20 7,18 9,37 7,43 3,61 7,07 4,29 7,04 4,47 30 6,94 14,30 7,17 7,41 6,99 2,81 6,83 5,71 50 10,1 1,12 10,1 0,46 10,7 0,23 10,6 1,42 80 13,1 9,36 13,1 4,90 13,3 3,74 13,1 4,97
In order to graphically analyze the effect of the strain rate, the dynamic increase factor (DIF) is normally used; the DIF represents the ratio between the dynamic and the static strength. Figure 6 shows the DIF values versus strain rate curve for the four simulated test specimens. Figure 6a reports these curves for the 4 specimens simulated, where each point is one replicate. For the same CP size, the variation of the results between repetitions can be observed. It was verified that, for the deformation rate of where the change of inclination occurs, the instability of the values is higher.
1E-3 0.01 0.1 1 1.0 2.0 3.0 S I S II S III S IV DI F(
σ
d/σ
e)ε
.
(s-1) 1E-3 0.01 0.1 1 1.0 2.0 3.0 S I S II S III S IV DI F(σ
d/σ
e) Normalizedε
.
(s-1)Figure 6 a) Simulation of the effect of the deformation rate on the traction for concrete; b) Scaled adjustment of the previous curves by multiplying the strain rate by the scale factor.
A scale effect generated by different loading rates is observed in Figure 6a. It is important to point out that the effect of structural scale is being eliminated, because the dynamic stress is divided by the static stress obtained for the same analyzed body. Thus, the
static tension considered to obtain the Dynamic Intensification Factor is that of the specimen under analysis and not the reference specimen.
This way of presenting the results is widely used in the literature, where the ordinate is normalized but its abscissa is not. To solve this question and produce a totally normalized graphic, the strain rate were related to the minor specimen SI. The differences in the curves of Figure 6a occur due to the different specimen sizes, presenting a scaling factors in relation to S I of 1.5 (S II), 3.5 (S III) and 5.0 (S IV). Multiplying these scaling factors by the strain rates of the corresponding specimens at each point, it is possible to generate the curve shown in Figure 6b. Clearly, it can be seen that the difference in the curves was minimized using the ratio of the sample size. This adjustment eliminates the two types of scale effects generated in the model.
Normally, the data in the literature use a rate of static deformation much smaller than the one used in this work. Therefore, one more simulation was performed for each sample with a deformation rate of 10-4s-1 to verify if there was variation of the rupture strength in relation to the one performed with the previous deformation rate, which was considered the static test. No resistance variation was found.
4 EVALUATION OF RESULTS AND COMPARISON WITH LITERATURE DATA To better analyze the influence of the geometry and dimensions of the specimens, the data presented by Malvar and Crawford (1998) were studied. These authors presented a data collection that sustains that in concrete the dynamic increase factor (DIF), i.e. the ratio of the dynamic to static strength, is a bilinear function of the deformation rate (in a graph log-log),: the DIF increases for strain rates below 10-6s-1, and presents a slope change at a strain rate of 1s-1. Figure 7a is a representation of the results presented by these authors, but only reporting the data for which the dimensions of the specimens were described. In this paper, Melliger and Birkimer obtained the results using concrete cylinders of 260mm in length and 50.8 in diameter, while Birkimer used cylinders of 890mm in length and 50.8 in diameter. Ross tested several cylindrical specimens of concrete using the Slip-Hopkinson Pressure Bar (SHPB) in direct tension, with specimen diameters of 50.8 and 76.2 mm. It also made tests using the Brazilian test (split tension) varying the diameter from 19 to 51 mm, and length from 45 to 51 mm. John, Antoun and Rajendran also used SHPB with specimens of 12.7, 25.4 and 50.8 mm in diameter and 6.4 and 12.7 mm in thickness.
being much smaller than the diameter of the sample cylinder. By the forms of the ruptures, it is also considered that the characteristic dimension of the sample will be its diameter. In Table 4, the variation of the characteristic size of the specimen is reported for each author of the test. The last column of Table 4 present the scaled factor calculated as the ratio between the diameter of the specimens and the minimum diameter related in the experiments.
Table 4 Sizes of specimens.
Author Diameter [mm] Length [mm] Factor
John et al. 12,7 - 25,5 - 50,8 6,4 - 12,7 1 – 2
Ross, Split tension 19 - 50,8 45 - 51 1.49 – 4
Mellinger, Birkimer 50,8 260 4
Birkimer 50,8 890 4
Ross, SHPB 50,8 - 76,2 4 – 6
Analyzing Figure 7a, it can be observed that the data of John et al. are offset to the right in respect to the data cloud. These data were found to have the smaller cylinder diameters. The results of Ross Split tension are more central in the data cloud. Finally, the data of Mellinger and Birkimer are lagged to the left of the data cloud, these being the largest samples.
The change between the sizes of the cylinders analyzed by the different authors is not very significant, although apparently, there is a displacement of the data according to the characteristic size of the specimen.
0.1 1 10 100 1.0 2.0 3.0 4.0 5.0 6.0 7.0 8.0 9.0 10.0 John et al. Ross split tension Melliger/Birkimer Birkimer Ross direct tension
DI F(
σ
d/σ
e)ε
(s-1).
0.1 1 10 100 1.0 2.0 3.0 4.0 5.0 6.0 7.0 8.0 9.0 10.0 John et al. Ross split tension x 1,49 Melliger/Birkimer x 4 Birkimer x 4 Ross direct tension x 4DI F(
σ
d/σ
e) Normalizedε
.
(s-1)Figure 7 Analysis of literature data, a) original from Malvar and Crawford (1998), b) scaled values.
Figure 7b reports the same data presented in Figure 7a, but with the deformation rates multiplied by the scaling factors, i.e. normalizing the strain rate in respect to the minimum characteristic size used by John et al. (12.7mm). As the works of John et al. and Ross used more than one specimen diameter, and it was not possible to distinguish which results belonged to which diameter value, the factors highlighted in the last column of Table 4 were adopted.
As observed for the simulations presented before, if the size effect is taken into consideration, also the dispersion of DIF vs strain rate curve reported in the literature is reduced. Once more, the scaling factor reduces the differences found in the DIF curve, decreasing the effects related to the different specimen dimensions. Although other characteristics of concrete, as its strength, granulometry of its compounds, maximum aggregate size, cement type and humidity, among others, can change the DIF ratio with the rate of deformation applied, we demonstrated here that also the size of the sample has a very important impact on the results.
5 CONCLUSIONS
In this work we presented a mixed model that uses FEM and LDEM to simulate the variation effects of the mechanical responses with the deformation rate and with the size of the specimens studied. From the analyses, the following conclusions are presented:
- It was possible to observe two different scale effects: the first can be observed without increasing the deformation rate, while the other can be perceived with the application of different deformation rates.
- The increase in tensile strength was observed without any change in the material constitutive equations or parameters. Thus, the proposed method of the combined use of LDEM and FEM can capture strain rate dependence.
- If it is taken into account the scaling factor, the response of the DIF vs strain rate curve is better defined. If this effect would be considered in experimental analysis (as verify with the data reported in literature), the resulting DIF distribution could be narrower.
As widely quoted and studied, there are other effects that also alter the response to the variation of the deformation rate. Among other, we can mention granulometry and internal composition of the material, humidity, the characteristic strength and the concrete size. These factors must be taken into account in order to compare the actual effect of the deformation rate with the size of the analyzed specimen.
ACKNOWLEDGMENTS
This study was financed in part by the Coordenação de Aperfeiçoamento de Pessoal de Nível Superior - Brasil (CAPES) - Finance Code 001. The support of CNPq and UNIPAMPA are also gratefully acknowledged.
REFERENCES
ABAQUS/Explicit, Version 6.13, Dassault Systèmes Americas Corp., 2013.
Bažant, Z.P. and Chen, E.P. (1997). Scaling of structural failure. Appl. Mech. Rev. 50, 593-627.
Bažant, Z.P. and Yavari, A. (2005). Is the cause of size effect on structural strength fractal or energetic-statistical?. Engineering Fracture Mechanics. 72, 1-31.
Brara, A., Camborde, F., Klepaczko, J.R., Mariotti, C. (2001). Experimental and numerical study of concrete at high strain rates in tension. Mechanics of Materials,33(1), 33-45. Birck, G., Iturrioz, I., Riera, J.D., Miguel, L.F.F. (2018). Influence of mesh orientation in
discrete element method simulations of fracture processes. Journal of Strain Analysis For Engineering Design, 53 (6): 400-407.
Carpinteri, A. (1986). Mechanical damage and crack growth in concrete: plastic collapse to brittle fracture. Dordrecht: Martinus Nijhoff.
Carpinteri, A. and Chiaia, B. (1997). Multifractal Scaling Laws in the Breaking Behaviour of Disordered Materials, Chaos, Solitons & Fractals, 8 (2), 135-150.
Carpinteri, A., Chiaia, B., Cornetti, P. (2003). On the mechanics of quasi-brittle materials with a fractal microstructure, Engineering Fracture Mechanics, 70, 2321-2349.
Carpinteri, A., Chiaia, B., Cornetti, P., Puzzi, S. (2007). Comments on “Is the cause of size effect on structural strength fractal or energetic-statistical?” by Bažant & Yavari [Engng Fract Mech 2005; 72: 1–31]. Engineering Fracture Mechanics, 74(17), 2892-2896.
Carpinteri, A., Ferro, G. (1998). Scaling behaviour and dual renormalization of experimental tensile softening responses, Mater. Struct. 31 (5) (1998) 303–309.
Cotsovos, D.M., Pavlović, M.N. (2008). Numerical investigation of concrete subjected to high rates of uniaxial tensile loading. International Journal of Impact Engineering, 35(5), 319-335.
Cusatis, G. (2011). Strain-rate effects on concrete behavior. International Journal of Impact Engineering, 38(4), 162-170.
Ferro, G. (1994). Effetti di scala sulla resistenza a trazione dei materiali. Ph.D. Thesis, Politecnico di Torino, Torino, 1994.
Guo, Y.B., Gao, G.F., Jing, L., Shim, V.P.W. (2017). Response of high-strength concrete to dynamic compressive loading. International Journal of Impact Engineering, 108, 114-135.
Hillerborg, A. (1978). A model for fracture analysis. Cod LUTVDG/TV BM-3005, p.1-8. Hwang, Y.K., Bolander, J.E., Lim, Y.M. (2016). Simulation of concrete tensile failure under
high loading rates using three-dimensional irregular lattice models. Mechanics of Materials, 101, 136-146.
Hwang, Y.K. and Lim, Y.M. (2017). Validation of three-dimensional irregular lattice model for concrete failure mode simulations under impact loads. Engineering Fracture Mechanics, 169, 109-127.
Ibrahim, S. M., Almusallam, T. H., Al-Salloum, Y. A., Abadel, A. A., Abbas, H. (2016). Strain rate dependent behavior and modeling for compression response of hybrid fiber reinforced concrete. Latin American Journal of Solids and Structures, 13(9), 1695-1715. Iturrioz, I., Miguel, L.F.F., Riera, J.D. (2009). Dynamic fracture analysis of concrete or rock
plates by means of the Discrete Element Method. Latin American Journal of Solids and Structures, 6(3), 229-245.
Kosteski, L.E. (2012). Aplicação do método dos elementos discretos formado por barras no estudo do colapso de estruturas. 2012. 6-59 f. Tese (Doutorado em engenharia) - Universidade Federal do Rio Grande do Sul, Porto Alegre, 2012.
Kosteski, L.E., Barrios, D.R., Iturrioz, I. (2009). Fractomechanics parameter calculus using the Discrete Element Method. LAJSS, 6, 301-321.
Kosteski, L.E., Pinto, O., Iturrioz, I. (2010). Combinação entre o método dos elementos discretos composto por barras e o método dos elementos finitos no ambiente Abaqus. Mecánica Computacional, Cilamce-Mecom 2010, v. XXIX, p. 5259-5283.
Kosteski, L.E., Iturrioz, I., Batista, R.G., Cisilino, A.P. (2011). The truss-like discrete element method in fracture and damage mechanics. Engineering Computations 28(6), 765-787. Kosteski, L.E., Barrios, D.R., Iturrioz, I. (2012). Crack propagation in elastic solids using the
truss-like discrete element method. Int J Fract., 174, 139-161.
Kosteski, L.E., Riera, J.D., Iturrioz, I., Singh, R.K., Kant, T. (2014). Analysis of reinforced concrete plates subjected to impact employing the truss-like discrete element method. Fatigue Fract Engng Mater Struct. doi: 10.1111/ffe.12227.
Kosteski, L.E., Iturrioz, I., Cisilino, A.P., D'ambra, R.B., Pettarin, V., Fasce, L., Frontini, P. (2015). A lattice discrete element method to model the falling-weight impact test of
Kupfer, H.B. and Gerstle, K.H. (1973). Behaviour od Concrete Under Biaxial Stresses. Journal of the Eng. Mech. Div. ASCE. 99 (4): 853-866.
Li, S. and Liu, W.K. (2002). Meshfree and particle methods and their applications. Applied Mechanics Reviews, 55(1), 1-34.
Liu, G.B. and Liu, M.B. (2007). Smoothed Particle Hydrodynamics: A Meshfree Particle Methods. Singapure: World Scientific Publishing.
Lu, Y.B. and Li, Q.M. (2011). About the dynamic uniaxial tensile strength of concrete-like materials. International Journal of Impact Engineering, 38(4), 171-180.
Lu, Y., Chen, X., Teng, X., Zhang, S. (2014). Dynamic compressive behavior of recycled aggregate concrete based on split Hopkinson pressure bar tests. Latin American Journal of Solids and Structures, 11(1), 131-141.
Malvar, L.J. and Crawford, J.E. (1998). Dynamic increase factors for concrete. In: Proceedings of the 28th Department of Defense Explosives Safety Board Seminar. Orlando, FL, USA .
Mastilovic, S. (2011). Further remarks on stochastic damage evolution of brittle solids under dynamic tensile loading. International Journal of Damage Mechanics, 20(6), 900-921. Miguel, L.F.F., Fadel M.L.F., Riera J.D., Kaminski Jr. J., Menezes R.C.R.. (2009) Model
Uncertainty in the Assessment of EPS Wind Loads in Transmission Line Design. In: Zacarias M. C. Pravia; Ignacio Iturrioz; Letícia F. F. Miguel; Leandro F. F. Miguel; Ruy C. R. Menezes. (Org.). Proceedings of the International Seminar on Modeling and Identification of Structures Subjected to Dynamic Excitation. Emphasis on Transmission Lines. 1ed.Passo Fundo: UPF Editora, 2009, v. 1, p. 151-173.
Miguel, L.F.F., Iturrioz, I., Riera, J.D. (2010). Size effects and mesh independence in dynamic fracture analysis of brittle materials.Computer Modeling in Engineering & Sciences(CMES), 56(1), 1-16.
Moes, N. and Belytschko, T. (2002). Extended finite element method for cohesive crack growth. Engineering Fracture Mechanics 69, 813-833.
Nayfeh, A.H. and Hefzy, M.S. (1978). Continuum modeling of three-dimensional truss-like space structures. AIAA Journal, 16-8, 779–787.
Ožbolt, J., Sharma, A., İrhan, B., Sola, E. (2014). Tensile behavior of concrete under high loading rates. International Journal of Impact Engineering, 69, 55-68.
Riera, J.D. (1984) Local effects in impact problems in concrete structures. In: proceedings, Conf. on Structural Analysis and Design of Nuclear Power Plants, UFRGS, 1984. Porto Alegre, Rs, Brasil. 0-0. 1984.
Riera, J.D., Miguel, L.F.F., Iturrioz, I. (2011). Strength of Brittle Materials under High Strain Rates in DEM Simulations. CMES: Computer Modeling in Engineering & Sciences, 82(2), 113-136.
Riera, J.D., Miguel, L.F.F., Iturrioz, I. (2014). Assessment of Brazilian tensile test by means of the truss-like Discrete Element Method (DEM) with imperfect mesh. Engineering Structures, 81, 10-21.
Rinaldi, A. (2009). Rational damage model of 2d disordered brittle lattices under uniaxial loadings. International Journal of Damage Mechanics, 18(3), 233-257.
Rinaldi, A. (2011). Advances In Statistical Damage Mechanics: New Modelling Strategies, In: Damage Mechanics and Micromechanics of Localized Fracture Phenomena in Inelastic Solids, Voyiadjis G. (Ed.), CISM Course Series, Springer.
Rinaldi, A. and Lai, Y.C. (2007). Statistical damage theory of 2D lattices: Energetics and physical foundations of damage parameter. International Journal of Plasticity, 23(10-11), 1796-1825.
Schlangen, E. and van Mier, J.G.M. (1995). Crack propagation in sandstone: Combined experimental and numerical approach. Rock Mechanics and Rock Engineering, 28, 93-110.
Silling, S.A. and Lehoucq, R.B. (2010). Peridynamic theory of solid mechanics. Advances in Applied Mechanics, 44, 73-168.
van Vliet, M.R.A. and van Mier, J.G.M. (2000). Size effects of concrete and sandstone, Heron, v. 45, No.2, p. 91-108, 2000.
Weerheijm, J. and Van Doormaal, J.C.A.M. (2007). Tensile failure of concrete at high loading rates: new test data on strength and fracture energy from instrumented spalling tests. International Journal of Impact Engineering, 34(3), 609-626.
Wu, H., Zhang, Q., Huang, F., Jin, Q. (2005). Experimental and numerical investigation on the dynamic tensile strength of concrete. International Journal of Impact Engineering, 32(1-4), 605-617.
Xu, X.P. and Needleman, A. (1994). Numerical simulations of fast crack growth in brittle solids. Journal of the Mechanics and Physics of Solids 42: 1397-1434.

![Table 2 Simulation data for concrete Properties Concrete E [GPa] 29.43 ρ [Kg/m³] 2266.7 ν 0.25 G f [N/m] 130 CV(G f ) [%] 50 ε p 2.059E-4 L [m] 0.0075 lcx = lcy = lcz [m] 0.03 Dt [s] 4.47E-7](https://thumb-eu.123doks.com/thumbv2/123dok_br/17521627.812787/10.893.237.660.514.850/table-simulation-data-for-concrete-properties-concrete-gpa.webp)


![Table 3 Maximum stress and coefficient of variation. Percent of ε & maximum [%] CP I CP II CP III CP IV σmax,average [MPa] CV[%] σmax,average [MPa] CV[%] σmax,average [MPa] CV[%] σmax,average [MPa] CV [%] 0,1 5,86 13,19 6,34 4,06 5,67](https://thumb-eu.123doks.com/thumbv2/123dok_br/17521627.812787/13.893.101.797.137.463/maximum-coefficient-variation-percent-maximum-average-average-average.webp)

