Determination of the reinforced concrete slabs ultimate load
using finite element method and mathematical programming
Abstract
In the present paper, the ultimate load of the reinforced con-crete slabs [16] is determined using the finite element method and mathematical programming. The acting efforts and dis-placements in the slab are obtained by a perfect elasto-plastic analysis developed by finite element method. In the perfect elasto-plastic analysis the Newton-Raphson method [20] is used to solve the equilibrium equations at the global level of the structure. The relations of the plasticity theory [18] are resolved at local level. The return mapping problem in the perfect elasto-plastic analysis is formulated as a problem of mathematical programming [12]. The Feasible Arch Interior Points Algorithm proposed by Herskovits [8] is used as a re-turn mapping algorithm in the perfect elasto-plastic analysis. The proposed algorithm uses Newton’s method for solving nonlinear equations obtained from the Karush-Kuhn-Tucker conditions [11] of the mathematical programming problem. At the end of this paper, it is analyzed six reinforced con-crete slabs and the results are compared with available ones in literature.
Keywords
optimization, Finite Element Method, plates theory, rein-forced concrete.
A.M. Mont’Alvernea,∗
,
E.P. Deusb, S.C. Oliveira Juniorc and A.S. Mourad
aCenter of Technology, Federal University of
Cear´a, Pici Campus, 60455-900, Fortaleza – Brazil
bDeptt. of Metallurgical and Materials Engg.,
Center of Technology, Federal University of Cear´a, Fortaleza – Brazil
cPost-Doctoral Researcher of ARMTEC
(CNPq/PNPD), Fortaleza, Cear´a – Brazil
dDeptt. of Hydraulic and Environmental
Engg., Center of Technology, Federal University of Cear´a – Brazil
Received 26 May 2011; In revised form 15 Sep 2011
∗
Author email: [email protected]
1 INTRODUCTION
Reinforced concrete slabs [16] are among the most common structural elements. Despite of the large number of slabs designed and built, the details of their elastic and plastic behavior are not fully appreciated or properly taken into account. Although almost all the technical standards approach to slab design is basically one of using elastic moment distributions, it is also possible to design slabs using plastic analyses (perfect elasto-plastic analyses) to provide the required moments. In this paper, the ultimate load of the reinforced concrete slabs and the ultimate moment distributions are determined using the finite element method [20] and mathematical programming [12].
NOTATIONS
C Elastic stiffness modules matrix;
dεεε Strain increment tensor;
dλ Consistency parameter or Lagrange multiplier;
dσ Stress increment tensor;
E Young modulus;
f Yield surface or strength criterion;
f Objective function;
g Equality constraint;
h Inequality constraint or slab height;
L Lagrangian function;
l Span;
M+ u,M
−
u Positive and negative ultimate moment of resistance;
Pu Ultimate concentrated load;
qu Ultimate Uniformly distributed load;
m Acting moment; u Displacement tensor;
εεε Strain tensor;
λ Lagrange multiplier;
µ Lagrange multiplier;
ν Poisson ratio; σ Stress tensor; σe Trial stress tensor;
slab, the strength criterion is defined for each midsurface point in terms of bending moments and torsion moment. With the strength criterion at each point and the elastic properties of the material is possible to perform a model analysis to determine the acting efforts from the applied load considering the elasto-plastic behavior of the material. The strength criterion proposed by Johansen [10] is used in this paper.
In the present paper, the acting efforts and displacements in the slab are obtained by a per-fect elasto-plastic analysis developed by finite element method. The perper-fect elasto-plastic anal-ysis of the slabs, described by their midsurface and discretized by the finite element method, is performed under the hypothesis of small displacements with consistent formulation in dis-placements. In the perfect elasto-plastic analysis the Newton-Raphson method [20] is used to solve the equilibrium equations at the global level of the structure. The relations of the plasticity theory [18] are resolved at local level, that is, for each Gauss point of the discretized structure. The return mapping problem in the perfect elasto-plastic analysis is formulated as a problem of mathematical programming [12]. The Feasible Arch Interior Points Algorithm proposed by Herskovits [8] is used as a return mapping algorithm in the perfect elasto-plastic analysis.
program-ming problems [12] with nonlinear objective function and nonlinear constraints quickly and efficiently.
The Feasible Arc Interior Point Algorithm is a new technique for nonlinear inequality and equality constrained optimization and was first developed by Herskovits [8].
This algorithm requires an initial point at the interior of the inequality constraints, and generates a sequence of interior points. When the problem has only inequality constraints, the objective function is reduced at each iteration. An auxiliary potential function is employed when there are also equality constraints.
The fact of giving interior points, even when the constraints are nonlinear, makes of pro-posed algorithm an efficient tool for engineering design optimization, where functions evalua-tion is in general very expensive.
Since any intermediate design can be employed, the iterations can be stopped when the objective reduction per iteration becomes small enough.
At each point, the Feasible Arc Interior Point Algorithm defines a “feasible descent arc”. Then, it finds on the arc a new interior point with a lower objective.
The proposed algorithm uses Newton’s method for solving nonlinear equations obtained from the Karush-Kuhn-Tucker conditions [11] of the mathematical programming problem.
The proposed algorithm requires at each iteration a constrained line search looking for a step-length corresponding to a feasible point with a lower objective. Herein we have imple-mented the Armijo’s line search technique [8].
The implementation of the Feasible Arc Interior Point Algorithm was developed using the programming language C++ [19] that uses the technique of object-oriented programming. This technique allows quickly and located implementation of the proposed methods and also facilitates the code expansion.
In this paper will be presented: the strength criterion proposed by Johansen, the elasto-plastic analysis of plates using finite element method and mathematical programming, the Feasible Arc Interior Point Algorithm and six examples of reinforced concrete slabs whose results are compared with results available in literature.
2 STRENGTH CRITERION
The strength criteria are characterized by a yield surface, defined as the geometric locus of the independent combinations of the stress tensor components or of the stress resultants that provoke the material plastification. Mathematically the yield surface can be defined by the Equation (1) presented as follows:
f(σ)=0 (1)
2.1 Strength criterion of Johansen
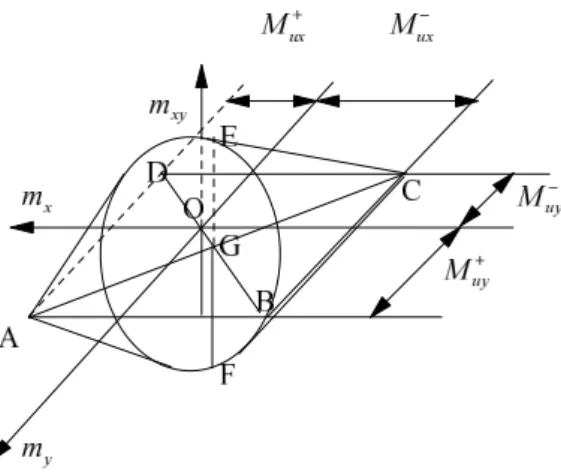
According to Johansen, the yield condition is based on the following physical criterion proposed by Massonet [14]: “The yield happens when the applied moment of flexion in a cross-section of inclinationθ in relation to thex axis reaches a certain value that just depends on the angle
θand on the resistant moments in the reinforcement directions.” The basic parameters of the Johansen criterion are presented in the Figure 1.
Figure 1 Basic parameters of the Johansen criterion.
The yield surface proposed by Johansen is frequently used to determine the ultimate resis-tance in the design of reinforced concrete slabs [10, 14, 16]. The mathematical equations that define this surface are presented as follows.
f1(σ)=m 2
xy−(M +
ux−mx)×(M +
uy−my)=0 (2)
f2(σ)=m 2
xy−(M −
ux+mx)×(M −
uy+my)=0 (3)
In Equations (2) and (3), M+ ux, M
+ uy, M
−
ux and M −
uy are respectively the positive and negative ultimate moments of resistance. These ultimate moments of resistance are moments per unit of length in the x and y directions.
The Equation (2) is associated to the positive yield line [16] and Equation (3) is associated to the negative yield line [16]. The Equations (2) and (3) represent two conical surfaces that combined define the yield surface of Johansen. The surface of Johansen is presented in the Figure 2.
3 ELASTO-PLASTIC ANALYSIS USING THE FINITE ELEMENT METHOD AND
MATH-EMATICAL PROGRAMMING
The equations presented in this item are valid for materials with perfect elasto-plastic behavior. In the determination of the efforts in a structure through a perfect elasto-plastic analysis is necessary to consider the plastic behavior of the material depending on the applied loading history. In this work the constitutive model applied to the reinforced concrete is perfect elasto-plastic with associative flow rule. The condition that limits the stresses space [3] is presented as follows:
Figure 2 Yield surface of Johansen.
The Equation (4) represents a convex surface in the generalized stresses space. The interior region of this surface is formed by points belonging to the elastic regime. The plasticity theory allows only the existence of points in the interior (f < 0) or in the frontier of the yield surface (f = 0). Points placed out of this surface are inadmissible.
The perfect elasto-plasticity equations that govern the plastic behavior of the material after the yield are presented as follows:
dεεε=dεεεe+dεεεp (5)
dσ=Cdεεεe=C(dεεε−dεεεp) (6)
dεεεp=dλ ∂
∂σf(σ) (7)
dλ ≥0 (8)
dλ f(σ)=0 (9)
dλ df(σ)=0 (10)
Analyzing the Equations (9) and (10) we verified the existence of three possible loading conditions that are indicated in the Table 1.
Table 1 Loading conditions in the perfect plasticity. f < 0 dλ=0 Elastic Loading f = 0 df <0 λ=0 Elastic Unloading f = 0 df =0 λ>0 Plastic Loading
In this work the elasto-plastic consistent tangent stiffness matrix is used [17, 18] for the update of the elasto-plastic stiffness matrix with the goal of improving the convergence of the Newton-Raphson method [20].
3.1 Used algorithms in nonlinear analyses with discretization by the Finite Element Method
The return mapping algorithms used in nonlinear physical analyses generally intend to solve the following problem: given a field of displacements, strains and stresses (u0, εεε0and σ0) of a
structure, determine the new field of displacements, strains and stresses (u, εand σ) due to a load increment. In this solution the compatibility and equilibrium relations defined in the solid mechanics and the constitutive relations defined in the plasticity theory are used.
The formulation generally adopted is to solve the equilibrium equations, deduced starting from the principle of virtual work and discretized by the finite element method [1, 4], at global level of the structure. The relations of the plasticity theory are solved at local level, that is, for each Gauss point of the discretized structure.
The global equilibrium is obtained through algorithms that solve nonlinear equations sys-tems and that determine the load-displacement curves [20]. Among other algorithms, there are the Newton-Raphson algorithm, the displacement control and the arch length. In this work the algorithm of Newton-Raphson is used.
The return mapping algorithm intends to solve the following problem: given an initial state of allowable stress σ0, determine the new stress state σ due to a strain increment dε,
respecting the equations of the plasticity theory. The integration of the plasticity equations can be viewed as the solution of an initial value problem with constraints. This problem can be transformed in a mathematical programming problem with constraints through the use of an integration method of differential equations like implicit backward Euler [18].
The trial of a stress state σe considering the behavior of the material in elastic regime, obtained starting from an allowable stress stateσ0 after a strain incrementdεεε, is determined
through the equation presented as follows:
σe=σ0+Cdεεε (11)
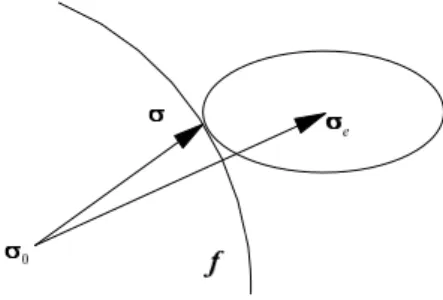
The trial elastic stress σe is the solution stress state σ. If f(σe) > 0, the regime is perfect elasto-plastic. The solution stress state is on the yield surface, that is, f(σ) = 0 and it can be determined solving the mathematical programming problem presented as follows:
min s(σ)= 1
2[(σ−σe)
T C−1
(σ−σe)] subject to f(σ)≤0
(12)
WhereCis the elastic stiffness modules matrix andf(σ)is the adopted strength criterion. The function s(σ) represents an ellipsoid in the stresses space. The problem consists of determining the smallest ellipsoid with center in σe that touches f in σ. The graphic representation of this problem is presented in the Figure 3.
Figure 3 Graphic representation of the return mapping algorithm.
The Lagrangian function [21] of the mathematical programming problem presented by the Equation (12) is presented as follows:
L(σ, dλ)=1
2[ (σ−σe) TC−1
(σ−σe)]+dλTf (13) The necessary 1st order conditions for the existence of a local minimum or Karush-Kuhn-Tucker conditions [11] are determined starting from the Equation (13) and are described as follows:
C−1
(σ−σe)+dλT
∂f
∂σ =0 (14)
f(σ)≤0 (15)
dλ≥0 (16)
dλTf(σ)=0 (17)
Where f(σ)and ∂∂σf are appraised in the solution stress state σ. This point minimizes the mathematical programming problem indicated by the Equation (12).
Substituting the Equations (6) and (11) in the Equation (14) and after some algebraic manipulations, it is obtained the equation presented as follows:
dεεεp=dλT
∂f
An important observation to make is that the Karush-Kuhn-Tucker [11] equations of this mathematical programming problem correspond exactly to the perfect elasto-plasticity equa-tions with associative flow rule developed previously. The Equation (16) corresponds to the non-negativity condition of the consistency parameter represented by the Equation (8). The Equation (18) corresponds to the associative flow rule represented by the Equation (7). The Equations (15) and (17) correspond respectively to the strength criterion condition represented by the Equation (4) and to the complementarity condition represented by the Equation (9).
The solution of this mathematical programming problem [12] is the stress state σ and the Lagrange multipliers dλ. Therefore, starting from a viable stress state σ0, it is obtained
the stress solution state σ and the Lagrange multipliersdλafter a strain increment dεεε. The solution of this problem satisfies the Karush-Kuhn-Tucker conditions and consequently the perfect elasto-plasticity equations. The plastic strain is also determined since that the Lagrange multipliers correspond to the consistency parameters.
In this work the strength criterion of Johansen is used. Using this criterion, the mathemat-ical programming problem results in a nonlinear programming problem with constraints. Both the objective function and the constraints of this problem are nonlinear. For the solution of the mathematical programming problem represented by the Equation (12), the Feasible Arch Interior Points Algorithm is used [8]. This algorithm uses the Karush-Kuhn-Tucker equations of the mathematical programming problem indicated by the Equation (12). The advantage of this algorithm in relation to the others is its efficiency [8] for solving directly the Karush-Kuhn-Tucker equations, thereby solving a system of nonlinear equations. In addition, the unbounded number of constraints can be used in this problem without the need of significant change in the computational code, facilitating the treatment of yield multi-surfaces.
4 FEASIBLE ARCH INTERIOR POINTS ALGORITHM
Feasible Arch Interior Points Algorithm [8] is an iterative algorithm to solve the nonlinear programming problem [12]
⎧⎪⎪⎪⎪ ⎨⎪⎪⎪ ⎪⎩
mim
x f(x)
s.t. g(x)≤0
h(x)=0
(19)
Where x ∈ Rn and f ∈ R, g ∈ Rm, h ∈ Rp. Ω = {x ∈ Rn/g(x) = 0}. The following assumptions on the problem are required:
1. The functions f(x),g(x) andh(x) are continuous in Ω, as well as their first derivatives.
2. For allx∈Ω the vectors ∇gi(x), fori = 1,2,...,m such that gi(x)=0 and ∇hi(x), fori =
1,2,...,p are linearly independent.
We denote ∇g(x)∈Rnxm and ∇h(x)∈Rnxp the matrix of derivatives of g and h
respec-tively and call λ∈ Rm and µ∈ Rp the corresponding vectors of Lagrange multipliers. G(x)
denotes a diagonal matrix such that Gii(x) =gi(x). The Lagrangian is presented as follows:
L(x, λ, µ)=f(x)+λtg(x)+µth(x) (20)
The Hessian of the Lagrangian is presented as follows:
Lh(x, λ, µ)= ∇2f(x)+ m
∑
i=1
λi∇
2
gi(x)+ p
∑
i=1
µi∇
2
hi(x) (21)
Let us consider Karush–Kuhn–Tucker, (KKT), first order optimality conditions:
∇f(x)+ ∇g(x)λ+ ∇h(x)µ=0 (22)
G(x)λ=0 (23)
h(x)=0 (24)
λ≥0 (25)
g(x)≤0 (26)
A point x∗
is a stationary point if there existsλ∗
andµ∗
such that the Equations (22), (23) and (24) are true and is a KKT Point if KKT conditions (Equations (22), (23), (24), (25) and (26)) hold.
KKT conditions constitute a nonlinear system of equations and inequations on the un-knowns (x,λ,µ). It can be solved by computing the set of solutions of the nonlinear system of Equations (22), (23) and (24) and then, looking for those solutions such that Equations (25) and (26) are true. However, this procedure is useless in practice.
The proposed algorithm makes Newton-like iterations to solve the nonlinear Equations (22), (23) and (24) in the primal and the dual variables. With the object of ensuring convergence to KKT points, the system is solved in such a way as to have the inequalities Equations (25) and (26) satisfied at each iteration.
Let S = Lh(x,λ,µ). A Newton iteration for the solution of the Equations (22), (23) and (24) is defined by the following linear system:
⎡⎢ ⎢⎢ ⎢⎢ ⎣
S ∇g(x) ∇h(x)
Λ∇gT(x) G(x) 0 ∇hT(x) 0 0
⎤⎥ ⎥⎥ ⎥⎥ ⎦ ⎡⎢ ⎢⎢ ⎢⎢ ⎣
x0−x
λ0−λ
µ0−µ ⎤⎥ ⎥⎥ ⎥⎥ ⎦ = ⎡⎢ ⎢⎢ ⎢⎢ ⎣
∇f(x)+ ∇g(x)λ+ ∇h(x)µ G(x)λ
h(x)
⎤⎥ ⎥⎥ ⎥⎥ ⎦
(27)
trust region algorithms for nonlinear optimization [12, 15]. The present method includes a line search procedure, in the space of the primal variables x only, that enforces the new iterate to be closer from the solution.
Let d0 ∈Rn such that d0 = x0 –x. From Equation (27), we have
⎧⎪⎪⎪ ⎨⎪⎪⎪ ⎩
Sd0+ ∇g(x)λ0+ ∇h(x)µ0= −∇f(x)
Λ∇gT(x)d0+G(x)λ0=0
∇hT(x)d0= −h(x)
(28)
Which is independent of the current value of µ. Then Equation (28) gives a direction in the space of primal variablesx and new estimates of the Lagrange multipliers.
Let the potential function be
ϕ(c, x)=f(x)+ p
∑
i=1
ci∣hi(x)∣, (29)
Where, at the iteration k,cki is such that
sg[hi(xk)] (ci+µk0i)<0; i=1,2, ..., p. (30)
Where sg(.) = (.)/|(.)|. dk
0 is a descent direction ofϕ(ck,x) [5, 7].
However, d0 is not useful as a search direction since it is not necessarily feasible. This is due to the fact that as any constraint goes to zero,d0goes to a direction tangent to the feasible set [7].
To obtain a feasible direction, a negative vector -ρλis added in the right hand side of the Equation (28). A perturbed linear system ind and ¯λis then obtained:
⎧⎪⎪⎪ ⎨⎪⎪⎪ ⎩
Sd+ ∇g(x)λ¯+ ∇h(x)µ¯= −∇f(x)
Λ∇gt(x)d+G(x)¯λ= −ρλ
∇ht(x)d=0
(31)
Where ρ ∈ Ris positive. The new direction is d and ¯λand ¯µ are the new estimate of the Lagrange multipliers. We have now that d is a feasible direction, since ∇gt(x)d= −ρ<0 for the active constraints.
The addition of a negative number in the right hand side of the Equation (28) produces a deflection ond0, proportional to ρ, in the sense of the interior of the feasible region. To ensure that d is also a descent direction, we establish an upper bound on ρ in order to have
dt∇ϕ(c, x)≤αdt0∇ϕ(c, x) (32)
With α∈(0,1), that implies dt∇ϕ(c, x)<0. Thus,d is a descent direction of the potential function.
In general, the rate of descent of ϕ along d will be smaller than along d0. This is a price that we pay to get a feasible descent direction.
⎧⎪⎪⎪ ⎨⎪⎪⎪ ⎩
Sd1+ ∇g(x)λ1+ ∇h(x)µ1=0
Λ∇gt(x)d1+G(x)λ1= −λ
∇ht(x)d
1=0
(33)
It follows from Equations (28), (31) and (33) that d = d0 + ρd1. Then, we have that Equation (32) is true for anyρ >0, ifdt1∇ϕ(c, x)<0. Otherwise, we take
ρ<(α−1)d t
0∇ϕ(c, x)
dt
1∇ϕ(c, x)
(34)
And Equation (32) holds.
However, when there are highly nonlinear constraints, the length of the feasible segment supported by the feasible descent search directiond can be not enough to accept a step equal to one.
The basic idea to avoid this problem consists on making the line search along a second order arc, tangent to the feasible descent direction d and with a curvature “close” to the curvature of the feasible set boundary.
The arc at x is defined by the following expression:
x(t)∶=x+td+t2d˜ (35)
Where ˜dis obtained by solving:
⎧⎪⎪⎪⎪ ⎨⎪⎪⎪ ⎪⎩
Sd˜+ ∇g(x)λ˜+ ∇h(x)µ˜=0 Λ∇gt(x)d˜+G(x)λ˜= −Λ ˜wI
∇ht(x)d˜= −w˜E
(36)
This linear system is similar to the system presented in Equation (33) being ˜wIi and ˜wiE
computed as follows:
˜
wiI=gi(x+d)−gi(x)− ∇git(x)d; i=1, ..., m ˜
wiE=hi(x+d)−hi(x)− ∇hti(x)d; i=1, ..., p
(37)
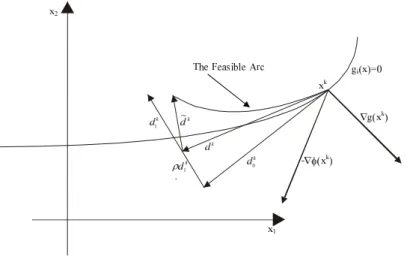
The arc employed in the proposed algorithm is represented in Figure 4 for the case when the constraint gi(x) = 0 is active at the iterate xk. Since dk0 and dk are descent directions of
the potential functionϕ(x) atxk, their angle with -∇ϕ(xk) is acute.
5 ARMIJO’S LINE SEARCH
The Feasible Arc Interior Point Algorithm requires at each iteration a constrained line search looking for a step-length corresponding to a feasible point with a lower potential. The first idea consists on solving the following optimization problem on t:
⎧⎪⎪ ⎨⎪⎪ ⎩
mim
t ϕ(x
k+tdk+t2˜
dk) s.t. g(xk+tdk+t2˜
Figure 4 The feasible arc.
Instead of making an exact minimization on t, it is more efficient to employ inexact line search techniques [6, 9, 12, 15]. In this work the Armijo’s line search technique was imple-mented.
Armijo’s line search defines a procedure to find a step-length ensuring a reasonable decrease of the potential function. In our case, we add the condition of feasibility of the inequality constrains. Armijo’s line search is stated as follows:
Define the step-length t as the first number of the sequence {1,ν, ν2 , ν3
,. . .}, satisfying
ϕ(x+td+t2d˜)≤ϕ(x)+tη1∇ϕt(x)d (39)
And
g(x+td+t2d˜)≤0 (40)
Where η1∈(0,1) and ν∈(0,1).
6 STATEMENT OF THE FEASIBLE ARC INTERIOR POINT ALGORITHM
The pseudocode of the Feasible Arc Interior Point Algorithm is presented on the next page. The present algorithm is very general in the sense that it converges to a Karush–Kuhn– Tucker point of the problem for any initial interior point. We work with the following updating rule forλ.
Set, for i=1,...,m.
λi∶=max[λ0;ε∥d0∥ 2
2] (49)
Parameters. α∈(0,1)andφ>0.
Data. Initial values forx∈Rn such that g(x)<0,λ∈Rm,λ>0,S∈Rnxm symmetric and positive definite andc∈Rp,c≥0.
Step 1. Computation of a feasible descent direction. (i) Solve the linear systems:
⎧⎪⎪⎪ ⎨⎪⎪⎪ ⎩
Sd0+ ∇g(x)λ0+ ∇h(x)µ0= −∇f(x), Λ∇gT(x)d0+G(x)λ0=0,
∇hT(x)d0= −h(x)
(41)
And
⎧⎪⎪⎪ ⎨⎪⎪⎪ ⎩
Sd1+ ∇g(x)λ1+ ∇h(x)µ1=0, Λ∇gt(x)d1+G(x)λ1= −λ, ∇ht(x)d1=0,
(42)
Let the potential function be
ϕc(x)=f(x)+ p ∑ i=1
ci∣hi(x)∣, (43)
(ii) If ci<-1.2µ0(i), then set ci=-1.2µ0(i); i=1,...,p
(iii) Ifdt1∇ϕc(x)>0, set
ρ=min[φ∥d0∥ 2
2;(α−1)d t
0∇ϕc(x) /dt1∇ϕc(x)] (44)
Otherwise, set
ρ=φ∥d0∥ 2
2 (45)
(iv) Compute the feasible descent direction: d=d0+ρd1
Step 2. Computation of a “restoring direction”d˜ Compute:
˜
wIi =gi(x+d)−gi(x)− ∇gti(x)d; i=1, ..., m ˜
wEi =hi(x+d)−hi(x)− ∇ht
i(x)d; i=1, ..., p
(46)
Solve:
⎧⎪⎪⎪ ⎨⎪⎪⎪ ⎩
Sd˜+ ∇g(x)λ˜+ ∇h(x)µ˜=0,
Λ∇gt(x)d˜+G(x)λ˜= −Λ ˜wI,
∇ht(x)d˜= −w˜E,
(47)
Step 3. Arc search – Employ a line search procedure to get a step-length t based on the potential function ϕc(x+td+t
2˜
d). In this work the Armijo’s line search technique was im-plemented.
Step 4. Updates (i) Set the new point:
x∶=x+td+t2d˜ (48)
(ii) Define new values forλ>0 and S symmetric and positive definite.
The parameters ϵ, ¯g and λI are taken positive.
7 EXAMPLE – DETERMINATION OF THE REINFORCED CONCRETE SLABS
ULTI-MATE LOAD
In the determination of the slabs ultimate load using the finite element method and mathe-matical programming we used the following values.
• Slab height: h=0.1 m;
• Young modulus: E=23800 MPa;
• Poisson ratio: ν=0.2.
In this paper, it was used the strength criterion of Johansen and also the finite element soft-ware FEMOOP [13]. The Feasible Arc Interior Point Algorithm was implemented in FEMOOP using the programming language C++ [19] that uses the technique of object-oriented program-ming. This technique allows quickly and located implementation of the proposed methods and also facilitates the code expansion.
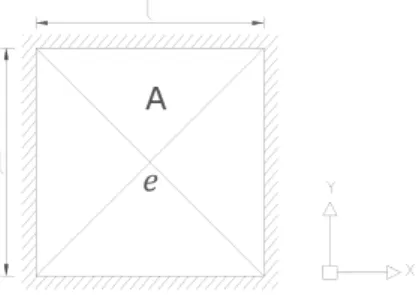
7.1 Square simply supported slab
In this example the ultimate load of the square simply supported slab on all edges with uniformly distributed load is determined. The slab is solid concrete. The span of the slab is
l=5m. Figure 5 presents the reinforced concrete slab.
Figure 5 Reinforced concrete slab.
The slab is isotropically reinforced with ultimate positive moments of resistance per unit width presented as follows:
M+ ux=M
+ uy =M
+
u =25KN m/m (50)
According to the yield line theory the ultimate load [16] of the slab without considering the corner effects is:
qu=
24×M+ u
l2 =24.0
KN/
Considering the corner effects and assuming that the yield line pattern is composed of corners levers in the form of circular fans the ultimate load [16] is:
qu=
21.7×M+ u
l2 =21.7
KN/
m2 (circular f ans) (52)
Considering the corner effects and assuming that the yield line pattern is composed of corners levers in the form of hyperbolic fans the ultimate load [16] is:
qu=
21.4×M+ u
l2 =21.4
KN/
m2 (hyperbolic f ans) (53)
In the perfect elasto-plastic analysis [18], it was used isoparametric elements with eight nodes, Q8 [4]. The used mesh was a bilinear-quadrilateral mesh with 20 elements inx direction and 20 elements iny direction. The integration order used was 2x2.
Using the perfect elasto-plastic analysis, it is obtained the ultimate load presented as follows:
qu=24.0KN/m2 (perf ect elasto−plastic analysis) (54)
Figure 6 presents the distribution of the principal moments (M2) in the ultimate configu-ration.
Figure 6 Distribution of the principal moments.
7.2 Rectangular simply supported slab
In this example the ultimate load of the rectangular simply supported slab on all edges with uniformly distributed load is determined. The slab is solid concrete. The spans of the slab in the direction x is lx=7m and in the direction y isly=5m. Figure 7 presents the reinforced concrete slab.
The slab is isotropically reinforced with ultimate positive moments of resistance per unit width presented as follows:
M+ ux=M
+
Figure 7 Reinforced concrete slab.
According to the yield line theory the ultimate load [16] of the slab is:
qu=
24×M+ uy
l2
y{[3+( M+
ux
M+
uy) (
ly
lx)
2 ]
1 2
−(ly lx) (
M+
ux
M+
uy)
1 2
}
2 =17.858KN/m2 (56)
In the perfect elasto-plastic analysis [18], it was used isoparametric elements with eight nodes, Q8 [4]. The used mesh was a bilinear-quadrilateral mesh with 28 elements inx direction and 20 elements iny direction. The integration order used was 2×2.
Using the perfect elasto-plastic analysis, it is obtained the ultimate load presented as follows:
qu=17.858KN/m2 (perf ect elasto−plastic analysis) (57)
Figure 8 presents the distribution of the principal moments (M2) in the ultimate configu-ration.
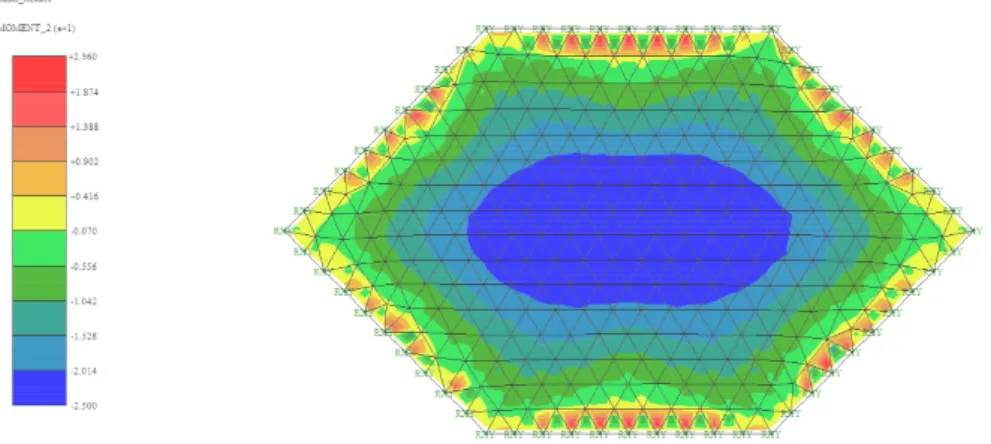
7.3 Hexagonal slab fixed around the edges
In this example the ultimate load of the hexagonal slab fixed around the edges with uniformly distributed load is determined. The slab is solid concrete. The length of each side is l=5m. The inclined sides have an inclination of the 45○
with respect to the axisx. Figure 9 presents the reinforced concrete slab.
The slab is isotropically reinforced in the top and in the bottom with ultimate positive and negative moments of resistance per unit width presented as follows:
M+ u =M
−
u =25KN m/m (58)
According to the yield line theory the ultimate load [16] of the slab is:
qu=
8×(M+ u +M
− u)
l2 =16.0
KN/
Figure 8 Distribution of the principal moments.
Figure 9 Reinforced concrete slab.
In the perfect elasto-plastic analysis [18], it was used DKT elements [4]. The used mesh was a triangular mesh with 554 elements. The integration order used was 2×2.
Using the perfect elasto-plastic analysis, it is obtained the ultimate load presented as follows:
qu=16.0KN/m2 (perf ect elasto−plastic analysis) (60)
Figure 10 presents the distribution of the principals moments (M2) in the ultimate config-uration.
7.4 Rectangular slab bridge
Figure 10 Distribution of the principal moments.
directionx islx=5m and in the directionyisly=7m. Figure 11 presents the reinforced concrete slab.
Figure 11 Reinforced concrete slab.
The slab is isotropically reinforced in the top and in the bottom with ultimate positive and negative moments of resistance per unit width presented as follows:
M+ u =M
−
u =25KN m/m (61)
There are a number of possible yield line patterns, the critical pattern depending on the aspect ratio of the slab and the position of the load on the transverse centerline. The coefficient
λ defines the position of the load on the transverse centerline. In this example is adopted
λ=0.25. Figure 12 presents all possible yield line patterns.
According to the yield line theory the ultimate load [16] of the slab for mode 1 is:
Pu= 4M+
uly
lx
=140.0KN (62)
According to the yield line theory the ultimate load [16] of the slab for mode 2a is:
Pu=8
√ (M+
u +M − u)M
+
According to the yield line theory the ultimate load [16] of the slab for mode 2b is:
Pu=4M + u
√
M− u
M+ u
+4(M+ u+M
−
u)arccot(
√
M− u
M+ u)
=257.08KN (64)
According to the yield line theory the ultimate load [16] of the slab for mode 3a is:
Pu=4
√ (M+
u+Mu−)Mu+ + 4M+
uλly
lx
=176.421KN (65)
Figure 12 Yield line patterns.
According to the yield line theory the ultimate load [16] of the slab for mode 3b is:
Pu= 4M+
uλly
lx
+2M+ u
√
M− u
M+ u
+2(M+ u+M
−
u)arccot(
√
M− u
M+ u
)=163.54KN (66)
and 28 elements iny direction. The integration order used was 2×2.
Using the perfect elasto-plastic analysis, it is obtained the ultimate load presented as follows:
Pu=140.0KN (perf ect elasto− plastic analysis) (67)
Figure 13 presents the distribution of the principals moments (M2) in the ultimate config-uration.
Figure 13 Distribution of the principal moments.
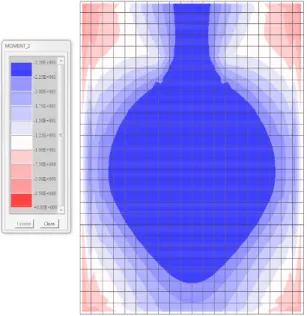
7.5 Rectangular slab with three edges supported and one edge free
In this example the ultimate load of the rectangular slab with three edges supported and one edge free with uniformly distributed load is determined. The slab is solid concrete. The spans of the slab in the directionx islx=5m and in the directiony isly=8m. Figure 14 presents the reinforced concrete slab.
The slab is isotropically reinforced in the top and in the bottom with ultimate positive and negative moments of resistance per unit width presented as follows:
M+ u =M
−
u =25KN m/m (68)
There are two possible yield line patterns. The governing alternative collapse mode is the one giving the lowest ultimate load. Figure 15 presents the two possible yield line patterns.
Figure 15 Yield line patterns.
According to the yield line theory the ultimate load [16] of the slab for mode 1 is:
qu= 6M+
u[1+(4l 1 lx)]
l2
y[3−(4ll1x)]
=24.881KN/m2 (69)
Where:
l1=lx(
√
4+3K2−2
K2 )
K2=2(lx
ly)
2 (70)
According to the yield line theory the ultimate load [16] of the slab for mode 2 is:
qu= 12M+
u
l2 1
Where:
l1=ly( √1
+3K3−1
K3 )
K3=4(
ly
lx)
2 (72)
In the perfect elasto-plastic analysis [18], it was used isoparametric elements with eight nodes, Q8 [4]. The used mesh was a bilinear-quadrilateral mesh with 20 elements inx direction and 32 elements iny direction. The integration order used was 2×2.
Using the perfect elasto-plastic analysis, it is obtained the ultimate load presented as follows:
qu=21.9KN/m2 (perf ect elasto− plastic analysis) (73)
Figure 16 presents the distribution of the principals moments (M2) in the ultimate config-uration.
Figure 16 Distribution of the principal moments.
7.6 Square slab with openings
In this example the ultimate load of the square uniformly loaded slab with a central square opening is determined. The slab is fixed around the outside edges. The span of the slab is
l=5m. The size of the opening is defined by the value ofk. In this example we usek=0.2. The slab is solid concrete. Figure 17 presents the reinforced concrete slab.
The slab is isotropically reinforced with positive and negative ultimate moments of resis-tance per unit width presented as follows:
M+ u =M
−
Figure 17 Reinforced concrete slab.
According to the yield line theory the ultimate load [16] of the slab is:
qu= 24M+
u{1+( M−
u
M+
u) [
1 (1−k)]}
l2(
1−k) (1+2k) =48.214 KN/
m2 (75)
In the perfect elasto-plastic analysis [18], it was used isoparametric elements with eight nodes, Q8 [4]. The used mesh was a bilinear-quadrilateral mesh with 384 elements. The integration order used was 2×2.
Using the perfect elasto-plastic analysis, it is obtained the ultimate load presented as follows:
qu=46.0KN/m2 (perf ect elasto− plastic analysis) (76)
Figure 18 presents the distribution of the principals moments (M2) in the ultimate config-uration.
8 CONCLUSIONS
The values of ultimate loads of the examples presented above are presented in Table 2. This table shows the values using the perfect elasto-plastic analysis [18] and the yield line theory [16]. The percentage error between these two values is also presented.
Table 2 Ultimate loads.
Example Ultimate Load Error (%)
Perfect Elasto-Plastic Analysis Yield Line Theory
7.1 24.0 KN/m2
24.0 KN/m2
0.0 7.2 17.858 KN/m2
17.858 KN/m2
0.0
7.3 16.0 KN/m2
16.0 KN/m2
0.0
7.4 140.0 KN 140.0 KN 0.0
7.5 21.9 KN/m2
22.908 KN/m2
4.4
7.6 46.0 KN/m2
48.214 KN/m2
4.592
In all the examples presented in this paper the stress distribution in the ultimate configura-tion determined using the perfect elasto-plastic analysis is according to the collapse mechanism predicted by the yield line theory.
In example 7.1, the corner of the slab was held down and sufficient top steel was provided to avoid the appearance of the corner effects. The ultimate load found in the perfect elasto-plastic analysis and the ultimate load predicted by the yield line theory both have the same value.
In examples 7.2, 7.3 and 7.4, the ultimate load found in the perfect elasto-plastic analysis and the ultimate load predicted by the yield line theory both have the same value.
In example 7.5, the percentage error between the ultimate load found in the perfect elasto-plastic analysis and the ultimate load predicted by the yield line theory is 4.4. The value provided by perfect elasto-plastic analysis is in favor of safety.
In example 7.6, the percentage error between the ultimate load found in the perfect elasto-plastic analysis and the ultimate load predicted by the yield line theory is 4.592. The value provided by perfect elasto-plastic analysis is in favor of safety.
References
[1] K.J. Bathe. Finite Elements Procedures. Klaus-Jurgen Bathe, 2007.
[2] M.W. Braestrup and M.P. Nielsen. Plastic methods of analysis and design. In F. K. Kong et al., editors,Handbook of Structural Concrete. Pitman Publishing, 1983.
[3] W.F. Chen. Plasticity in Reinforced Concrete. J. Ross Publishing, 2007.
[4] R.D. Cook, D.S. Malkus, M.E. Plesha, and R.J. Witt. Concepts and Applications of Finite Element Analysis. John Wiley & Sons, 4th edition, 2001.
[5] J. Herskovits. A two-stage feasible directions algorithm for nonlinear constrained optimization, volume 36. Math. Program., 1986.
[6] J. Herskovits. A view on nonlinear optimization. In J. Herskovits, editor,Advances in Structural Optimization, pages 71–117, Dordrecht, Holland, 1995. Kluwer Academic Publishers.
[7] J. Herskovits. A feasible directions interior point technique for nonlinear optimization. JOTA, J. Optimiz. Theory Appl., 99(1):121–146, 1998.
[8] J. Herskovits, P. Mappa, E. Goulart, and C.M. Mota Soares. Mathematical programming models and algorithms for engineering design optimization. Computer Methods in Applied Mechanics and Engineering, 194(30-33):3244–3268, 2005.
[9] J.B. Hiriart-Urruty and C. Lemar´echal. Convex Analysis and Minimization Algorithms I and II. Springer-Verlag, Berlin, Germany, 2010.
[10] K.W. Johansen.Yield Line Theory. Cement and Concrete Association, 1962.
[11] H.W. Kuhn and A.W. Tucker. Nonlinear programming. Proc. 2o
Berkeley Symp. Math. Statistics and Probability, 481, 1950.
[12] D.G. Luenberger.Linear and Nonlinear Programming. Addison-Wesley Publishing Company, 2nd edition, 1984.
[13] L.F. Martha, I.F.M Menezes, E.N. Lages, E. Parente Jr., and R.L.S. Pitangueira. An OOP class organization for materially nonlinear finite element analysis. InProceedings of the XVII CILAMCE, pages 229–232, Venice, Italy, 1996.
[14] C.E. Massonet and M.A. Save. Plastic Analysis and Design of Plates Shells and Disks. North-Holland Publishing Company, 1972.
[15] J. Nocedal and S.J. Wright. Numerical Optimization. Springer Series in Operations Research. Springer, New York, 2nd edition, 2006.
[16] R. Park and W.L. Gamble. Reinforced Concrete Slabs. John Wiley & Sons, 2nd edition, 2000.
[17] J.C. Simo and T.J.R. Hughes. A return mapping algorithm for plane stress elastoplasticity. International Journal for Numerical Methods in Engineering, 5:649–670, 1986.
[18] J.C. Simo and T.J.R. Hughes. Computational Inelasticity, volume 7 of Interdisciplinary Applied Mathematics. Springer-Verlag, 1998.
[19] B. Stroustrup.The C++ Programming Language: Special Edition. Addison-Wesley Publishing Company, 3rd edition, 2000.
[20] O.C. Zienkiewicz R.L. Taylor. The Finite Element Method for Solid and Structural Mechanics. Butterworth-Heinemann, 6th edition, 2005.