THE INFLUENCE OF ARCHITECTURAL AND SPECTRAL PARAMETERS
OF A TROPICAL FOREST CANOPY UNDER ITS REFLECTANCE
DESCRIBED BY IBIS MODEL
Thom´e Simpliciano Almeida
1, Marcos Heil Costa
1,
S´ılvia de Nazar´e Monteiro Yanagi
2and Yosio Edemir Shimabukuro
3 Recebido em 22 novembro, 2010 / Aceito em 11 julho, 2012Received on November 22, 2010 / Accepted on July 11, 2012
ABSTRACT.Studying and monitoring vegetation is the key to understand the current climate pattern in both regional and global scales. Dynamical Vegetation Models (DVM) are useful tools in biome studies, since they are based on physical principles as well as on initial and boundary conditions. They are able to obtain evidences of factors that influence the modeled environment, predicting future vegetation behavior and, in association with other models, making future predictions of vegetation influence on climate or the effect of climate change on vegetation itself. In particular, reflectance models are part of DVMs. Some studies have attempted to identify canopy elements influence on the vegetation cover albedo, obtaining the best configuration of parameters to be used. Important parameters are estimated from the reflectance in specific spectral bands. Thus, the objective of this study was to evaluate the IBIS model - Integrated Biosphere Simulator performance running it at three bands – red, near infrared, and blue, corresponding to the bands 1, 2 and 3 of the MODIS sensor, onboard of the TERRA and AQUA satellites. The sensitivity to optical parameters (leaf reflectance) and architecture (slope of the leaves) of the canopy was also evaluated. These optical and architectural parameters were calibrated according to the surface reflectance and vegetation index from MODIS for the Cuieiras Reserve (K34). The sensitivity analysis indicated a strong influence of the upper canopy parameters. The parameters combination that minimizes the RMSE of EVI – Enhanced Vegetation Index (RMSE = 0.0245) were the slope of the upper canopy leaves χup= 0.92, reflectance from the upper canopy leaves in the blue band ρblue−up= 0.0162, red band ρred−up= 0.0466 and near infrared band ρnir−up= 0.4427.
Keywords: reflectance models, tropical rainforest, remote sensing.
RESUMO.Estudar e monitorar a cobertura vegetal s˜ao importantes para compreender o padr˜ao clim´atico atual em escala regional e global. Os Modelos de Dinˆamica de Vegetac¸˜ao (MDV) s˜ao ferramentas ´uteis nos estudos de determinado bioma, pois s˜ao baseados em princ´ıpios f´ısicos e em condic¸˜oes iniciais e de contorno, podendo ent˜ao obter ind´ıcios dos fatores que influenciam o ambiente modelado, fazer previs˜oes futuras do comportamento da vegetac¸˜ao e, associados a outros modelos, fazer previs˜oes futuras da influˆencia da vegetac¸˜ao no clima, ou da mudanc¸a do clima na vegetac¸˜ao. Em particular, os modelos que simulam a reflectˆancia de um dossel fazem parte dos MDV. Alguns estudos tˆem sido feitos para identificar a influˆencia dos componentes do dossel sobre o albedo da cobertura vegetal, obtendo a melhor configurac¸˜ao dos parˆametros a serem usados. Para a vegetac¸˜ao, importantes parˆametros s˜ao estimados a partir da reflectˆancia em faixas espectrais espec´ıficas. Nesse aspecto o objetivo desse trabalho foi adicionar no modelo IBIS –Integrated Biosphere Simulatortrˆes bandas vermelho, infravermelho pr´oximo e azul, referentes `as bandas 1, 2 e 3 do sensor MODIS, a bordo dos sat´elites TERRA e AQUA, observando a sensibilidade aos parˆametros ´opticos (reflectˆancia de folhas) e arquitetˆonicos (inclinac¸˜ao das folhas) do dossel e calibrando esses parˆametros de acordo com os produtos de reflectˆancia de superf´ıcie e ´ındice de vegetac¸˜ao do MODIS para a Reserva do Cuieiras (K34). A an´alise de sensibilidade indicou forte influˆencia dos parˆametros referentes `a parte superior do dossel. A combinac¸˜ao dos parˆametros que minimizou o RMSE do EVI –Enhanced Vegetation Index(RMSEmin= 0,0245) foi a inclinac¸˜ao das folhas do dossel superior χup= 0,92, reflectˆancia das folhas da parte superior do dossel na faixa do azul ρblue−up= 0,0162, vermelho ρred−up= 0,0466 e infravermelho pr´oximo ρnir−up= 0,4427.
Palavras-chave: modelos de reflectˆancia, floresta amazˆonica, sensoriamento remoto.
1Universidade Federal de Vic¸osa, Departamento de Engenharia Agr´ıcola, Departamento de Meteorologia Agr´ıcola, Av. PH Rolfs s/n, 36570-000 Vic¸osa, MG, Brazil. Phone: +55(31) 3899-1900; Fax: +55(31) 3899-2735 – E-mails: [email protected], [email protected]
2Universidade Federal de Lavras, Departamento de Engenharia, Campus Universit´ario, Caixa Postal 3037, 37200-000 Lavras, MG, Brazil. Phone: +55(35) 3829-1374, Ramal 1374 – E-mail: [email protected]
3Instituto Nacional de Pesquisas Espaciais, Coordenac¸˜ao Geral de Observac¸˜ao da Terra, Divis˜ao de Sensoriamento Remoto, Av. dos Astronautas, 1758, Jardim da Granja, Caixa Postal 515, 12227-010 S˜ao Jos´e dos Campos, SP, Brazil. Phone: +55(12) 3945-6483; Fax: +55(12) 3945-6488 – E-mail: [email protected]
INTRODUCTION
More than half of the annual net primary production (NPP) over the world occurs in the tropics, and the tropical forests are respon-sible for the most part of this production (Mulkey et al., 1996). The Amazon rainforest, for example, influences the regional and global climates, making the study of the vegetation dynamics in the Amazon region and its relation with the climate a matter of great interest in ecosystem-biosphere interaction studies (Kobayashi & Dye, 2005; Huete et al., 2006a).
In this aspect, the Dynamical Vegetation Models (DVM) are useful tools in biome studies, since they are based on physical principles as well as on initial and boundary conditions (Yanagi & Costa, 2011). They can obtain evidences of factors that influence the modeled environment, predict future vegetation behavior, and, in association with other models, make future predictions of the vegetation influence on climate or of the effect of climate change on vegetation itself.
The DVMs are integrated by a set of interdependent models of mass, heat and “momentum” exchange between the atmosphere and the earth surface. In particular, the reflectance models be-long to this set of models which compose the DVMs, as the sur-face reflectance is an important factor in the modeling of many Earth systems, and it is used to calculate the albedo and fraction of photosyntetically active radiation (fPAR) absorbed by the canopy. The possibility to simulate cover characteristic variations and the reflectance values allow estimating trends and acquiring configu-ration improvements of the factors that compose the models.
The study of the electromagnetic radiation (EMR) interaction with canopies focuses on the variation of the physiological pro-cesses, canopy structural and illumination geometry parameters, and sight over its spectral responses, and from these responses, other vegetation parameters, like biomass or carbon stock, etc, can be inferred in qualitative and quantitative terms.
Considering the need of studying the parameters that inter-fere in the canopy reflectance response, the purpose of this work was to study the influence of the architectural and spectral para-meters in the values and in the reflectance sensitivity of a tropical forest simulated by the Integrated Biosphere Simulator – IBIS for the Cuieras Biological Reserve – K34, equivalent to the MODIS sensor bands 1, 2 and 3, red (650 nm), near infrared (850 nm) and blue (460 nm) bands, respectively, and to calibrate the model, validating the results with the MODIS sensor data.
THEORETICAL FUNDAMENTALS
The leaf is the main canopy element related to its interaction with the EMR, and the analysis of reflectance, transmittance and
ab-sorptance is necessary for the accomplishment of the leaf and, consequently, of the canopy spectral studies. When only a sin-gle isolated leaf is considered, it can be noted that its spectral response is related to its chemical, morphological and physiol-ogical compositions, and each one predominantly influences, at least, three optical spectrum regions: Visible region (400-720 nm): a region dominated by the absorption of leaf existing pigments (chlorophyll, carotenes and xanthophylls). The absorp-tion is higher in the blue (near 440 nm) and in the red region (650 nm) due to the action of these pigments only. Near infrared (NIR) region (720-1100 nm): a region with low radiation absorp-tion and considerable internal scattering, presenting high reflec-tivity as its main characteristic. The absorption by water is low in this spectrum region. Mid infrared region (1100-3200 nm): a region with high absorption due to the presence of liquid water (Ponzoni & Shimabukuro, 2007).
In relation to canopies, the reflectance variation of the vegeta-tion cover in different spectral bands depends mainly on the opti-cal characteristics (leaf and stem reflectance), and on the canopy architecture (Leaf Area Index – LAI, leaf and stem angular dis-tribution). However, in some studies it can be observed that the reflectance curve shape of a canopy is similar to the reflectance curve of the isolated leaves that compose the canopy (Goel, 1988; Jensen, 2000; Ponzoni & Shimabukuro, 2007).
The vegetation reflectance modeling has generated many im-portant parameter estimations for the environmental system mod-eling. Liu et al. (2008) used satellite data (MODIS), reflectance model (two-stream) and a leaf dynamics model (Dickinson et al., 2008) to infer the LAI seasonality, a parameter directly related to the surface model performance.
Yanagi & Costa (2011) evaluated the albedo response sensi-tivity of the IBIS – “Integrated Biosphere Simulator” model (Foley et al., 1996) for a tropical forest in the visible and near infrared bands, varying the canopy architectural parameters (leaf orienta-tion) and the spectral parameters (leaf reflectance). Being so, it was obtained the best configuration of the parameters to be used, which were validated with a field campaign in the Cuieiras Bio-logical Reserve (K34), located near Manaus.
For vegetation, important characteristics are estimated using the reflectance in specific bands. Two bands with important anal-ysis for the vegetation study are the red (650 nm) – with low re-flectance by the solar radiation absorption due to the action of the leaf photosynthetic pigments – and the near infrared (850 nm) – with high reflectance due to the radiation scattering related to the leaf cellular structure (Knipling, 1970).
Nowadays, a common tool for the vegetation study and monitoring are the images of the Moderate Resolution Imaging
Spectroradiometer (MODIS) sensor, which is the main sensor aboard the TERRA and AQUA platforms, launched on December 18, 1999 and on May 4, 2002, respectively. The satellites have different passage times, 10h30min for TERRA satellite and 13h30min for AQUA satellite.
Many applications have been assigned to the use of the MODIS sensor and its products for the tropical Forest study. Seasonal variations (phenology) (Xiao et al., 2006; Huete et al., 2006b) were identified using the MODIS EVI (Enhanced Vegeta-tion Index) data, in which it was concluded that this seasonality assignment can be related to the solar radiation seasonality and not to the annual climatic seasons. The leaf area index, the sea-sonality of this index (Asner et al., 2003; Liu et al., 2008), and gross primary production – GPP (Ichii et al., 2007) estimations are completed and evaluated using the MODIS obtained data.
One of the available products is the MOD09 (MODIS/ TERRA)/MYD09 (MODIS/AQUA), which refers to the surface re-flectance, with the wavelengths centered on 648, 858, 470, 555, 1240, 1640 and 2130 nm, corresponding to bands 1 to 7. This product is a surface spectral reflectance estimation in each band. Other two products offered by the MODIS are the MOD13 (MODIS/TERRA) and MYD13 (MODIS/AQUA), derived from MOD09 and MYD09 respectively, making available data from two vegetation indexes, the NDVI (Normalized Difference Vegetation Index) and the EVI (Enhanced Vegetation Index). These indexes provide temporal and spatial data consistent comparisons of the global vegetation conditions, allowing the photosynthetic activity monitoring, and vegetation biophysical and phenological change detection.
EXPERIMENTAL AREA DESCRIPTION
The experimental site of Cuieiras Biological Reserve (2◦350S,
60◦070W), where one of the monitoring towers of the Large Scale
Biosphere-Atmosphere Experiment in Amazˆonia (LBA) is settled, is located 60 km north of Manaus-AM and 90 m above sea level (Fig. 1). It presents the typical undisturbed primary tropical forest vegetation, highly diversified in floristic terms, with the canopy reaching between 30 and 40 m. The relief is composed by many valley intercalated plateaus, constituting a rich drainage network; it presents an alic yellow latosol, with a clay texture and satis-factory drainage (Chauvel, 1982). The local climate is a Central Amazonian typical climate, with high temperatures, quite abun-dant rains during the year, and a brief dry season.
MATERIAL AND METHODS
MODIS/TERRA and MODIS/AQUA data collecting and processing
The MODIS – MOD09Q1, MOD13Q1 (TERRA) and MYD09Q1, MYD13Q1 (AQUA) data are distributed on the siteEarth
Observ-ing System Data Gateway, with spatial resolution of 250 m. The MOD09Q1 and MYD09Q1 images (surface reflectance) have 8-day temporal resolution, whereas the MOD13Q1 and MYD13Q1 images have 16-day resolution. The acquired Tiles (projection and mosaic single system) referred to Cuieiras Reserve location, from the period 2002 to 2005, with the first image on 01/01/2002 and the last image on 12/27/2005 with a 16-day interval.
The selected images corresponded to the dates when the K34 field data collection was carried out (data used for model input), and the selected images were those that apparently were free from the presence of clouds in the site location and with good qual-ity. This selection was accomplished using the QA (Quality As-sessment) information of each image pixel. The QA indicates the good quality content of a pixel after the image processing, that is, if the image processing could treat adequately the pixel’s noise, the presence of clouds, aerosols or geometric errors. This kind of assessment allows the automation of the pure pixel assessment. After this first evaluation, the pixels that did not present good qual-ity were replaced by the neighbor pixel with better qualqual-ity.
For comparison with the model results, the images were con-verted from digital numbers (DN) to reflectance physical values (RPV), for bands 1 (red, 650 nm), 2 (near infrared, 850 nm) and 3 (blue, 460 nm), using 16 bits (65536 gray levels) for the re-flectance conversion factor (Eq. 1). This conversion factor is pro-vided in the same image file or at the MODIS product distribution site. The same procedure was carried out for the NDVI and EVI images, and these products are also in digital numbers and need to be converted to vegetation index values. The MOD09, MOD13, MYD09, MYD13 products use the same conversion factor. The data were extracted and converted to physical values via NCL programming (NCAR Command Language).
V F R = N D × 0.0001 (1)
IBIS model description
The IBIS belongs to a new generation of global biosphere models, classified as global vegetation dynamic model, that con-siders the changes which occurred in the vegetation composition and structure as a response to the environmental conditions. This model comprehends many processes, including the interactions between the surface and the atmosphere, CO2and nutrient cycles,
and vegetation dynamics. It is one of the few models that incor-porates the ecosystem process variety in a single structure, in-cluding: energy, water and carbon dioxide exchange among soil, plants and atmosphere; plant and soil organism physiological processes, including CO2assimilation and respiration; growth
and competition between plants; nutrient (C, N) cycle and soil physical processes (Foley et al., 1996). For this study it will be considered only the model part related to the radiative transfer in the canopies.
Figure 1 – Study area – site K34.
With one hour interval, the IBIS model uses as input data the incident solar radiation (W.m–2), the reflected radiation (W.m–2),
the air temperature (◦C), the horizontal wind velocity (m.s–1);
precipitation (mm) and relative humidity of air (%). These data were measured using a micrometeorological tower installed in the Reserve for the period from 2002 to 2005.
In the IBIS model the canopy reflectance is considered as the ratio of reflected radiation flux to incident radiation, and the to-tal reflectance is an average of the two reflectance types (direct and diffuse), each one associated to an incident irradiance field, where the two reflectance types are combined to obtain the surface reflectance (ρ): ρ = I d inrd+ Iini ri Id in+ Iini (2) whererdis the directional-hemispherical reflectance associated to the incident irradiance field which is purely collimated Iind; andri are the indirect hemispherical reflectance associated to the irradianceIini field which is purely isotropic.
The solar radiation exchange among the soil, vegetation and atmosphere is calculated following the two-stream approx-imation, which consists in combining the characteristics of the
subsequent layer reflectance and transmittance in order to eval-uate the reflectance in a given canopy. For example, if we get an intermediate point between the two canopy layers (upper and lower) as reference, this point will be illuminated by two fluxes coming from the upper and lower layers to the reference point. The model considers the canopy constituted by two layers and the soil presence. The calculation is separated for the direct and diffuse radiation, both for visible bands (400 to 700 nm) and solar infrared (700 to 4000 nm).
The two-stream algorithm uses some canopy spectral and architectural parameters. The architectural parameters include upper and lower part element orientation (χup, χlo), soil cover fraction due to the canopy upper and lower part (fup, flo), leaf area index (LAI), stem area index (SAI). Within the spectral pa-rameters, we have canopy upper and lower part leaf reflectance in the visible and infrared bands (ρvis−up, ρvis−lo, ρnir−upand ρnir−lo), canopy upper and lower part leaf transmittance, in the visible and infrared (τvis−up, τvis−lo, τnir−upand τnir−lo).
More description about the two-stream algorithm can be found in Dickinson (1983) and Sellers (1985), with description in Bonan (1996) and also in Oleson et al. (2004).
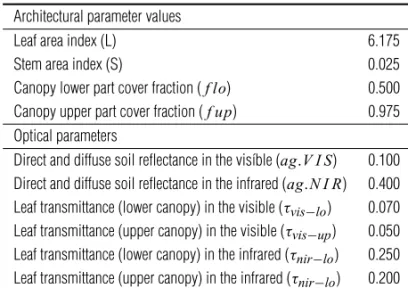
Table 1 – Parameters used in the model.
Architectural parameter values
Leaf area index (L) 6.175 Stem area index (S) 0.025 Canopy lower part cover fraction (f lo) 0.500 Canopy upper part cover fraction (f up) 0.975 Optical parameters
Direct and diffuse soil reflectance in the vis´ıble (ag.V I S) 0.100 Direct and diffuse soil reflectance in the infrared (ag.N I R) 0.400
Leaf transmittance (lower canopy) in the visible (τvis−lo) 0.070 Leaf transmittance (upper canopy) in the visible (τvis−up) 0.050 Leaf transmittance (lower canopy) in the infrared (τnir−lo) 0.250 Leaf transmittance (upper canopy) in the infrared (τnir−lo) 0.200
Spectral band implementation in IBIS
In this study, the IBIS version 0-D (Foley et al., 1996) was used. The IBIS model module that handles the radiative trans-fer in canopies performs the reflectance calculation for the visi-ble (albedo) and infrared bands. Then, the calculation for the re-flectance in blue and in red were added to the model using the same equations the model applied for the reflectance calculation in the visible, and the calculation for the near infrared followed the equations used for the infrared.
For the band insertion, even using the equations in the visible and infrared already in the model, it was necessary to add to the IBIS code the parameters related to the canopy upper and lower part leaf reflectance in the blue, red and near infrared (ρblue−up, ρblue−lo, ρred−up, ρred−lo, ρnir−up, ρnir−lo) bands and also, for the calculation, the leaf and stem transmittances for each band (τblue−up, τblue−lo, τred−up, τred−lo, τnir−up, τnir−lo).
The canopy reflectance in all bands is calculated separately by the model. The input data for the IBIS model radiative transfer part are the incident and reflected radiations, measured from 2002 to 2005, with one hour interval.
Eight optical and architectural model parameters were eval-uated: canopy upper layer leaf and stem orientation (χup) and canopy lower layer leaf orientation (χlo), canopy upper and lower layer leaf reflectance in the red, near infrared and blue bands (ρred−up, ρred−lo, ρnir−up, ρnir−lo, ρblue−upand ρblue−lo).
Other canopy spectral and architectural parameters, used in IBIS (Table 1), were kept fixed.
Firstly, a sensitivity analysis was performed to identify the canopy architectural and biophysical parameters that most in-fluence the canopy reflectance estimated by the model for the
study site. After identifying the parameters, a calibration of these parameters was carried out, in order to obtain the best model configuration. The calibrations were performed observing the smallest RMSE value, combining the ρλ−up and values, for
the reflectance estimated by the model, in comparison with the surface reflectance data in each MODIS band.
RESULTS AND DISCUSSION Sensitivity analysis
The reflectance parameters simulated by the IBIS model and ana-lyzed in this work were: canopy upper layer leaf and stem orienta-tion (χup) and canopy lower layear leaf orientation (χlo), canopy upper and lower leaf reflectance in the bands blue, red and near infrared (ρblue−up, ρblue−lo, ρred−up, ρred−lo, ρnir−up and ρnir−lo).
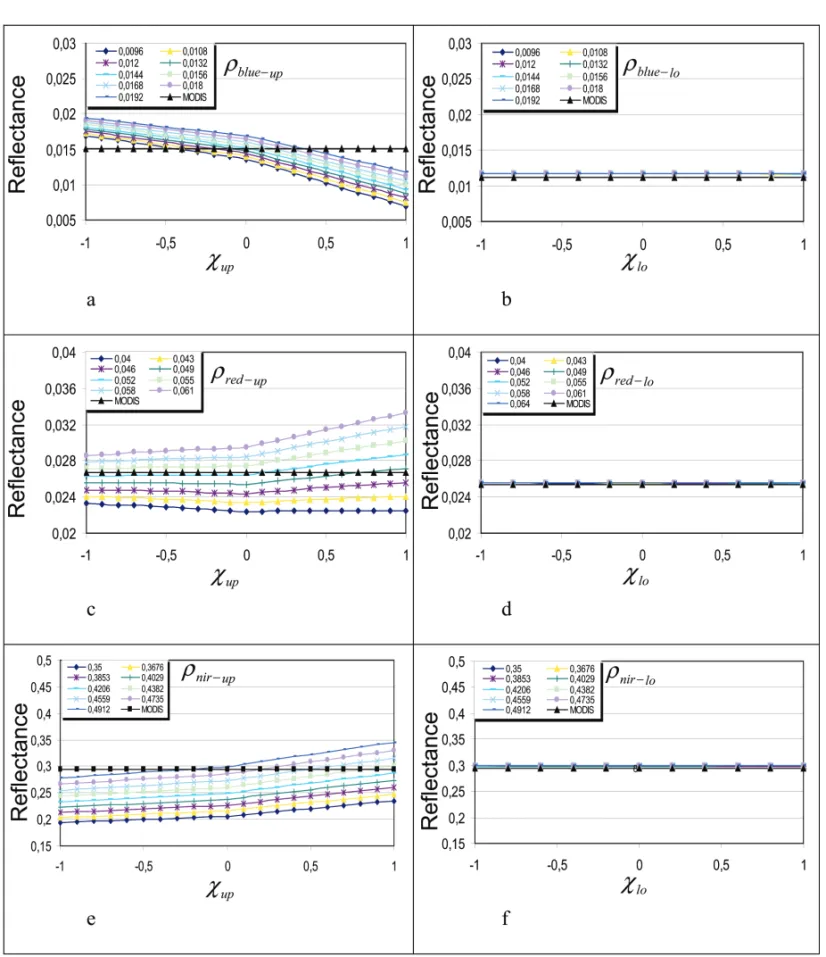
The leaf orientation, for both layers, had values simulated between 1 (horizontal) and −1 (vertical). The model response related to the two parameters can be seen in Figure 2. For the Amazon region, the leaf inclination sensitivity, in general, is higher in the three bands for the upper canopy. It can also be observed that the IBIS estimated reflectance presents a larger vari-ation when χupis modified and not χlo. The explanation is that, in a dense forest like Amazon, the upper canopy part absorbs large part of the solar radiation, and prevents it to reach the lower canopy part and, consequently, the return of the reflectance. For this reason, there is a lower reflectance sensitivity in relation to the canopy lower part leaves.
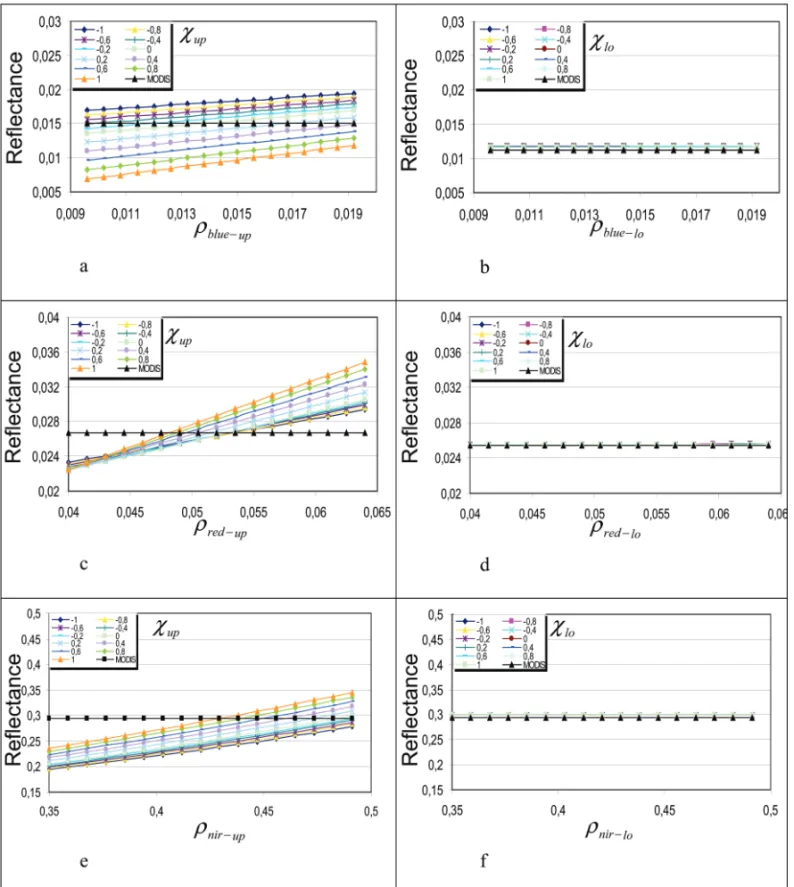
The same behavior can be observed for the upper and lower canopy leaf reflectance for each band (Fig. 3), where the highest sensitivity is observed for the forest upper canopy leaves. These
Figure 2 – Canopy reflectance sensitivity in relation to the inclination of canopy upper (a – c – e) and bottom leaves (b – d – f). ab – blue; cd red; ef – near infrared.
results show the relevance of the canopy upper layer spectral and architectural parameters, and the low sensitivity of the modeled reflectance in relation to the canopy lower layer parameters. The influence of the illumination geometry was not treated in this study because the MODIS images always have the same acquisition
hour, and the reflectance, then, could not be evaluated under dif-ferent solar inclination angles.
Thus, the parameter calibration was carried out for the canopy upper layer, considering the predominant influence, in each band, of the canopy upper layer leaf reflectance and the
Figure 3 – Canopy reflectance sensitivity in relation to the reflectance of canopy upper (a – c – e) and bottom leaves (b – d – f). ab – blue; cd red; ef – near infrared.
inclination of the canopy upper layer leaves in the reflectance simulated by the model.
Reflectance calibration and leaf inclination
Through the sensitivity analysis, it was possible to identify that the most influent parameters in the reflectance in each band
be-long to the canopy upper part (Figs. 2 and 3). The reflectances in each canopy lower layer band had fixed values of 0.062 (for the blue and the red) and 0.60 (for the near infrared), and χlo = 0.10 for the leaf inclination, which were values obtained by Yanagi & Costa (2011). For MODIS data, the leaf reflectances were calibrated, for each band (ρλ−up), and the leaf inclination
Many combinations between the leaf reflectance (in each band) and the leaf inclination of the canopy upper part were tested according to two MODIS products, the surface reflectance and the EVI vegetation index. Thus, the calibration of these factors were carried out, considering each band separately, and a cali-bration considering the three bands together (blue, red and near infrared), which are used for the EVI calculation.
For the leaf reflectance, the values that produced the best canopy reflectance adjustment were: varying between 0.0128 and 0.0137 for the blue band (ρblue−up), between 0.0463 and 0.0471 for the red (ρred−up), and between 0.4338 and 0.4348 for the near infrared (ρnir−up).
In relation to the geometric parameters, the leaf inclination value, which minimized the canopy reflectance RMSE, had dif-ferent results for the three bands. The best configuration was χup with values between 0 and 0.1, for the blue band, between 0.37 and 0.47 for the red χup, and between 0.90 and 0.95 for the near infrared band χup. The difference for the χupvalues found for each band can be related to the errors caused by the propri-ety differences of each studied wavelength. Phenomena like ab-sorption, reflection and scattering by the atmosphere constituents, liquid water presence in the canopy components influence the re-flectance measured by the sensor. Not all sensor data that refer to the site location were obtained at nadir, generating differences between the measurements, as the model simulates only the re-flectance at nadir, this also generated calibration divergences.
To find a single value for χup, more coherent for the model, another calibration was performed using the MODIS EVI prod-ucts. The reason is that EVI is a normalization of the three bands (blue, red and near infrared) with atmosphere and soil correction factors. Being so, there is also the calibration of the three bands and the leaf inclination simultaneously.
Then, the optical and geometric parameter configuration that minimized the RMSE (0.0245) was ρblue−up= 0.0162, ρred−up = 0.0466, ρnir−up= 0.4427 and a χup= 0.92.
The optimum leaf reflectance values in the blue and near in-frared band had slight alterations in relation to the analysis of each band separately, whereas the red band is within the optimum band previously found.
In relation to the leaf inclination, the result showed an approx-imation with the near infrared calibration, indicating that the cor-rections (atmosphere, soil and sight) within the EVI data produced good results for the calibration, as the EVI presents corrections in the blue and in the red band.
Yanagi & Costa (2011) obtained a χupequals to 0.86 in the albedo simulation study for the same study site, based on the VIS
and NIR band analyses. On the other hand, Bonan (1996) and Oleson et al. (2004) found values varying between −0.4 and 0.6 for the same parameter in the canopy albedo simulation. The value equals to 0.86 is nearer to the calibration obtained through the comparison with the EVI.
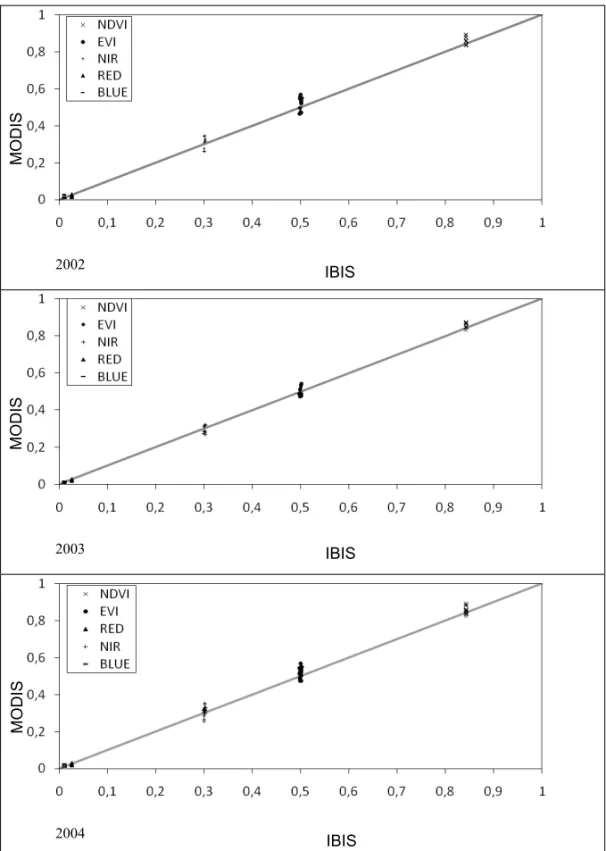
Figure 4 shows the dispersion graphs of the MODIS data in relation to the simulated by the IBIS model for the years 2002, 2003 and 2004. The graphs indicate the linearity of the two data. The closer to the straight liney = x, the more intense the data proximity. The data also show slight interannual variation. CONCLUSIONS
In this study the reflectance sensitivity was evaluated in the bands blue (460 nm), red (650 nm) and near infrared (850 nm) simulated by the IBIS model for a set of spectral and architectural parameters of the tropical forest canopy.
The reflectances were evaluated according to the MODIS sen-sor data for Cuieiras (K34) Biological Reserve. The sensitivity analysis indicated an intense response for the parameters which refer to the canopy upper part due to the high forest LAI, indicating that the forest reflectance, according to the carried out simula-tions, measured through orbital optical remote sensors, is gov-erned, predominantly, by the canopy upper part. The parame-ter combination for a smaller RMSE = 0.0245 was χup = 0.92, ρblue−up= 0.0162, ρred−up= 0.0466, ρnir−up= 0.4427 in com-parison with the EVI vegetation index.
This study indicates the simulation potential in narrow eletro-magnetic spectrum bands for the radiative transfer part of the dy-namical vegetation model, IBIS. For future studies, parameter ad-ditions, like leaf area index dynamics, will enable a more compre-hensive seasonality check and the application in different biomes. Larger area studies is an optimal practice in the modeling area, where it could be observed in a given location the vegetation re-sponse related to the climatic characteristics in the region.
The results of this work are limited by the lack of the field campaigns that can add errors and the MODIS data constitute a product that presents some imprecision. It is worth mentioning the importance of the field campaigns for this kind of study, as these measurements are less influenced by the atmospheric con-stituents. The union of modeling, field campaigns and remote sensing data would complete the reflectance study for the climatic models.
ACKNOWLEDGMENTS
The authors would like to thank CNPq for the post-graduate scholarship, as well as the collaborators and reviewers for the
2002 2003 2004 M O DI S IBIS M O DI S IBIS M O DI S IBIS
Figure 4 – Dispersion of MODIS data and IBIS for the years 2002, 2003 and 2004.
remarks and suggestions, which improved the work. The first author would like to thank Universidade Federal de Vic¸osa (UFV) for to the permission to participate in the Master program. REFERENCES
ASNER GP, SCURLOCK JMO & HICKE JA. 2003. Global synthesis of leaf area index observations: implications for ecological and remote sensing studies. Global Ecology & Biogeography, 12: 191–205. doi: 10.1046/j.1466-822X.2003.00026.x.
BONAN GB. 1996. A Land surface model (LSM version 1.0) for ecolog-ical, hydrologecolog-ical, and atmospheric studies: technical description and user’s guide. NCAR Technical note TN-417+STR, 150 pp.
CHAUVEL A. 1982. Os latossolos amarelos, ´alicos, argilosos dentro dos ecossistemas das bacias experimentais do INPA e da regi˜ao vizinha. Acta Amazonica, Suplemento 12(3): 47–60.
DICKINSON RE. 1983. Land surface processes and climate-surface albedos and energy balance. Advances in Geophysics, 25: 305–353.
DICKINSON RE, TIAN Y, LIU Q & ZHOU L. 2008. Dynamics of leaf area for climate and weather models. Journal of Geophysical Research, 113. doi: 10.1029/2007JD008934.
FOLEY JA, PRENTICE IC, RAMANKUTTY N, LEVIS S, POLLARD D, SITCH S & HAXELTINE A. 1996. An integrated biosphere model of land surface processes. Global Biogeochemical Cycles, 10: 603–628. doi: 10.1029/96GB02692.
GOEL NS. 1988. Models of vegetation canopy reflectance and their use in estimation of biophysical parameters from reflectance data. Remote Sensing Reviews. Great Britain, 4(1): 1–212.
HUETE AR, HUEMMRICH KF, MIURA T, XIAO X, DIDAN K, LEEUWEN W, HALL F & TUCKER CJ. 2006a. Vegetation Index greenness global data set. NASA ESDR/CDR.
HUETE AR, DIDAN K, SHIMABUKURO YE, RATANA P, SALESKA SR, HUTYRA LH, YANG W, NEMANI RR & MYNENI R. 2006b. Amazon rain-forests green-up sunlight in dry season. Geophysical Research Letters, 33. doi: 10.1029/2005GL025583.
ICHII K, HASHIMOTO H, WHITE MA, POTTER C, HUTYRA LR, HUETE AR, MYNENI RB & NEMANI RR. 2007. Constraining rooting depths in tropical rainforests using satellite data and ecosystem modeling for accu-rate simulation of gross primary production seasonality. Global Change Biology, 13: 67–77. doi: 10.1111/j.1365-2486.2006.01277.x. JENSEN JR. 2000. Multispectral Remote Sensing Systems. Remote Sensing of the Environment: An Earth resource perspective. Upper Sad-dle River, NJ: Prentice Hall, cap. 7, p. 181–240.
KNIPLING EB. 1970. Physical and Physiological Basis for the flectance of Visible and Near – Infrared Radiation from Vegetation. Re-mote Sensing of Environment. p. 155–159.
KOBAYASHI H & DYE DG. 2005. Atmospheric conditions for monitor-ing the long-term vegetation dynamics in the Amazon usmonitor-ing normalized
difference vegetation index. Remote Sensing of Environment, 97: 519– 525. doi: 10.1016/j.rse.2005.06.007.
LIU Q, GU L, DICKINSON RE, TIAN Y, ZHOU L & POST WM. 2008. As-similation of satellite reflectance data into a dynamical leaf model to infer seasonally varying leaf areas for climate and carbon models. Journal of Geophysical Research, 113. doi: 10.1029/2007JD009645.
MODIS Land. Available on: <http://modis-land.gsfc.nasa.gov>. Ac-cess on: April 12, 2008.
MULKEY SS, KITAJIMA K & WRIGHT SJ. 1996. Plant Physiological Ecology of Tropical Forest Canopies. Tree, 11(10). doi: 10.1016/0169-5347(96)10043-4.
OLESON KW, DAI Y, BONAN GB, BOSILOVICH M, DICKINSON R, DIRMEYER P, HOFFMAN F, HOUSER P, LEVIS S, NIU G-Y, THORNTON P, VERTENSTEIN M, YANG Z-L & ZENG X. 2004. Technical description of the Community Land Model (CLM). NCAR Technical note. p. 174. PONZONI FJ & SHIMABUKURO YE. 2007. Sensoriamento Remoto no Estudo da Vegetac¸˜ao. S˜ao Jos´e dos Campos: Instituto Nacional de Pesquisas Espaciais – INPE, NJ: Parˆentese, cap. 1, p. 5–40.
SELLERS PJ. 1985. Canopy reflectance, photosynthesis and transpi-ration. International Journal of Remote Sensing, 6: 1335–1372. doi: 10.1080/01431168508948283.
XIAO X, HAGEN S, ZHANG Q, KELLER M & MOORE B. 2006. Detecting leaf phenology of seasonally moist tropical forests in South America with multi-temporal MODIS images. Remote Sensing of Environment, 103: 465–473. doi: 10.1016/j.rse.2006.04.013.
YANAGI SNM & COSTA MH. 2011. Modeling Radiative Transfer in Trop-ical Rainforest Canopies: Sensitivity of Simulated Albedo to Canopy Architectural and optical Parameters. Annals of the Brazilian Academy of Sciences, 83(4): 1231–1242.
NOTES ABOUT THE AUTHORS
Thom´e Simpliciano Almeida. Undergraduation in Physics at Universidade Federal de Vic¸osa (2006), Master degree in Agricultural Meteorology at Universidade
Federal de Vic¸osa (2008). Presently is a doctorate student in Agricultural Meteorology at Universidade Federal de Vic¸osa. Research area: remote sensing, reflectance models and agrometeorological models.
Marcos Heil Costa. Undergraduation in Agricultural Engineering at Universidade Federal de Vic¸osa (1986), Master degree in Agricultural Meteorology at Universidade
Federal de Vic¸osa (1991) and Doctorate degree in Atmospheric and Oceanic Sciences at University of Wisconsin-Madison (1998). Presently is associated professor at Universidade Federal de Vic¸osa. Experience in Geoscience, with emphasis in Climatology, acting mainly in the following subjects: atmosphere-biosphere-hydrosphere interactions, ecosystem micrometeorology and large-scale hydrology.
S´ılvia de Nazar´e Monteiro Yanagi. Undergraduation in Meteorology at Universidade Federal do Par´a (1997), Master degree in Agricultural Meteorology at
Univer-sidade Federal de Vic¸osa (2001) and Doctorate degree in Agricultural Meteorology at UniverUniver-sidade Federal de Vic¸osa (2006). Experience in Geoscience, with emphasis in Meteorology and Climatology, acting mainly in the following subjects: Biosphere-atmosphere system interactions, ecosystem micrometeorology and hydroclimatology.
Yosio Edemir Shimabukuro. Undergraduation in Forest Engineering at Universidade Federal Rural do Rio de Janeiro (1972), Master degree in Remote Sensing at
Instituto Nacional de Pesquisas Espaciais (1977), Doctorate degree in Forest Science/Remote Sensing at Colorado State University (1987) and Post-Doctorate research at Nasa Goddard Space Flight Center (1993). Presently is full researcher at Instituto Nacional de Pesquisas Espaciais. Experience in Forest Resources and Forest Engineering. Acting mainly in the following subjects: Linear Mixing Model, Landsat MSS TM, Shade Fraction Image, Reforested Areas, Mathematical Modelling.