A LABVIEW BASED SYNCHRONIZED DATA
ACQUISITION SYSTEM WITH INTEGRATED
WEBCAM FOR WELDING PROCESSES
UNIVERSIDADE FEDERAL DE UBERLÂNDIA
FACULDADE DE ENGENHARIA MECÂNICA
FERNANDA MENDONÇA SILVEIRA
A LABVIEW BASED SYNCHRONIZED DATA ACQUISITION SYSTEM
WITH INTEGRATED WEBCAM FOR WELDING PROCESSES
Dissertation
presented to the Post-graduation
Programme in Mechanical Engineering of Federal
University of Uberlândia, as part of the
requirements to obtain the title of
MASTER IN
MECHANICAL ENGINEERING.
Concentration Area: Manufacturing Processes.
Supervisor:
Prof. PhD. Américo Scotti
F I C H A C A T A L O G R Á F I C A
Elaborada pelo Sistema de Bibliotecas da UFU / Setor de Catalogação e Classificação
S587l
Silveira, Fernanda Mendonça, 1981-
A labview based synchronized data acquisition
system with integrated webcam for welding processes /
Fernanda Mendonça Silveira. - Uberlândia, 2006.
156f. : il.
Orientador: Américo Scotti.
Dissertação (mestrado) – Universidade Federal de
Uberlândia, Programa de Pós-Graduação em
Engenharia Mecânica.
Inclui bibliografia.
1. Soldagem - Teses. 2. Processos de fabricação -
Teses. I. Scotti, Américo. II. Universidade Federal de
Uberlândia. Programa de Pós-Graduação em
Engenharia Mecânica. III. Título.
621.791
FERNANDA MENDONÇA SILVEIRA
A LABVIEW BASED SYNCHRONIZED DATA ACQUISITION SYSTEM
WITH INTEGRATED WEBCAM FOR WELDING PROCESSES
Dissertation
APPROVED
by the Post-graduation
Programme in Mechanical Engineering of Federal
University of Uberlândia.
Concentration Area: Manufacturing Processes.
Evaluation Committee:
______________________________________
Prof. PhD. Américo Scotti (UFU) – Supervisor
______________________________________
Prof. Dr. Jair Carlos Dutra (UFSC-SC)
______________________________________
Prof
a. Dra. Ing. Vera Lúcia D. S. Franco (UFU)
I dedicate this work to my family, especially to my mother Edna and my grandfather
ACKNOWLEDGEMENT
I would like to thank the Federal University of Uberlândia and the Faculty of
Mechanical Engineering for the opportunity of doing this course.
Cranfield University for the opportunity of using its facilities and the funds provided.
My supervisor in Brazil, Américo Scotti, for spending his time giving me the
orientation I needed to execute this work.
My supervisor in England, David Yapp, for the permission I had to develop this work
at Cranfield University.
My colleagues in Brazil for the moments we spent together.
My colleagues in England, especially Gil and Harry, for the patience and help I
received.
Thanks to CNPq and the Programme AlBan for funding this work.
“This work was supported by the Programme AlBan, the European Union Programme
of High Level Scholarships for Latin America, scholarship no. E04M03892BR”
SILVEIRA, F. M. A LabVIEW Based Synchronized Data Acquisition System with
Integrated Webcam for Welding Processes. 2006. p. 156. Master Dissertation, Federal University of Uberlândia, Uberlândia.
Abstract
The development of data acquisition techniques able to monitor the performance of an automated welding system could be, for example, applied to a system able to repair pipes full of operating fluid. In this case, the system must precisely control and monitor the heat input during the weld. For this purpose, it would be necessary to develop data acquisition techniques able to monitor the performance of such a system. Digital oscilloscopes, which are usually the kind of equipment used for this purpose, present high-cost as well as other solutions offered by the market. Moreover, those systems do not offer a specific solution to the welding area. Thus, the aim of this work was to develop a synchronized data acquisition system with integrated webcam that was suitable for the study of the several types of welding processes. It could be used for automation of pipeline repair systems, as well as, for other types of welding operations, including experimental evaluations into laboratories. A software package was developed using LabVIEW as programming language. It is able to do synchronized acquisition of signals and image and post analysis of the acquired data. The use of low-cost cameras like webcams was introduced aiming to determine arc characteristics as arc length, for instance. The acquisition of the emitted sound by the arc during the welding was also considered, what could increase the feeling of the professional working away and could be used for studies related to welding quality. Using the existent resources in the laboratory, a hardware prototype with enough flexibility and suitable for several types of welding processes was designed. Afterwards, a system with a physical configuration more appropriate to the work environment and lower cost was built. This system was assessed with two different welding operations, Gas Metal Arc Welding and Resistance Spot Welding, when its limitations and advantages were explored and identified.
SILVEIRA, F. M. Sistema de Aquisição de Dados Sincronizado Integrado com Webcam
para Processos de Soldagem Baseado em LabView. 2006. 156 p. Dissertação de
Mestrado, Universidade Federal de Uberlândia, Uberlândia.
Resumo
O desenvolvimento de técnicas de aquisição de dados capazes de monitorar o desempenho de um sistema de soldagem automatizado pode ser aplicado, por exemplo, à um sistema capaz de fazer reparos em dutos cheios de fluídos em operação. Nesse caso, o sistema deve precisamente controlar e monitorar a entrada de calor enquanto a solda é feita. Os osciloscópios digitais, que são geralmente os aparelhos utilizados para esse fim, apresentam custo bastante elevado, assim como outras soluções existentes no mercado. Além disso, esses sistemas não oferecem uma solução específica para a área de soldagem. Assim, o objetivo desse trabalho foi desenvolver um sistema de aquisição de dados sincronizado integrado com webcam para uso no estudo dos diversos tipos de processos de soldagem. Esse sistema poderia tanto ser usado para automação de sistemas de reparo de dutos assim como para outros tipos de operações de soldagem, inclusive avaliações experimentais em laboratórios. Desenvolveu-se um programa em LabView capaz de realizar a aquisição de sinais e imagem de forma sincronizada e ainda oferecer recursos para uma análise posterior dos dados adquiridos. Introduziu-se o uso de câmeras de baixo custo, como as webcams, objetivando a determinação de características do arco voltaico, como por exemplo, o seu comprimento. Também se considerou a aquisição do som emitido pelo arco durante a soldagem, o que poderia ajudar um profissional trabalhando à distância e também ser utilizado para estudos relacionados à qualidade da solda. A partir dos recursos oferecidos em laboratório, construiu-se um protótipo de equipamento flexível o bastante para atender diversos tipos de processos de soldagem. Em seguida, construiu-se um sistema com uma configuração física mais apropriada ao ambiente de trabalho. Este sistema foi avaliado em duas diferentes operações de soldagem, soldagem MIG e soldagem a ponto por resistência, quando suas limitações e vantagens foram exploradas e identificadas.
LIST OF SYMBOLS AND ABREVIATIONS
PIG Pipeline Inspector Gauge
WERC Welding Engineering Research Centre
LAPROSOLDA Laboratory for the Development of Welding Processes AWS American Welding Society
AC Alternate Current
DC Direct Current
GMAW Gas Metal Arc Welding
RSW Resistance Spot Welding CAPS Cranfield Automated Pipewelding System
CCD Charge Coupled Device
DAQ Data Acquisition
DMA Direct Memory Access
PCI Peripheral Component Interconnect USB Universal Serial Bus
HS High-Speed
NI National Instruments
AIGND Analog Input Ground
CMRR Common-Mode Rejection Ratio
NRSE Non-Referenced Single-Ended AISENSE Single-Node Analog Input Sense
ADC Analog-to-Digital Converter LSB Least Significant Bit
DNL Differential Nonlinearity DAC Digital-to-Analog Converter I/O Input/Output
RF Radio Frequency
LAN Local Area Network
PCMCIA Personal Computer Memory Card Interface Adapter GPS Global Positioning System
INDEX
CHAPTER 1 - INTRODUCTION... 1
CHAPTER 2 - LITERATURE REVIEW ... 3
2.1WELDING PROCESSES... 3
2.2ARC WELDING MONITORING AND ANALYSIS... 7
2.3DATA ACQUISITION... 10
2.3.1 Concepts... 10
2.3.2 Systems ... 16
2.4LABVIEW... 21
CHAPTER 3 - METHODOLOGY AND DEVELOPMENT ... 23
3.1HARDWARE PROJECT... 24
3.2SOFTWARE PROJECT... 32
3.3CALIBRATION... 124
3.4SYSTEM CONFIGURATION... 125
CHAPTER 4- EVALUATION OF THE SYSTEM "SMART"... 134
4.1FIRST SET OF EXPERIMENTAL TRIALS – SINGLE WIRE GMAW... 134
4.2SECOND SET OF EXPERIMENTAL TRIALS – DOUBLE WIRE GMAW ... 139
4.3THIRD SET OF EXPERIMENTAL TRIALS –RSW ... 144
CHAPTER 5 - DISCUSSION... 149
CHAPTER 6 - FUTURE DEVELOPMENTS... 149
CHAPTER 7 - CONCLUSIONS... 154
CHAPTER 1
INTRODUCTION
Underground oil and gas pipelines are susceptible to corrosion and other damage on the outside surface of the pipe. Many pipelines have now been in service for periods of up to 50 years and these lines will continue in use for a foreseeable future. It is common for pipelines to be inspected by an internal Pipeline Inspection Gauge (PIG). This device travels along inside the pipe propelled by the media flow and uses ultrasonic or other sensing methods to determine areas where pipe wall thinning may have occurred, as shown by Figure 1.1 and Figure 1.2. These areas are, then, excavated and the pipe is repaired, while still carrying its operating fluid (commonly oil or natural gas). Methods have been developed to restrict the possibility of burn-through while making a weld repair on a live pipeline, but these methods depend on the accurate control of heat point. This can be most easily achieved by application of an automated welding system, where heat input can be precisely controlled and monitored. In addition, the use of an automated system offers the possibility of remote operation of the equipment. So, that personnel would not be required do be in the immediate vicinity of the pipeline while the repair takes place.
Figure 1.1 - UltraScan Smart PIG (Pipetronix Inc.)
Cranfield University - UK, through its Welding Engineering Research Centre (WERC), has already examined the concept of automating pipeline repair, by using a repair welding head mounted on two bands encircling the pipe, of the type often used for pipeline construction. The welding head can, then, be driven round the pipe, and also along the length of the pipe, with accurate control of the welding torch position at any point round the pipeline. This system can be then used for making either of the two principal types of welding repair employed in the field: build-up layers of weld metal to replace the steel lost in thinned area, or to weld half-pipes round the pipes in a clamshell arrangement, to cover the area where thinning has occurred.
In order to develop such a project, a microprocessor-based control system must be also developed to operate the mechanical hardware. For this purpose, one of the required tasks must be the development of rules from which welding procedures and parameters could be adjusted to compensate for variations in welding conditions. This task requires analysis of welding experiments and development of control algorithms to adjust welding parameters. Hence, it must be also necessary to develop and integrate sensors with the welding system, and to develop data acquisition techniques to monitor the performance of welding.
Data acquisition systems have been improved along the years. Most of them acquire signals while an on-line analysis of the weld performance is carried out. Then, it is possible to act on the welding parameters in order to adjust a better work setting. The data can also be recorded for a post-analysis. Since acquisition is usually done in different types of work environments, these systems have also shown portability as an important characteristic. However, studies of applications for low-cost cameras integrated to data acquisition systems are still not very explored. Since they are much cheaper if compared to the high-speed cameras, this kind of study becomes very worthwhile.
CHAPTER 2
LITERATURE REVIEW
2.1 Welding Processes
The American Welding Society (AWS) definition, according to The ARCON Welding Inc. (2005)
,
for a welding process is "a materials joining process which produces coalescence of materials by heating them to suitable temperatures with or without the application of pressure or by the application of pressure alone and with or without the use of filler material". Following this definition, there are two classes of welding processes, fusion welding (in which the coalescence happens during the fusion of the joint) and pressure welding (in which the coalescence happens through heating below the fusion temperature and pressuring over the parts).According to The Lincoln Electric Inc. (1994), welding used to be done by heating metals and pounding or ramming them together (pressure welding) until obtaining the coalescence between them. In the early 1800’s was discovered that a voltaic arc could be created with a high-voltage electric circuit by bringing two terminals near each other (fusion welding). The heat produced by the arc could be used for joining the desirable parts. Figure 2.1 illustrates a basic arc welding circuit. Since then, the welding has been developed a lot, but only in the beginning of the 19th century the process became commercially available. Fusion welding is still an important way of joining materials, being the main heat source the arc voltaic.
molten metal is produced and solidifies behind the electrode as it is moved along the joint being welding. The result is a fusion bond and the metallurgical unification of the workpieces.
Figure 2.1 - The basic arc-welding circuit (The Lincoln Electric Inc., 1994)
Many studies have been done in order to improve the heat efficiency, welding quality and productivity, besides the adaptability to the work environment and to the many types of materials. That is why several types of welding processes have shown up. AWS has grouped them together according to the "mode of energy transfer" as the primary consideration. A secondary factor is the "influence of capillary attraction in effecting distribution of filler metal" in the joint. Capillary attraction distinguishes the welding processes grouped under "Brazing" and "Soldering" from "Arc Welding", "Gas Welding", "Resistance Welding", "Solid State Welding", and "Other Processes." The welding processes, in their official groupings, are shown by Table 2.1. This table also shows the American letter designation for each process.
Table 2.1 - Welding and allied processes with the correspondent letter designation by AWS (according to ARCON Welding Inc., 2005)
Group Welding Process Letter Designation
Arc welding Carbon Arc CAW Flux Cored Arc FCAW Gas Metal Arc GMAW Gas Tungsten Arc GTAW Plasma Arc PAW Shielded Metal Arc SMAW Stud Arc SW Submerged Arc SAW Brazing Diffusion Brazing DFB
Dip Brazing DB Furnace Brazing FB Induction Brazing IB Infrared Brazing IRB Resistance Brazing RB Torch Brazing TB Oxyfuel Gas Welding Oxyacetylene Welding OAW
Oxyhydrogen Welding OHW Pressure Gas Welding PGW Resistance Welding Flash Welding FW
High Frequency Resistance HFRW Percussion Welding PEW Projection Welding RPW Resistance-Seam Welding RSEW Resistance-Spot Welding RSW Upset Welding UW Solid State Welding Cold Welding CW Diffusion Welding DFW Explosion Welding EXW Forge Welding FOW Friction Welding FRW Hot Pressure Welding HPW Roll Welding ROW Ultrasonic Welding USW Soldering Dip Soldering DS
Furnace Soldering FS Induction Soldering IS Infrared Soldering IRS Iron Soldering INS Resistance Soldering RS Torch Soldering TS Wave Soldering WS Other Welding Processes Electron Beam EBW
Electroslag ESW
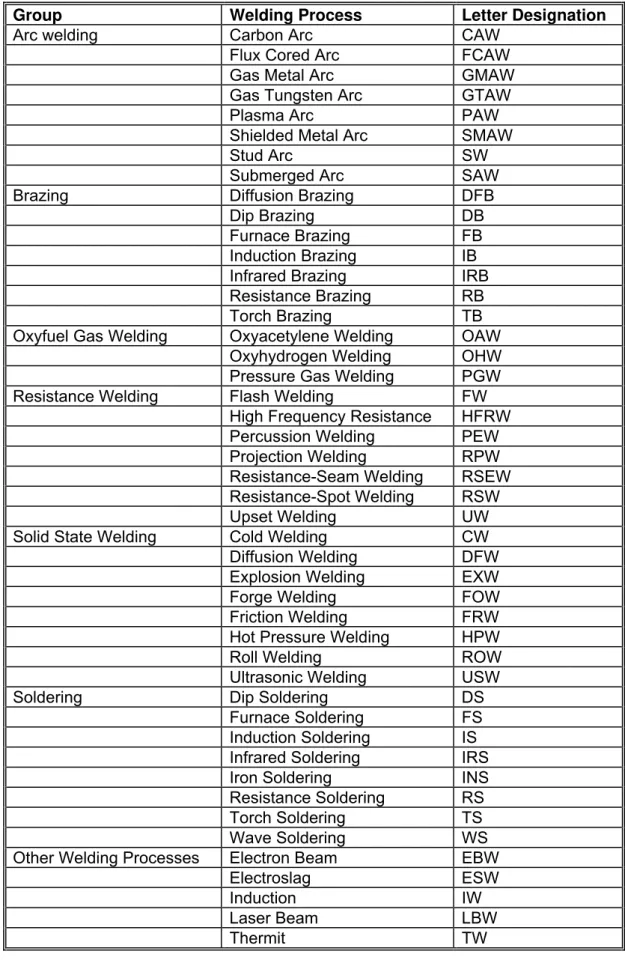
Figure 2.2 - GMAW – Diagram process (CARY, 1995)
This welding process is the most popular method for automated systems because the electrode wire is continuous (CARY, 1995). As a continuous-wire process, it has a high operator factor and as due to the high current density capability (short electrodes), this process provides high deposition rate. Furthermore, it is an all-position welding process, what allows an orbital welding execution. Those are the main reasons why this welding process is used by all industrial manufacturing operations. It is also used for field construction, including pipelines, and for maintenance and repair work.
GMAW can be classified into Single and Double Wire. Single GMAW uses only one wire through one torch. Double Wire class, in turn, can be divided into two other classes, i.e, Single Potential (also miscalled twin arc), in which two wires are fed through one contact tip, and Isolated Potential (so called Tandem), in which there are two contact tips into the same torch, as shown by Figure 2.3. There is a combination called Dual Tandem GMAW, which uses two torches, having two wires each one, as Figure 2.4 shows. This is the most productive GMAW method and many studies about it have been done. That is why the data acquisition system developed in this work will be based on Dual Tandem GMAW limits.
Figure 2.3 - Cranfield Tandem GMAW (WIDGERY; BLACKMAN, 2001)
Figure 2.4 - CAPS Dual Tandem welding torches (WIDGERY; BLACKMAN, 2001)
2.2 Arc Welding Monitoring and Analysis
Figure 2.5 - Live Video Feed from Weld Camera (GILSINN et al., 1999)
A more recent work (MASON et al., 2005) presents another application for the low-cost cameras. A great deal of past and present research overlooks one of the most important components of the resistance spot welding process, the electrode, of which its profile (tip) has a direct effect on the quality of the weld. As the number of welds increase, the electrode tip wears down and therefore the applied current is increased in order to maintain the same current density. Mason et al. (2005) introduced a way to monitor the electrode profile, by using a compact low-cost camera integrated into a PC.
Another application of a camera monitoring system is arc length measurements. Arc voltage can give an idea about the arc behaviour; it means to check if the arc is longer or shorter, but not its length as a measurement. Through arc welding images, the arc length could be calculated. Using a compact arc light sensor, Li and Zhang (2001) managed to measure the arc length with adequate accuracy. According to them, the arc length determines the distribution of the arc energy and, thus, the heat input and width of the weld. In their work, they aimed at improving the measurement accuracy of arc length by using the spectrum of arc light at a particular wavelength during gas tungsten arc welding (GTAW) with argon shield.
Maeda and Ichiyama (1999) developed an adaptive control of arc welding by image processing. A CCD camera with an electronic trigger shutter was used for acquiring images of a molten weld pool. For this purpose, an image acquisition algorithm was also developed aiming to detect the pool edge and the centre of the electrode wire through the image. They managed to develop a system less susceptible to the external influences as spattering during welding.
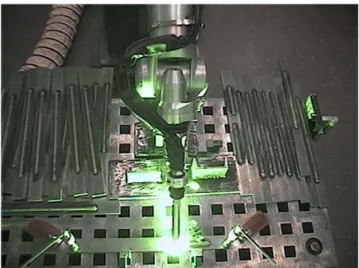
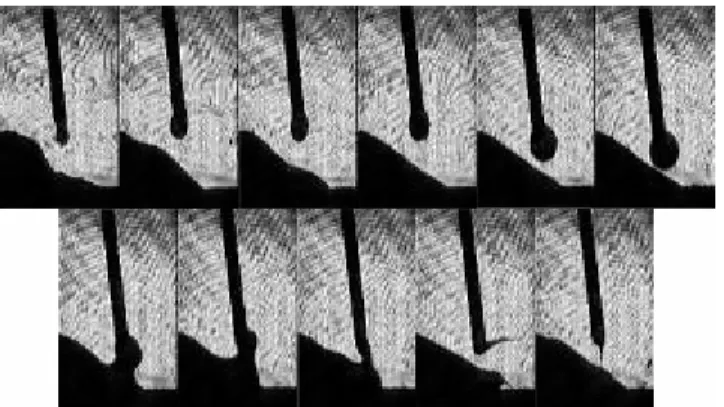
metal transfer mode analysis, as shown in Figure 2.6. Bálsamo et. al (2000) shows that the use of high-speed cameras allows a more precise measurement of both the metal transfer mode and metal transfer size. Thus, in their work, they correlate the droplet and dimensions with current and voltage signals, on a time base, by the development of a data acquisition technique suitable for GMAW metal transfer analysis. Alfaro et. al (2005) also developed such a system, but suitable for RSW parameters setup.
Figure 2.6 - Photo sequence of transfer in the globular/short circuit mode (FERRARESI; FIGUEIREDO; ONG, 2003)
Another research trend is the analysis of the sound emitted by the arc welding, which has been used more and more in studies related to welding quality. A high-speed data acquisition system was developed by Mansoor and Huissoon (1999) to record and analyse the arc sound produced during GMAW. The recorded data was processed to obtain time domain, frequency domain and time-frequency domain descriptors. Relationships between these descriptors and the originating weld parameter levels and metal transfer mode were investigated, as there were relationships between the electrical power supplied to the weld and the arc sound. Results indicate that the arc sound exhibits distinct characteristics for each metal transfer mode. The occurrence of spatter and short circuits was also found to be clearly detectable in the arc sound record.
2.3 Data Acquisition
2.3.1 Concepts
In nowadays concepts, data acquisition involves a lot more than a few sensors for electrical signals. There are ever-increasing demands on the systems to record other types of data as well. More data being acquired at the same time requires more powerful computers and acquisition boards. It means that the capabilities of the computer can significantly affect the performance of the Data AcQuisition (DAQ) system.
Twenty years ago, PCs were capable of transferring at rates around 5MHz, although today’s computers can transfer significantly faster (National Instruments Inc. - Application Note 007). They are capable of DMA (Direct Memory Access) and interrupt data transfers. DMA transfers increase the system throughput by using dedicated hardware to transfer data directly into system memory. Using this method, the processor is not burdened with moving data and it is, therefore, free to engage in more complex processing tasks. To reap the benefits of DMA or interrupt transfers, the DAQ device must be capable of these transfer types. While PCI and FireWire devices offer both DMA and interrupt-based transfers, PCMCIA and USB devices only use interrupt-based transfers. Depending on how much processing is needed during data transfer, the rate at which the data is transferred from the DAQ device to PC memory may be affected by the data transfer mechanism.
Besides these capability concerns, the choice of sensors it is also very important in a DAQ system’s development. Also named transducers, they are devices that convert one type of physical phenomenon, such as temperature, strain, pressure, or light into another (National Instruments Inc. - Application Note 048). The most common transducers convert physical quantities to electrical quantities, such as voltage or resistance. Transducer characteristics define many of the signal conditioning requirements of the measurement system. Table 2.2 summarizes the basic characteristics and conditioning requirements of some common transducers.
The data acquisition devices can have analog input/output, digital input/output or counters/timers. If it has all of them, it is called multifunction device. The number of channels, the sampling rate, the resolution and the input range are parameters that specify the analog inputs.
short (less than 15ft), and all input signals share a common ground reference. If the signals do not meet these criteria, it is necessary to use differential inputs. With differential inputs, each input has its own ground reference; noise errors are reduced because the common-mode noise picked up by the leads is cancelled out.
Table 2.2 - Transducers and signal conditioning requirements (National Instruments Inc.)
Sensor Electrical Characteristics Signal Conditioning Requirement
Thermocouple Low-voltage output Low sensitivity Nonlinear output
Reference temperature sensor (for cold-junction compensation) High amplification
Linearization RTD Low resistance (100 ohms
typical) Low sensitivity Nonlinear output Current excitation Four-wire/three-wire configuration Linearization
Strain gauge Low resistance device Low sensitivity
Nonlinear output
Voltage or current excitation High amplification Bridge completion Linearization Shunt calibration Current output device
Current loop output (4 -- 20mA typical)
Precision resistor Thermistor Resistive device
High resistance and sensitivity Very nonlinear output
Current excitation or voltage excitation with reference resistor Linearization
Active
Accelerometers
High-level voltage or current output Linear output Power source Moderate amplification AC Linear Variable Differential Transformer (LVDT)
AC voltage output AC excitation Demodulation Linearization
Figure 2.7 - Differential measurement system (National Instruments Inc.)
An ideal differential measurement system responds only to the potential difference between its two terminals - the positive (+) and negative (-) inputs. A common-mode voltage is any voltage measured with respect to the instrumentation amplifier ground present at both amplifier inputs. An ideal differential measurement system completely rejects, or does not measure, common-mode voltage. Rejecting common-mode voltage is useful because unwanted noise often is introduced as common-mode voltage in the circuit that makes up the cabling system of a measurement system. However, several factors, such as the common-mode voltage range and the common-common-mode rejection ratio (CMRR) parameters, limit the ability of practical, real-world differential measurement systems to reject the common-mode voltage.
Figure 2.8 - Referenced single-ended measurement system (National Instruments Inc.)
DAQ devices often use a non-referenced single-ended (NRSE) measurement technique, or pseudo-differential measurement, which is a variant of the referenced single-ended measurement technique. Figure 2.9 shows a NRSE system.
Figure 2.9 - NRSE measurement system (National Instruments Inc.)
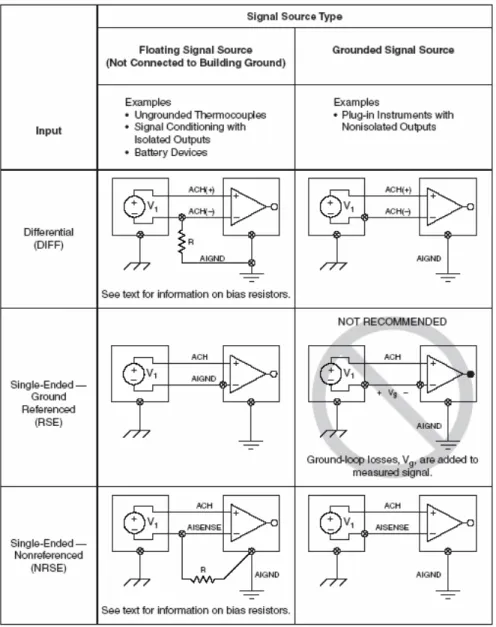
Figure 2.10 - Connecting a Signal Source to a Measurement System (National Instruments Inc.)
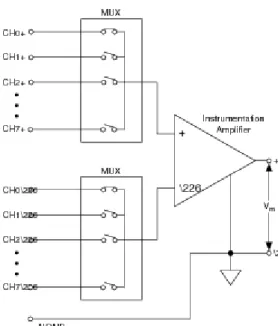
The sampling rate determines how often conversions can take place. A faster sampling rate acquires more data in a given time and can therefore often form a better representation of the original signal. Data can be sampled simultaneously, with multiple converters, or it can be multiplexed, where the analog-to-digital converter (ADC) samples one channel, switches to the next channel, samples it, switches to the next channel, and so on. Multiplexing is a common technique for measuring several signals with a single ADC.
It is also important to consider the differential nonlinearity (DNL), relative accuracy, settling time of the instrumentation amplifier and noise. As the level of voltage applied to a DAQ device is increased, the digital codes from the ADC should also increase linearly (Application Note 007 - National Instruments Inc.). If voltage versus the output code from an ideal ADC is plotted, the result would be a straight line. Deviations from this ideal straight line are specified as nonlinearity. DNL is a measure in LSB (Least Significant Bit) of the worst-case deviation of code widths from their ideal value of 1 LSB. An ideal DAQ device has a DNL of 0 LSB. In practical terms, a good DAQ device will have a DNL of ±0.5 LSB. Poor DNL reduces the resolution of the device.
Relative accuracy is a measure in LSBs of the worst-case deviation from the ideal DAQ device transfer function, a straight line. Relative accuracy is determined on a DAQ device by connecting a voltage at negative full scale, digitizing the voltage, increasing the voltage, and repeating the steps until the input range of the device has been covered. When the digitized points are plotted, the result must be a straight line. Obtaining good relative accuracy requires that both the Analog-to-Digital Converter (ADC) and the surrounding analog circuitry are properly designed.
Settling time is the time required for an amplifier, relays, or other circuits to reach a stable mode of operation. This parameter has to be as lower as possible, even when working with high gains and sampling rates, in order to avoid delays.
Any unwanted signal that appears in the digitized signal of the DAQ device is noise. Because the PC is a noisy digital environment, acquiring data on a plug-in device takes a careful layout on multiple-layer DAQ boards by skilled analog designers. Simply placing an ADC, instrumentation amplifier, and bus interface circuitry on a one or two-layer board will likely result in a very noisy device. Designers can use metal shielding on a DAQ device to help reduce noise. Proper shielding not only should be added around sensitive analog sections on a DAQ device, but also must be built into the layers of the device with ground planes.
Analog output circuitry is often required to provide stimuli for a DAQ system. The settling time, slew rate and output resolution determine the quality of the output signal produced for the Digital-to-Analog Converter (DAC). Slew rate means the maximum rate of change that the DAC can produce on the output signal. Settling time and slew rate work together in determining how quickly the DAC changes the output signal level. Therefore, a DAC with a small settling time and a high slew rate can generate high-frequency signals because little time is needed to accurately change the output to a new voltage level.
generate the high frequencies necessary to cover the audio range. In contrast, an example of an application that does not require fast D/A conversion is a voltage source that controls a heater. Because the heater cannot respond quickly to a voltage change, fast D/A conversion is unnecessary.
Digital I/O (DIO) interfaces are often used on PC DAQ systems to control processes, generate patterns for testing, and communicate with peripheral equipment. In each case, the important parameters include the number of digital lines available, the rate at which the system can accept and source digital data on these lines, and the drive capability of the lines. The number of digital lines, of course, should match the number of processes to be controlled. The amount of current required to turn the devices on and off must be less than the available drive current from the device. DIO can also be used in industrial applications, to verify that a switch is open or closed and to check the voltage levels as high or low. It can also be used for high-speed handshaking or simple communication methods. In addition, some devices with digital capabilities will have handshaking circuitry for communication-synchronization purposes. The number of channels, data rate, and handshaking capabilities are all important specifications that should be understood and matched to the application needs.
Counter/timer circuitry is useful for many applications, including counting the occurrences of a digital event, digital pulse timing, and generating square waves and pulses. It is possible to implement all these applications using three counter/timer signals – gate, source, and output. The gate is a digital input used for enabling or disabling the function of the counter. The source is a digital input that causes the counter to increment each time it toggles, and therefore provides the time base for the operation of the counter. The output generates digital square waves and pulses at the output line. The most significant specifications for operation of a counter/timer are the resolution and clock frequency. The resolution is the number of bits the counter uses. A higher resolution simply means that the counter can count higher. The clock frequency determines how fast is possible to toggle the digital source input. With higher frequency, the counter increments faster and therefore can detect higher frequency signals on the input and generate higher frequency pulses and square waves on the output.
2.3.2 Systems
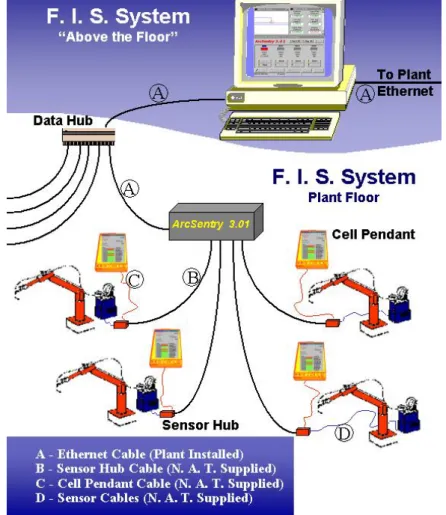
an applied over the last twenty years, from relatively simple system which provide a printout of average values to microprocessor based systems which incorporate sophisticated data analysis. Nowadays, it is very common to use a laptop connected to the data acquisition system for data processing. Since a laptop can be easily substituted if it gets obsolete, insufficient hard disc capability for instance, this configuration provides flexibility for the system. Moreover, all the acquired data and analysis can be stored into only one device, the laptop, being easy to change of work environment. The data can also be transmitted through a network, making possible a remote control. Figure 2.11 shows the “ArcSentry”, a system which provides measurements at multiple cells, transferred to the server computer on either a wire or RF based Ethernet LAN.
Figure 2.11 - ArcSentry System (N.A. Technologies Inc.)
100kHz acquisition rate. They also provide more than 700kbyte/s bidirectional data communication to the PC via an enhanced parallel port (EPP) or PCMCIA link interfaces. A Windows-based data logging application for setting up the acquisition applications and saving acquired data directly to disk is also provided.
Figure 2.12 - OMB-DAQBOOK series (Omega Inc.)
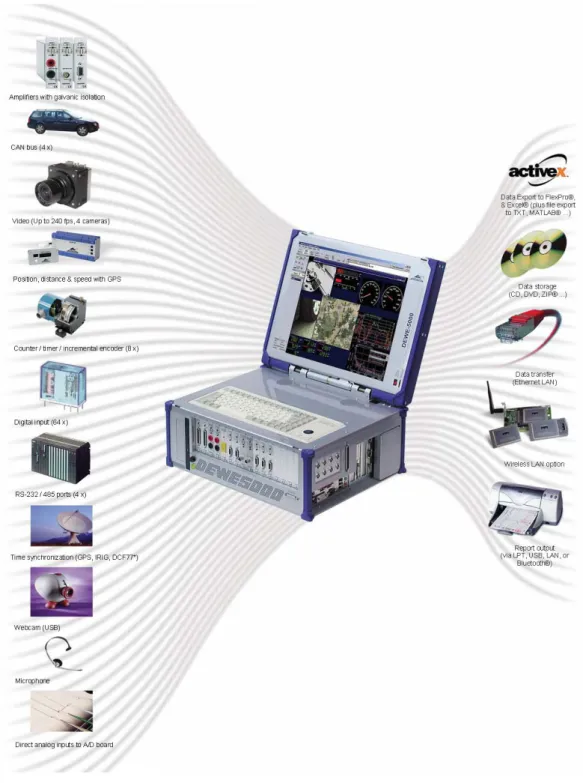
Portable data acquisition systems can also have a briefcase shape. Figure 2.13 shows the DEWE-5000 an industrial PC integrated version and Figure 2.14 shows the DEWE-BOOK series a notebook integrated version, both from DEWETRON. They are very powerful data acquisition systems which record several types of signals such as video, audio, CAN Bus data, position, speed, distance information from GPS satellites and so on, simultaneously and in synch. Moreover, it is also offered A/D cards with 24-bit resolution, simultaneous sampling on all channels (up to 25 MS/s sample rate per channel), robust anti-aliasing filtering, and plug-in signal conditioning modules. Data can also be transmitted by Ethernet or Wireless LAN.
Figure 2.13 - DEWE-5000 series (DEWETRON Inc.)
They can also provide up to 300V of working isolation to voltage and current input/output signals from the DAQ device. Optically isolated digital I/O modules can condition digital lines from the DAQ device or be accessed directly using the 42-pin screw terminal mounted inside the box. Relay modules add switching to the SCC DAQ system makes possible to access Analog Input, Analog Output, Digital I/O, Counter/Timer signals as well as timing and triggering signals from the DAQ device using feedthrough modules. It is also possible to cascade two SCC analog input modules on a single analog input channel, passing an analog input signal through both an attenuator module and a filter module, for instance.
Figure 2.15 - Shielded Carriers (National Instruments Inc.)
Figure 2.16 - SCC Modules (National Instruments Inc.)
Figure 2.18 - Shielded Cable (National Instruments Inc.)
2.4 LabView
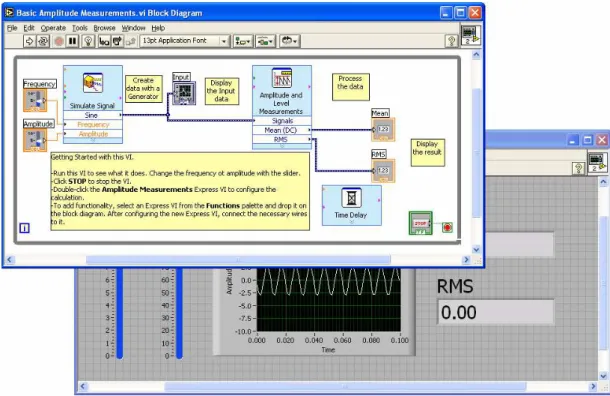
LabVIEW is a graphical development environment by National Instruments for creating flexible and scalable test, measurement and control applications rapidly and at minimal cost. With LabVIEW, engineers and scientists interface with real-world signals, analyze data for meaningful information and share results and applications. Regardless of experience, LabVIEW makes development fast and easy for all users.
In Figure 2.19, the first panel is called Block Diagram. It is where the programming is done. The blocks, which are functions or controls, are connected resulting in a graphical code for the application. The second panel, called front panel, is where the controls are placed. They can be graphs, displays, buttons, etc, composing the application interface.
Data acquisition is simpler to be done with LabVIEW. National Instruments offers NI DAQmx tool. This is a programming package installed on LabVIEW 7.0 and above for data acquisition. With this package, it is possible to set the parameters of the physical channels of the DAQ devices. It is done by creating virtual channels. It means that for each physical channel is possible to have many different configurations. Thus, the same physical channel of the DAQ device can be used by different applications. A virtual channel can be created by using the DAQmx blocks or by the Measurement & Automation Explorer (MAX), which is an application included in the LabVIEW package for device configuration. Besides the configuration, it is also possible to calibrate the DAQ board for different environment temperatures, what must be done every time the work environment is changed.
CHAPTER 3
METHODOLOGY AND DEVELOPMENT
As mentioned at the end of the Introduction (Chapter 1), the objective of this work was the development of a data acquisition system projected for the study of the several types of welding processes. This target, named here SMART, had to be able to do a synchronous acquisition of electrical signals and frames of an USB camera, and trigger a high-speed (HS) camera that would start to acquire frames, independently. The acquired data would be stored for a frame-by-frame post-analysis. It means to correlate each frame of the USB or HS camera images and the acquired signals (voltage, current, temperature, sound, etc), on a time-base, characterizing a visual analysis of the arc welding.
Besides that, SMART had to offer portability, too. For this purpose, a PCMCIA acquisition board and a laptop would be responsible for acquiring and storing data, respectively. In order to make easy the transportation of the system, a briefcase shape had to be adopted, where the cables, the signal conditioning module and the laptop could be kept.
Flexibility had to be offered as well. Therefore, for each different type of signal to be acquired, a suitable signal conditioning module would be plugged into a signal conditioning unit. It means to make possible the acquisition of any kind of signal since it is used the adequate module.
From the methodological point of view, the development of this system had to be based on National Instruments (NI) resources (hardware and software). Cranfield University had already bought most of the necessary equipment, which was NI brand, to develop this system. Moreover, they also had an academic license of LabView, the programming language used for developing the software. Besides that, the NI resources offer flexibility. There are many types of signal conditioning modules which can be easily plugged to a signal conditioning unit, all of them offered by National Instruments. In addition, future modifications in a LabView based software are, usually, simple to be done.
using a laptop, these signals, the frames of the USB and the HS cameras had to be synchronously acquired. Afterwards, it will be described the hardware and software projects developed to compose this system.
3.1 Hardware Project
The standard configuration established for the hardware has connectors for 4 voltages, 4 currents, 2 temperatures and 1 trigger output. Connectors for digital I/Os, analog outputs and additional analog inputs are also available. Since the development of the system is based on National Instruments (NI) resources connected to a laptop, an ideal acquisition board is the DAQCard-6062E, for PCMCIA bus. It has 16 single-ended analog inputs, an input resolution of 12-bit and an input range from
±
0.05 to±
10V. Taking these parameters, it was possible to characterize the necessary signal conditioning modules for the intended system configuration.In order to use the whole scale background, it is necessary to amplify the input signals making their maximum value equal to 10V. Since the welding signals can be DC (Direct Current) or AC (Alternate Current), the taken minimum value for the scale background would be -10V, but for the standard configuration was taken 0V, for DC signals only. Equation 3.1 represents the gain for making this conditioning. Equation 3.2
represents the
minimum possible detectable value of the input signal after being conditioned, where
scale_gain
is given by
Equation 3.3. If the input signal fits the whole scale background,
scale_gain
is equal to 1, since
conditioned_signal_range
is equal to
scale_range
.
range
signal
range
scale
gain
ng
conditioni
_
_
_
=
122
*
_
_
gain
scale
range
signal
LSB
=
range
scale
range
signal
d
conditione
gain
scale
_
_
_
_
=
Equation 3.1 Equation 3.2 Equation 3.3Voltage
For signal_range from 0V to 100V the nearest scale_range goes from 0V to 10V.
1
.
0
0
100
0
10
_
=
−
−
=
gain
ng
conditioni
mV
LSB
25
2
0
100
12≅
−
=
It means that it is necessary a signal attenuator with gain equal to 0.1 and the lowest detectable amplitude is 25mV. In this case, the NI SCC-A10 Voltage Attenuator Module is the most adequate one.
Current
If signal_range goes from 0 to 1000A and current sensor sensibility is equal to 1mV/A, then signal_range goes from 0 to 1V and the nearest scale_range goes from 0 to 1V.
1
)
0
1
(
)
0
1
(
_
=
−
−
=
gain
ng
conditioni
mA
LSB
245
2
)
0
1000
(
12≅
−
=
It means that amplification is not necessary and the lowest detectable amplitude is 245mA. Since it is not necessary any conditioning module and there is no any suitable signal input for it in the NI SCC-2345 device (the signal conditioning unit chosen for this system),
devices for making possible these signal inputs were built, asFigure 3.1shows.
Figure 3.1: Input modules for current signals
Temperature
If signal_range goes from 0oC to 1600oC (considering that welding temperatures are always positive) and R/S thermocouple sensibility is equal to 10µV/oC, then signal_range
goes from 0 to 16mV and the nearest scale_range would go from 0 to 100mV. But thermocouple signals must be amplified in order to increase the SNR (Signal-Noise Rate). Establishing conditioning_gain equal to 100, signal_range goes from 0 to 1.6V and the nearest scale_range goes from 0 to 2V.
8
.
0
2
6
.
1
_
gain
=
=
scale
C
LSB
0
.
5
o2
*
8
.
0
)
0
1600
(
12≅
−
=
It means that it is necessary a signal amplifier with gain equal to 100 and the lowest detectable amplitude is 0.5oC. In this case, the NI SCC-TC02 Thermocouple Input Module is the most adequate one.
Since the welding environment is very noisy, it is necessary to use a low-pass filter for every analog input signal in order to avoid aliasing. For this purpose, a RC low-pass filter (1 pole), as shown by Figure 3.2, was attached to each analog input connector. The cut-off frequency is given by Equation 3.4.
Figure 3.2: Butterworth low-pass filter
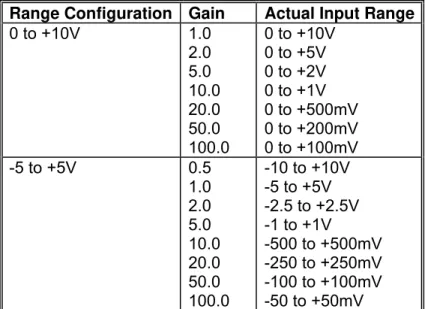
Table 3.1: Input Ranges for NI 6020E, NI 6040E, NI 6052E, NI 6062E, and NI 6070E/6071E acquisition boards
Range Configuration Gain Actual Input Range
0 to +10V 1.0 2.0 5.0 10.0 20.0 50.0 100.0
0 to +10V 0 to +5V 0 to +2V 0 to +1V 0 to +500mV 0 to +200mV 0 to +100mV -5 to +5V 0.5
1.0 2.0 5.0 10.0 20.0 50.0 100.0
RC
fc
π
2
1
=
Equation 3.4For
fc
=
10
kHz
andC=10nF, R=1.5kΩ.Actually, the ideal resistor would be R=1.6kΩ, but the nearest value existent in the laboratory was 1.5kΩ, which produces fc=10.61kHz. This cut-off frequency was chosen in order to permit high-frequencies acquisition, for instance the audio signals (in this case, an amplifier module has to be used). The Nyquist Theorem says that the sampling rate has to be at least 2 times the highest signal frequency to be acquired. It means that a minimum sampling rate for each channel is 20kS/s. When a narrow frequency range is wanted, a digital filter has to be used. For this purpose, a Butterworth low-pass digital filter was implemented for the system. The cut-off frequency has always to be less than half sampling rate. So, the cut-off frequency range for this filter goes from 1 to 10kHz and can have 1, 2, 3, 4 or 5 poles.
The acquisition board of the system is the DAQCard-6062E which has 16 single-ended analog inputs, 2 analog outputs, 8 digital I/Os, 2 counter/timers and 1 analog trigger. The sampling rate is 500kS/s. Since it is used only 12 analog inputs for the standard configuration, the maximum sampling rate for each channel is around 40kS/s. The resolution for the analog outputs is also 12-bit, the output range
±
10V and the output rate is 850kS/s.Following the idea of portability, it was used a briefcase to compose the system, as shown by Figure 3.3. An aluminium panel was built in order to place the I/O connectors. It can be opened and the laptop can be kept inside the briefcase, on the lid of the signal conditioning unit placed on the bottom of the briefcase. Eventually, the briefcase’s lid can be used for keeping loose cables.
Figure 3.3: Briefcase used for composing the system
I/O connectors
briefcase’s lid
Since most of sensors have BNC connectors as standard, it was used 8 female BNC panel connectors for the 4 voltage and 4 current input signals. In order to connect the voltage signals to their related inputs, 4 cables (2 meters length each) were built, being one extremity finished with a male BNC connector and the other one finished with two crocodile connectors, according to Figure 3.4.
Figure 3.4: Cable built for voltage signals
The current sensors have already their cables. For the temperature signals it was used 2 mini thermocouple panel connectors and 2 extension cables (2 meters length each), as Figure 3.5 shows.
Figure 3.5: Cable for temperature signals
Figure 3.6: Cable for the trigger of the high-speed camera
Figure 3.7: Circuitry for the trigger cable
It was also used 1 female DB9 connector for digital I/Os, just in case of future modifications in the system need to use it. For additional signals, a hole was left. Figure 3.8 shows the idealized final panel.
The signal conditioning unit lies on the bottom of the briefcase. A top door gives access to this unit, as Figure 3.9 shows. On this door, the laptop can be placed, composing a tidy work environment. Figure 3.10 illustrates how the input and output terminals can be used for connecting signals, as the trigger output, for example.
Figure 3.9: Signal conditioning unit
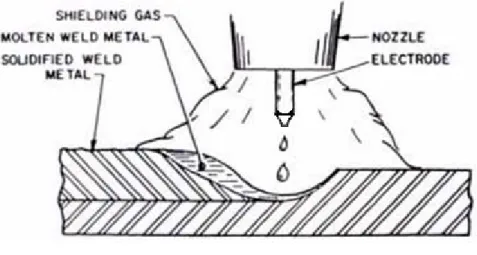
In order to provide more details of the arc welding, it was attached a lens with an adapter to the USB camera, according to Figure 3.11. This lens is a Helios 44M and its focal distance is 58mm.
Filters are necessary to decrease the incident arc brightness and gives definition to the arc image. They are Cokin brand and have the following specifications:
• Ultra-violet (U.V) P231
• Neutral Grey ND4 P153
• Neutral Grey ND2 P152
• Neutral Grey ND8 P154
• Dark
The computer used for performing this system is DELL brand with a Xeon ™ Intel® processor, 2.80GHz, 1GB RAM and USB 2.0 ports to plug the webcam.
signal conditioning unit’s door
Figure 3.10: Detail that schemes the input and output terminals of the signal conditioning unit and shows the trigger output
3.2 Software Project
The software was developed in LabVIEW 7.1 for Windows XP because it is an easy programming language and the standard in the laboratory, since the university has an academic license provided by National Instruments. Programming in LabView is relatively simple. The objects which belong to the function are placed on the “Front Panel”. This function can be configured to work as a window and will show up, when executed. The code is built on the “Block Diagram”, where these objects are linked to other functions. Afterwards, it will be described the software development. The following figures can be better visualized on the computer, where zoom tools are available, than on the printed version of this thesis.
Figure 3.12 shows the main window. All the signals selected by using the button “Channels” are plotted on the graph “Signal”. The three buttons on the left and under this graph make possible to move the cursor and zoom the plots. The boxes on the right show the current position of the cursor. The three other buttons can be used for configuring the plots and move the cursor.
The webcam frames are placed on “USB Camera” and the high-speed camera frames on “HS Camera”. There are five buttons under these image graphs: play, backward, forward, pause and stop. Pressing play, the webcam frames play until pause or stop is pressed, or the last frame is reached. Pressing pause, the current frame is shown and it is the reference for next executions. Pressing stop, the current frame is also shown, but the first frame (frame zero) will be the next one, when a new execution is done. Pressing the backward and the forward buttons, the previous and the next frames are shown, respectively. The box “Frame” displays the number of the frame.
Pressing “Start” the acquisition starts and the red LED is turned on. Pressing “Stop” the acquisition stops and this LED is turned off. The box “Project” contains the path of the folder where the project file is saved.
Figure 3.13 shows the code that builds the menus which appear on the top of the main window when the software is executed. They are File (items: New File, Open File, Save as xls), Acquisition (items: Setup Signal, Setup Image, Filter) and Camera (item: Settings).
After building the menus, the software becomes a main sequence divided into three frames. The first one makes the initialization of all variables. The second one makes the calibration of the system. And the third one, more complex, is the core of the system.
Figure 3.12: Illustration of the main window, referred in the project as function “Main”
The value of the variable “Delay” is set as 0.0026 seconds. This is a constant value used for calculating the frame of the HS camera that should be plotted, when a frame-by-frame analysis is executed. This value was chosen after some trials, as chapter 4 explains.
The value of the variable “dt USB” is 0.1 seconds. This is a constant interval of time used for acquiring each frame of the USB camera and read the correspondent buffer of data coming from the acquisition board.
The other variables and objects receive default values, which can be modified during the execution of the system.
Figure 3.14: Illustration of the code that initializes the variables and objects of the function “Main”
Figure 3.15: Illustration of the code that shows a warning message when no acquisition board is plugged to the computer
Figure 3.16: Illustration of the code that calibrates and resets the acquisition board
was necessary because the system was presenting a delay before starting to acquire data, when it was run for the first time. Probably this is due to its dependence on the webcam.
Figure 3.17: Illustration of the code that shows a warning message when no USB camera is connected
Figure 3.19 represents the function “Image Test”, which makes this short acquisition. First, all the initializations are done, according to Figure 3.20. Afterwards, the data acquisition is carried out, although no any sample is saved, as Figure 3.21 illustrates.
Figure 3.19: Illustration of the front panel of the function “ImageTest”
Figure 3.21: Illustration of the code of the function “ImageTest” that does a short acquisition for the calibration of the system
The third frame of the sequence is more complex. It is composed by event frames. The first one is “Menu Selection”, which is a sequence of frames, the items of the menu. Figure 3.22 shows the first one, “New File…”, where nothing happens if a new project file is not chosen, otherwise those variables are reset and a new project file is created. This file receives the extension *.prj and it is where the values of the variables used during the data acquisition are saved. Thus, it is not necessary to reconfigure the system every time it runs.
Figure 3.23 illustrates the function responsible for creating new files. A window asking the name of the new project file shows up. If it is not cancelled and the chosen name already exists, a dialog box does the following question “Do you want to replace <file>?”. If “Yes”, this file is deleted and a new one is created. If “No”, nothing happens. If the file does not exist, a new one is straight created. Figure 3.24 and Figure 3.25 illustrate how it works.
an excel file) and *.avi (for videos), with the same name of the project file. If these files already exist, they are deleted. Figure 3.27 shows how it works.
Figure 3.22: Illustration of the code that shows the item “New File…” of the “Menu Selection”
Figure 3.23: Illustration of the front panel of the function “New File”
Figure 3.25: Illustration of the code that shows the function “New File” asking a name for the file to be straight created
Figure 3.26: Illustration of the front panel of the function “Create”
Figure 3.27: Illustration of the code of the function “Create” that creates three new files with the extensions txt, xls and avi
Figure 3.32 shows, and searches the *.txt and *.avi files into the project file’s folder. If they exist, their paths are also read, as Figure 3.33 shows.
Figure 3.28: Illustration of the front panel of the function “Open Project”
Figure 3.29: Illustration of the code of the function “Open Project” that asks the name of the project to be opened and returns txt and avi paths
Figure 3.30: Illustration of the code of the function “Open Project” that asks the name of the project to be opened and returns empty strings for txt and avi paths
Figure 3.32: Illustration of the code of the function “Read” that opens the project and reads its data
Figure 3.34: Illustration of the code that shows the item “Open File…” of the “Menu Selection”
After opening the files and reading their contents, the variables and objects of the system are set. If the txt path is not empty, the number of samples is read by function “NF Signal” (Figure 3.37 and Figure 3.38) and the signals are plotted, as Figure 3.35 shows. Otherwise, only the variable “dt Signal” is set, as shown by Figure 3.36.
Figure 3.36: Illustration of the code that sets a default value for the variable “dt Signal”
Figure 3.37: Illustration of the front panel of the function "NF Signal"
Figure 3.38: Illustration of the code of the function “NF Signal” that reads the txt file and its number of samples
When a project file is opened, a window shows up asking for the correspondent HS camera file. If it is not cancelled and the avi path is not empty, the function “NF HS” (Figure 3.42 and Figure 3.43) reads its number of frames. If the chosen file is the same of the USB camera file, the error message “Error! Choose a different file for the High Speed Camera” shows up. Figure 3.39, Figure 3.40 and Figure 3.41 illustrate how it works.
If the avi path of the USB camera file is not empty, the function “NF USB” (Figure 3.46 and Figure 3.47) reads its number of frames. Figure 3.44 and Figure 3.45 show how it works.